- *Corresponding Author:
- Yunji Xu
Department of General Surgery, University of South China Hengyang, Hunan 421001, China
E-mail: xuyunji1122@163.com
| This article was originally published in a special issue, “Clinical Advancements in Life Sciences and Pharmaceutical Research” |
| Indian J Pharm Sci 2024:86(5) Spl Issue “10-17” |
This is an open access article distributed under the terms of the Creative Commons Attribution-NonCommercial-ShareAlike 3.0 License, which allows others to remix, tweak, and build upon the work non-commercially, as long as the author is credited and the new creations are licensed under the identical terms
Abstract
We identified genes that affect the prognosis of early-onset and conventional gastric cancer and established a clinical prognostic model in gastric cancer. Differentially expressed genes in gastric cancer were identified using Limma analysis from GSE84426 dataset. Weighted gene co-expression network analysis of age-related hub genes in GSE84426 dataset was performed. Venn diagram of the intersecting genes was identified between differentially expressed genes and hub genes. Expression and prognosis of intersection genes were analyzed in the GSE84426 and The Cancer Genome Atlas-gastric cancer datasets. Signaling pathways of the intersecting genes and their correlation with immune cells were analyzed using gene set enrichment analysis, estimating the proportions of immune and cancer cells and estimation of stromal and immune cells in malignant tumor tissues using expression data. Finally, a prognostic model was established using a nomogram in The Cancer Genome Atlas-gastric cancer dataset. Overall, 1021 differentially expressed genes in gastric cancer were identified from the GSE84426 dataset in patients with gastric cancer aged <45 and ≥45 y which were analyzed using weighted gene co-expression network analysis. Based on the correlation between gene significance and module membership where we screened purple and green modules. Regulator of G protein signaling 4 and neuronal regeneration related protein were identified using Venn diagram as the intersection genes between differentially expressed genes and hub genes identified by weighted gene co-expression network analysis. Regulator of G protein signaling 4 and neuronal regeneration related protein were noted to be overexpressed in gastric cancer in patients aged <45 y in GSE84426 dataset compared with the normal tissue. Prognostic value of the overexpression of regulator of G protein signaling 4 and neuronal regeneration related protein were significantly better than that of the underexpression noted in the Cancer Genome Atlas gastric cancer dataset. Regulator of G protein signaling 4 and neuronal regeneration related protein has significant correlation with stromal score, immune score, estimation of stromal and immune cells in malignant tumor tissues using expression score among cells like cluster of differentiation 4 and 8, neutrophils, and macrophages. Both regulator of G protein signaling 4 and neuronal regeneration related protein were overexpressed in early-onset gastric carcinoma and impacted the prognosis of gastric cancer.
Keywords
Gastric cancer, prognosis, carcinoma, neuronal regeneration related protein, chemotherapy
Gastric Cancer (GC) is a common malignant tumor of the gastrointestinal tract and the 4th leading cause of cancer-associated deaths worldwide[1,2]. Notably, 26 500 new cases of GC and 11 130 deaths from it were reported in the United States of America in 2023[3]; >70 % of patients with early GC have no symptoms. However, patients with advanced stage of GC present pain, anemia and emaciation. Despite of high incidence of GC, most of the patients are unfortunately diagnosed at advanced stages with dismal prognosis due to the lack of distinguishing clinical indications[4]. The rate of median survival is <12 mo for patients with advanced-stage GC[5].
Surgery and chemotherapy play crucial roles in the treatment of GC[6]. However, surgery is limited by several factors, such as surgical approaches, tumor stage and extended lymph node dissection[7]. Systemic chemotherapy is the mainstay of treatment in metastatic (m) GC, with a median Overall Survival (OS) of approximately 12 mo in patients treated with conventional chemotherapy[8]. In addition, several therapeutic approaches have been established to reduce the risk of recurrence and improve long term survival, including perioperative chemotherapy, adjuvant chemotherapy and chemoradiotherapy[9].
The risk factors for GC include many non-modifiable variables and other controllable risk factors such as age, gender, race/ethnicity, Helicobacter pylori infection, smoking and diet high in nitrates and nitrites[10]. Regarding the age at the time of GC diagnosis, the incidence rate of GC increases with age and the incidence rate in the population aged >50 y is >75 %[11]. Notably, GC is divided into Early Onset Gastric Carcinoma (EOGC) which arises among of patients age ≤45 y and conventional GC which affects the patients of age >45 y[6,12]. EOGC accounts for about 2.7 %-10 % of all types of GCs. EOGC possesses different clinicopathological and molecular genetic characteristics compared with conventional GC, including diffuse lesions, poorer differentiation grade and hereditary genetic alterations[13]. Therefore, in order to improve the prognosis of GC, most of the research on molecular characteristics and targeted drug development are focused on the precise treatment of GC.
Our study found that targeted treatment that distinguishes age is helpful in precise clinical treatment of GC. We identified Differentially Expressed Genes (DEGs) and age related clinical characteristic module genes in GC from the GSE84426 dataset. We identified Regulator of G protein Signaling 4 (RGS4) and Neuronal Regeneration Related Protein (NREP) as the key genes by the Venn diagram. The expression and prognostic value of RGS4 and NREP were analyzed using the GSE84426 and The Cancer Genome Atlas (TCGA) GC dataset. Finally, a nomogram was used to establish a clinical prognostic model in the TCGA-GC dataset.
Materials and Methods
Data collection:
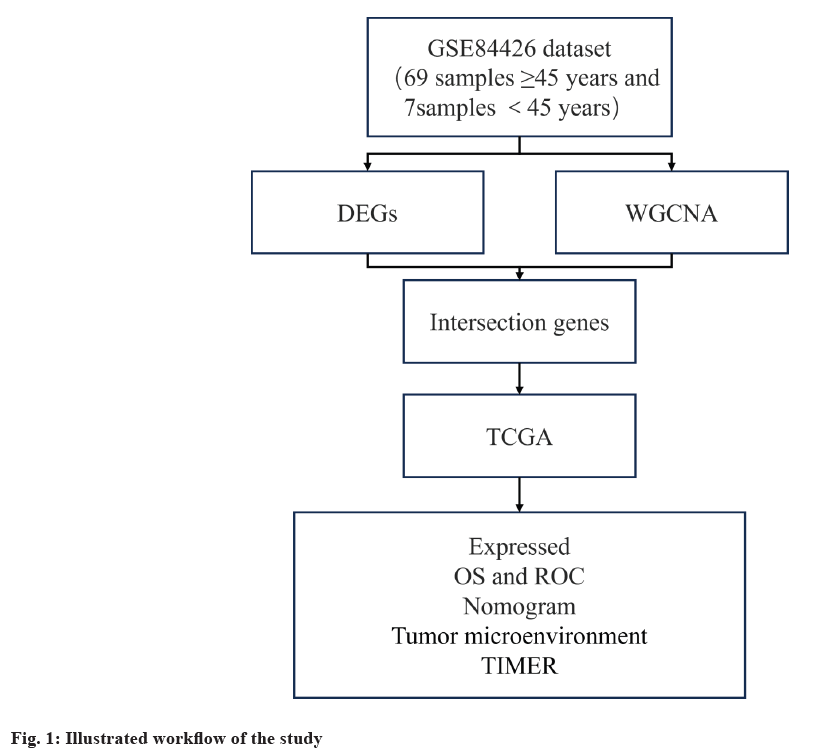
Transcriptome data and the corresponding clinical data of GC was collected using the GSE84426 dataset from the Gene Expression Omnibus (GEO) (https://ww.ncbinlm.nih.gov/geo/) and TCGA- GC (https://www.cancer.gov/ccg/research/genome-sequencing/tcga) databases. The GSE84426 dataset included 76 GC samples with 69 samples of patients aged ≥45 y and 7 samples of patients aged <45 y. (fig. 1).
Screening for DEGs:
GC Ribonucleic Acid Sequencing (RNA Seq) data was downloaded from the GSE84426 dataset. DEGs were identified using the Limma package of R version 3.6.3 (http://www.rproject.org/). The threshold for identifying significant DEGs was a False Discovery Rate (FDR) <0.01 and|log2 (fold change)|≥1.5.
Weighted Gene Co-expression Network Analysis (WGCNA):
WGCNA is a systematic approach to biology which is often applied to characterize the patterns of genetic association between different samples. In this study, we constructed a gene co-expression network for age ranging from <45 and ≥45 y in the GSE84426 dataset using the “WGCNA” R package. Finally, we evaluated the correlation of different modules with age and selected the most relevant module as the central gene derived from WGCNA. In addition, we calculated the correlation with gene expression to obtain the Gene Significance (GS) and calculated the correlation between module feature vectors and gene expression to obtain the Module Membership (MM) based on the cutoff criteria |MM|>0.8 and |GS|>0.1. A correlation heatmap was used between GS and MM to select the genes contained in modules that significantly correlate with age and to identify them as hub genes (p<0.05).
Survival and Receiver Operating Characteristic (ROC) curve:
Venn diagram was used to intersect the DEGs and hub genes in the GSE84426 dataset. Based on the risk score, patients were divided into high- and low-risk groups. A survival curve was plotted using survminer R package to analyze the survival time and status of the high- and low-risk groups in the TCGA- GC dataset. ROC curve was plotted using time-ROC R package to analyze the predictive ability of its characteristic gene prognostic model.
Nomogram:
The hub genes were determined using multiple regression analysis through independent prognostic factors to construct a nomogram. Survival- and time-related genes were used to construct a specific predictive model, which was linked to ROC curve to determine its accuracy for 1st, 2nd and 3rd y. The calibration chart and Consistency (C) index were used to correct the nomogram through the guidance method of 1000 resampling.
Tumor microenvironment construction and Tumor Immune Estimation Resource (TIMER):
We used the Estimation of STromal and Immune cells in MAlignant Tumor tissues using Expression data (ESTIMATE) package loaded in R language, version 4.0.3 to calculate stromal and immune scores, and characterize the Tumor Microenvironment (TME). The stromal and immune scores represent the infiltration levels of stromal cells and immune cells in the tumor tissue, respectively. The ESTIMATE score is the combination of the stromal and immune scores and it represents the measurement of tumor purity. Lower ESTIMATE and immune scores represent high tumor purity and low degree of infiltration of stromal cells and immune cells in the tumor tissue, respectively[14].
TIMER (cistrome.shinyapps.io/timer) is a comprehensive database that systematically analyzes six types of tumors infiltrating immune cells such as B cells, T cells (Cluster of Differentiation 4 (CD4+) and CD8+), neutrophils, macrophages and dendritic cells in different types of cancer using the TIMER algorithm.
Statistical analysis:
Student’s t-test (R function t-test) was performed to determine the significant differences between the two groups, where p<0.05 was considered to be significant; grammar of graphics plot 2 (ggplot2) package was used for plotting the graphs.
Results and Discussion
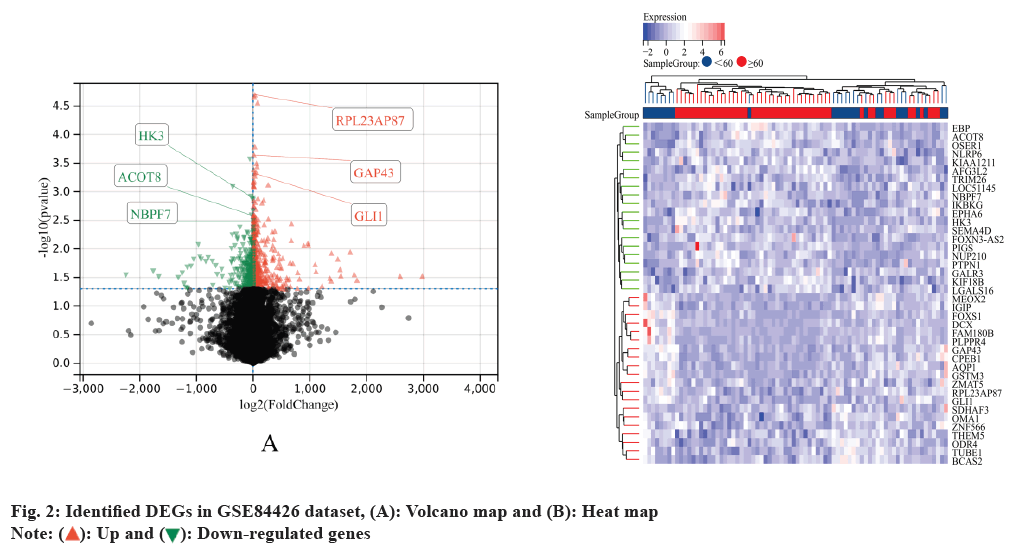
Primarily DEGs in GC were identified. Based on the set criteria, we identified 1021 DEGs, including 674 upregulated and 348 downregulated genes while we identified 2883 DEGs in GSE84426 dataset (fig. 2).
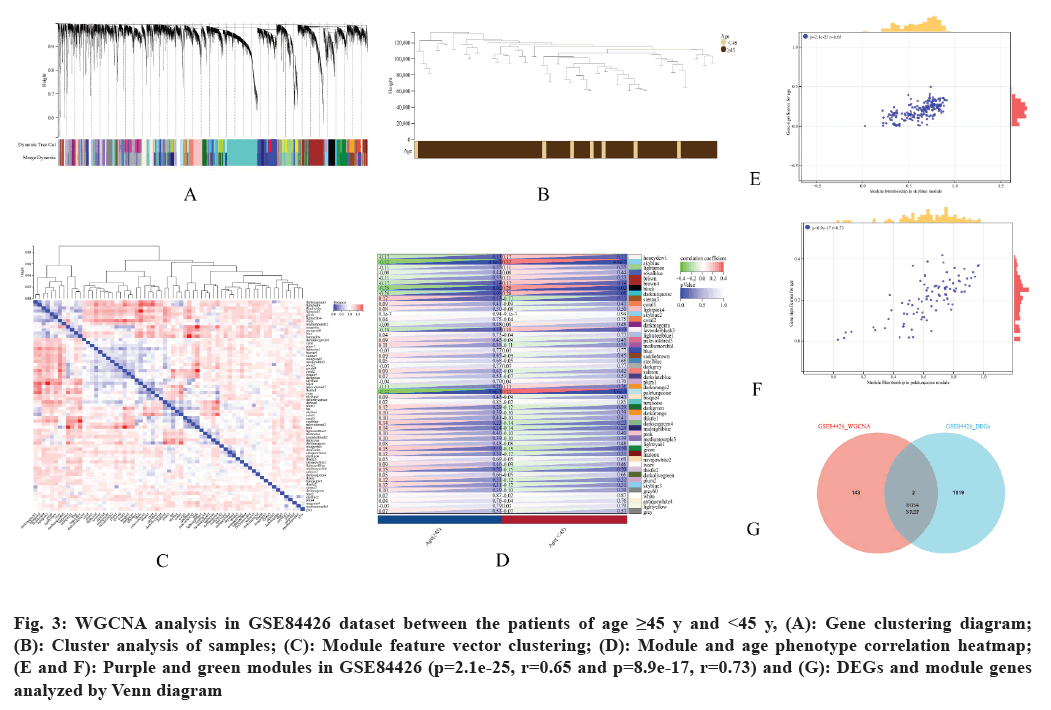
Next, WGCNA construction and identification of intersection genes was carried out. To identify the potential gene modules that were associated with GC in patients aged between the range ≥45 and <45 y, we performed WGCNA analysis of all genes from the GSE84426 dataset (fig. 3A-fig. 3C). We identified different modules (fig. 3D) after analyzing the positive correlation coefficients. Based on the correlation between GS and MM, purple and green modules in GSE84426 were screened (fig. 3E and fig. 3F). Venn diagram was used to identify DEGs and WGCNA hub genes in the GSE84426 dataset where RGS4 and NREP genes were identified as the intersection genes (fig. 3G).
Fig. 3: WGCNA analysis in GSE84426 dataset between the patients of age ≥45 y and <45 y, (A): Gene clustering diagram; (B): Cluster analysis of samples; (C): Module feature vector clustering; (D): Module and age phenotype correlation heatmap; (E and F): Purple and green modules in GSE84426 (p=2.1e-25, r=0.65 and p=8.9e-17, r=0.73) and (G): DEGs and module genes analyzed by Venn diagram
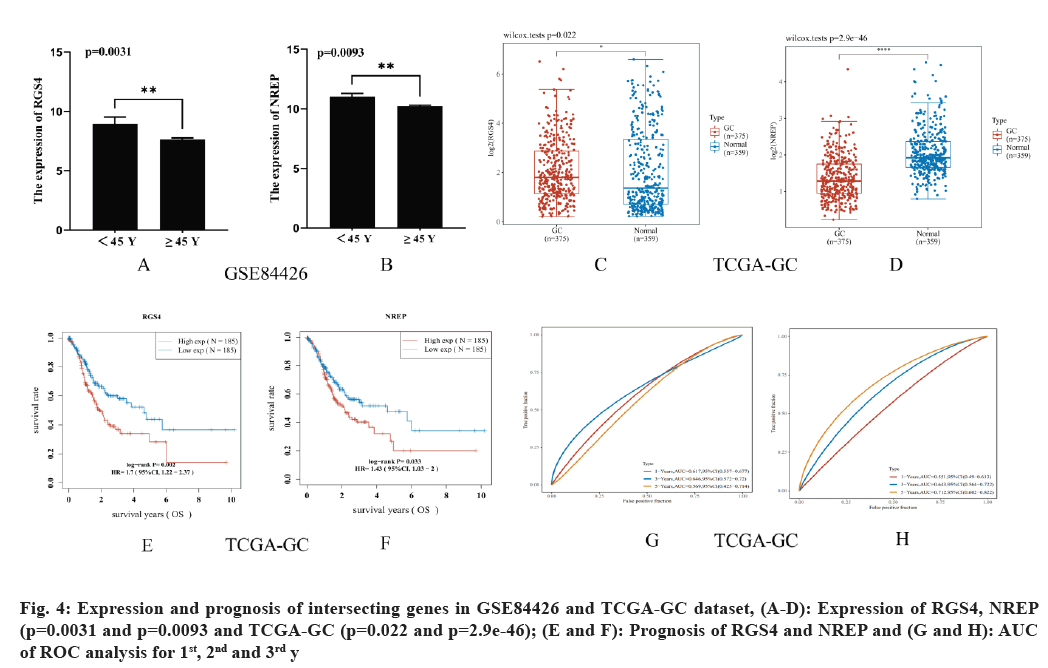
Further, the expression and prognostic value of RGS4 and NREP in GC was studied. Both RGS4 and NREP were overexpressed in GC in patients who were aged <45 y in the GSE84426 dataset with the values p=0.0031 and p=0.0093, respectively (fig. 4A and fig. 4B). Moreover, RGS4 and NREP were overexpressed in GC than in the normal tissue in the TCGA-GC dataset with p=0.022 and p=2.9e-46, respectively (fig. 4C and fig. 4D). The prognostic value of the overexpression of RGS4 and NREP was significantly better than low expression in the TCGA-GC dataset with p=0.002 and Hazard Ratio (HR)=1.7 (95 % Confidence Interval (CI): 1.22-2.37) and p=0.033, HR=1.43 (95 % CI: 1.03-2) (fig. 4E and fig. 4F). Area Under Curve (AUC) of the ROC analysis for 1st 2nd and 3rd y were 0.617 (95 % CI: 0.557-0.677), 0.646 (95 % CI: 0.572-0.72) and 0.569 (95 % CI: 0.425-0.714) respectively for RGS4 and 0.551 (95 % CI: 0.49-0.613), 0.643 (95 % CI: 0.564- 0.722) and 0.712 (95 % CI: 0.602-0.822) for NREP (fig. 4G and fig. 4H).
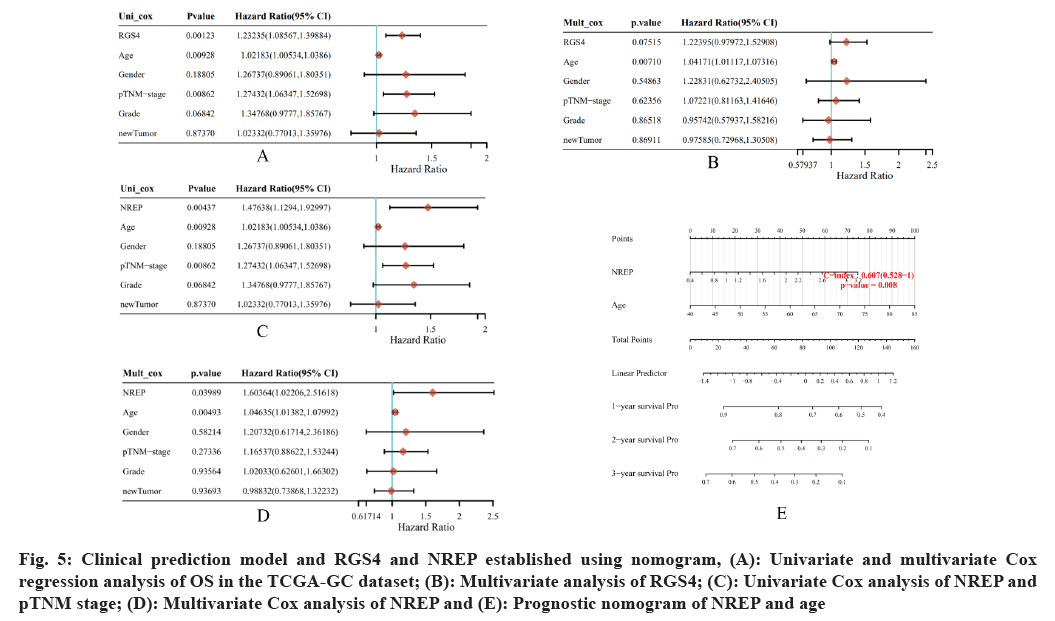
Clinical prediction of the established model using nomogram was assessed. Univariate and multivariate Cox regression analysis of OS in TCGA-GC dataset were performed with RGS4, NREP, age, gender, pathological Tumor Node Metastasis (pTNM) stage, tumor grade and new tumor as variables. Univariate analysis revealed significant differences in OS related to RGS4 (p=0.0123, HR=1.23235 (95 % CI: 1.08567-1.39884) (fig. 5A). However, the multivariate analysis revealed no significant differences in OS related to RGS4 (p=0.07515) (fig. 5B).
Fig. 5: Clinical prediction model and RGS4 and NREP established using nomogram, (A): Univariate and multivariate Cox regression analysis of OS in the TCGA-GC dataset; (B): Multivariate analysis of RGS4; (C): Univariate Cox analysis of NREP and pTNM stage; (D): Multivariate Cox analysis of NREP and (E): Prognostic nomogram of NREP and age
Significant differences in OS were observed related to NREP and pTNM stage where univariate Cox analysis of NREP depicted p=0.00437 and HR=1.47638 (95 % CI: 1.1294-1.92997); analysis of age showed p=0.00928, HR=1.02183 (95 % CI: 1.00534-1.0386); pTNM stage denoted p=0.00862 and HR=1.27432 (95 % CI: 1.06347-1.52698) (fig. 5C); where as multivariate Cox analysis of NREP depicted p=0.03989 and HR=1.6034 (95 % CI: 1.02206- 2.51618); analysis of age showed p=0.00493 and HR=1.04635 (95 % CI: 1.01382-1.07992) (fig. 5D). Accordingly, NREP and age (p<0.05) were selected as factors to establish a prognostic nomogram for the TCGA-GC dataset. The total points ranged from 0 to 180 and the C-index value was 0.607 (95 % CI: 0.528-1.0 and p=0.008) (fig. 5E).
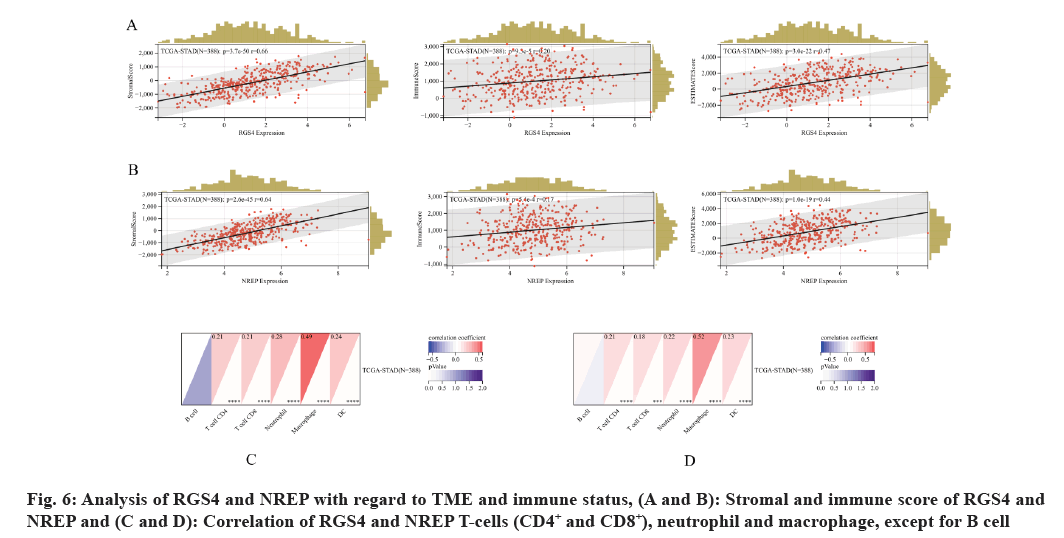
Subsequently, TME and immune status of RGS4 and NREP were analyzed where RGS4 and NREP showed significant correlation with the stromal score p=3.7e-50 and r=0.66, and p=2.6e-45 and r=0.64, respectively. Immune score denoted p=9.3e-5 and r=0.2, and p=5.4e-4 and r=0.17, respectively. Similarly, ESTIMATE score showed p=3.0e-22 and r=0.47, and p=1.0e-19 and r=0.44, respectively (fig. 6A and fig. 6B). In addition, the correlations of B and T cells (CD4+, CD8+, neutrophil and macrophages) of RGS4 and NREP were analyzed, except for B cell; all others were found to be significantly correlated with RGS4 and NREP (p<0.001) (fig. 6C and fig. 6D).
EOGC has been rising in the recent years and differs slightly in its pathology from traditional GC. The global age-standardized incidence and mortality rates for GC in 2020 were 11.1/100 000 and 7.7/100 000, respectively, according to the geographical variations[15]. There are various high-risk factors for GC, among which age has been one of them[16]. Many studies have revealed that the incidence rate of GC shows a younger age trend and its mortality rate is higher than that noted in elderly patients[17,18]. Notably, TNM results have revealed EOGC to be more advanced and to have low resectability, thereby possessing a short median OS time of around 11.7 mo[19].
Compared with conventional GC, EOGC exhibits high incidence of multifocal, poorly differentiated histology, signet ring cell carcinoma, local or distant metastasis, diffuse histological types, and high incidence in stages III/IV[20-22].
This study identified RGS4 and NREP as the intersection genes of DEGs and age related hub genes. RGS4 and NREP were overexpressed in patients with EOGC and impacted the prognosis of GC. In addition, RGS4 and NREP are closely related to stromal score, immune score, ESTIMATE score, CD4+, CD8+, neutrophil and macrophage.
RGS4 is a member of the protein signal transduction regulator family and is a regulatory molecule. Guda et al.[23] found that silencing RGS4 in the Glioma Cancer Stem (GSC) cells decreased the expression, secretion and activity of Matrix Metallopeptidase 2 (MMP2), thereby decreasing the invasive and migratory abilities of GSCs. However, Cheng et al.[24] suggested that overexpression of RGS4 in Non-Small Cell Lung Cancer (NSCLC) cells inhibits MM2/9 expression, leading to decreased invasion and migration. RGS4 was noted to be upregulated in the mesenchymal stem cells compared with the cells of diffuse-type GC, suggesting that the increased expression levels of RGS4 may lead to cell Epithelial-Mesenchymal Transition (EMT)[25]. Jia et al.[26] found that RGS4 was a prognostic indicator to predict OS, Disease-Free Survival (DFS) and drug sensitivity in GC in TCGA dataset. The study by Liu et al.[27] revealed that osteosarcoma with RGS4 overexpression can reverse the proliferation and migration of microRNA-874-3p (miR-874-3p) on U2 osteosarcoma cells.
NREP, also known as P311, has been reported to participate in multiple biological processes. The detection of tumor biomarker favored a non- invasive early entry for cancer diagnosis and disease monitoring to prevent worsening symptoms. Li et al.[28] found that the expression levels of NREP varied by race, clinical TNM stage and histologic grade in GC. Notably, the study found NREP to be associated with the prognosis of GC. Alkhateeb et al.[29] studied about prostate cancer and found NREP to be a potential biomarker in predicting prostate cancer progression; it was also found that NREP has been significantly upregulated in stages III and IV. Wei et al.[30] identified the tumor antigens and immune subtypes in gastric adenocarcinoma. Studied found that NREP was a prognosis related tumor antigen that was significantly associated with OS and Relapse Free Survival (RFS). In addition, it was found that NREP was positively correlated with macrophages, dendritic cells, CD4+ and CD8+ T cells.
This study found RGS4 and NREP to be the key genes among the DEGs and age related hub genes identified using WGCNA. Notably, both RGS4 and NREP were associated with GC prognosis. Therefore, we suggest that RGS4 and NREP can be considered as novel biomarkers in predicting GC.
Funding:
This study was supported by the scientific research project of Hunan Provincial Health Commission (Grant No: D202304017818).
Conflict of interests:
The authors declared no conflict of interests.
References
- Siegel RL, Miller KD, Wagle NS, Jemal A. Cancer statistics, 2021. CA Cancer J Clin 2021;71(1):7-33.
[Crossref] [Google Scholar] [PubMed]
- Sung H, Ferlay J, Siegel RL, Laversanne M, Soerjomataram I, Jemal A, et al. Global cancer statistics 2020: GLOBOCAN estimates of incidence and mortality worldwide for 36 cancers in 185 countries. CA Cancer J Clin 2021;71(3):209-49.
[Crossref] [Google Scholar] [PubMed]
- Siegel RL, Miller KD, Wagle NS, Jemal A. Cancer statistics, 2023. CA Cancer J Clin 2023;73(1):17-48.
[Crossref] [Google Scholar] [PubMed]
- Qiu H, Cao S, Xu R. Cancer incidence, mortality, and burden in China: A time‑trend analysis and comparison with the United States and United Kingdom based on the global epidemiological data released in 2020. Cancer Commun 2021;41(10):1037-48.
[Crossref] [Google Scholar] [PubMed]
- Zhang XY, Zhang PY. Gastric cancer: Somatic genetics as a guide to therapy. J Med Genet 2017;54(5):305-12.
[Crossref] [Google Scholar] [PubMed]
- Machlowska J, Baj J, Sitarz M, Maciejewski R, Sitarz R. Gastric cancer: Epidemiology, risk factors, classification, genomic characteristics and treatment strategies. Int J Mol Sci 2020;21(11):1-20.
[Crossref] [Google Scholar] [PubMed]
- Monrabal Lezama M, Murdoch Duncan NS, Bertona S, Schlottmann F. Current standards of lymphadenectomy in gastric cancer. Updates Surg 2023;75(7):1751-8.
[Crossref] [Google Scholar] [PubMed]
- Wagner AD, Syn NL, Moehler M, Grothe W, Yong WP, Tai BC, et al. Chemotherapy for advanced gastric cancer. Cochrane Database Syst Rev 2017;8(8):1-180.
[Crossref] [Google Scholar] [PubMed]
- Guan WL, He Y, Xu RH. Gastric cancer treatment: Recent progress and future perspectives. J Hematol Oncol 2023;16(1):1-17.
[Crossref] [Google Scholar] [PubMed]
- Stomach cancer. World Cancer Res Fund Int; 2018.
- Milne AN, Offerhaus GJ. Early-onset gastric cancer: Learning lessons from the young. World J Gastrointest Oncol 2010;2(2):59-64.
[Crossref] [Google Scholar] [PubMed]
- Milne AN, Sitarz R, Carvalho R, Carneiro F, Offerhaus GJ. Early onset gastric cancer: On the road to unraveling gastric carcinogenesis. Curr Mol Med 2007;7(1):15-28.
[Crossref] [Google Scholar] [PubMed]
- Liu H, Li Z, Zhang Q, Li Q, Zhong H, Wang Y, et al. Multi‑institutional development and validation of a nomogram to predict prognosis of early-onset gastric cancer patients. Front Immunol 2022;13:1-10.
[Crossref] [Google Scholar] [PubMed]
- Yoshihara K, Shahmoradgoli M, Martínez E, Vegesna R, Kim H, Torres-Garcia W, et al. Inferring tumour purity and stromal and immune cell admixture from expression data. Nat Commun 2013;4(1):1-11.
[Crossref] [Google Scholar] [PubMed]
- Thrift AP, El-Serag HB. Burden of gastric cancer. Clin Gastroenterol Hepatol 2020;18(3):534-42.
[Crossref] [Google Scholar] [PubMed]
- Liozon E, Dumonteil S, Parreau S, Gondran G, Bezanahary H, Palat S, et al. Risk profiling for a refractory course of giant cell arteritis: The importance of age and body weight: "Risk profiling for GC resistance in GCA". Semin Arthritis Rheum 2020;50(6):1252-61.
[Crossref] [Google Scholar] [PubMed]
- Zhang T, Chen H, Zhang Y, Yin X, Man J, Yang X, et al. Global changing trends in incidence and mortality of gastric cancer by age and sex, 1990-2019: Findings from global burden of disease study. J Cancer 2021;12(22):6695-705.
[Crossref] [Google Scholar] [PubMed]
- Guan WL, Yuan LP, Yan XL, Yang DJ, Qiu MZ. More attention should be paid to adult gastric cancer patients younger than 35 y old: Extremely poor prognosis was found. J Cancer 2019;10(2):472-8.
[Crossref] [Google Scholar] [PubMed]
- Rona KA, Schwameis K, Zehetner J, Samakar K, Green K, Samaan J, et al. Gastric cancer in the young: An advanced disease with poor prognostic features. J Surg Oncol 2017;115(4):371-5.
[Crossref] [Google Scholar] [PubMed]
- Fewings E, Larionov A, Redman J, Goldgraben MA, Scarth J, Richardson S, et al. Germline pathogenic variants in PALB2 and other cancer-predisposing genes in families with hereditary diffuse gastric cancer without CDH1 mutation: A whole-exome sequencing study. Lancet Gastroenterol Hepatol 2018;3(7):489-98.
[Crossref] [Google Scholar] [PubMed]
- Cho SY, Park JW, Liu Y, Park YS, Kim JH, Yang H, et al. Sporadic early-onset diffuse gastric cancers have high frequency of somatic CDH1 alterations, but low frequency of somatic RHOA mutations compared with late-onset cancers. Gastroenterology 2017;153(2):536-49.
[Crossref] [Google Scholar] [PubMed]
- Mun DG, Bhin J, Kim S, Kim H, Jung JH, Jung Y, et al. Proteogenomic characterization of human early-onset gastric cancer. Cancer Cell 2019;35(1):111-24.
[Crossref] [Google Scholar] [PubMed]
- Guda MR, Velpula KK, Asuthkar S, Cain CP, Tsung AJ. Targeting RGS4 ablates glioblastoma proliferation. Int J Mol Sci 2020;21(9):1-13.
[Crossref] [Google Scholar] [PubMed]
- Cheng C, Yue W, Li L, Li S, Gao C, Si L, et al. Regulator of G-protein signaling 4: A novel tumor suppressor with prognostic significance in non-small cell lung cancer. Biochem Biophys Res Commun 2016;469(3):384-91.
[Crossref] [Google Scholar] [PubMed]
- Tanabe S, Aoyagi K, Yokozaki H, Sasaki H. Regulated genes in mesenchymal stem cells and gastric cancer. World J Stem Cells 2015;7(1):208-22.
[Crossref] [Google Scholar] [PubMed]
- Jia X, Chen B, Li Z, Huang S, Chen S, Zhou R, et al. Identification of a four-gene-based SERM signature for prognostic and drug sensitivity prediction in gastric cancer. Front Oncol 2022;11:1-7.
[Crossref] [Google Scholar] [PubMed]
- Liu WG, Zhuo L, Lu Y, Wang L, Ji YX, Guo Q. miR-874-3p inhibits cell migration through targeting RGS4 in osteosarcoma. J Gene Med 2020;22(9):1-13.
[Crossref] [Google Scholar] [PubMed]
- Li Q, Fu L, Wu D, Wang J. NREP is a diagnostic and prognostic biomarker, and promotes gastric cancer cell proliferation and angiogenesis. Biochem Genet 2023;61(2):669-86.
[Crossref] [Google Scholar] [PubMed]
- Alkhateeb A, Rezaeian I, Singireddy S, Cavallo-Medved D, Porter LA, Rueda L. Transcriptomics signature from next-generation sequencing data reveals new transcriptomic biomarkers related to prostate cancer. Cancer Inform 2019;18:1-11.
[Crossref] [Google Scholar] [PubMed]
- Wei S, Sun Q, Chen J, Li X, Hu Z. Bioinformatics analyses for the identification of tumor antigens and immune subtypes of gastric adenocarcinoma. Front Genet 2022;13:1-10.
[Crossref] [Google Scholar] [PubMed]
 Down-regulated genes