- Corresponding Author:
- U. M. Krishnan
Centre for Nanotechnology and Advanced Biomaterials, SASTRA University, Thanjavur-613 401, India
E-mail: umakrishnan@sastra.edu
| Date of Submission | 15 March 2014 |
| Date of Revision | 06 September 2014 |
| Date of Acceptance | 12 September 2014 |
| Indian J Pharm Sci 2014;76(6):495-503 |
Abstract
Rasasindura is a mercury-based nanopowder synthesized using natural products through mechanothermal processing. It has been used in the Ayurvedic system of medicine since time immemorial for various therapeutic purposes such as rejuvenation, treatment of syphilis and in genital disorders. Rasasindura is said to be composed of mercury, sulphur and organic moieties derived from the decoction of plant extracts used during its synthesis. There is little scientific understanding of the preparation process so far. Though metallic mercury is incorporated deliberately for therapeutic purposes, it certainly raises toxicity concerns. The lack of gold standards in manufacturing of such drugs leads to a variation in the chemical composition of the final product. The objective of the present study was to assess the physicochemical properties of Rasasindura samples of different batches purchased from different manufacturers and assess the extent of deviation and gauge its impact on human health. Modern characterization techniques were employed to analyze particle size and morphology, surface area, zeta potential, elemental composition, crystallinity, thermal stability and degradation. Average particle size of the samples observed through scanning electron microscope ranged from 5-100 nm. Mercury content was found to be between 84 and 89% from elemental analysis. Despite batch-to-batch and manufacturer-to-manufacturer variations in the physicochemical properties, all the samples contained mercury in the form of HgS. These differences in the physicochemical properties may ultimately impact its biological outcome.
Keywords
Mercury, sulphur, chemical composition, elemental, field emission, heavy metals
The synthesis of Rasasindura (RS) involves meticulous process engineering. It involves several unit operations and processes on a wide variety of materials, ranging from metals to plant ingredients, to transform into a product with therapeutic values. These processes are expected to exert subtle control over the morphology, fineness, surface area, chemical reactivity, solubility as well as biological interactions that decide the therapeutic efficacy and safety of this nanopowder formulation [1]. The synthesis of RS involves the following steps (i) Treatment of mercury; (ii) treatment of sulphur; (iii) mechanochemical processing of purified mercury and sulphur to obtain a black lusterless powder; (iv) addition of herbal extracts and (v) thermal processing to obtain the final product. Various treatment processes prescribed in classical texts are hypothesized to detoxify the metal and convert it into a biocompatible form. Though metallic mercury is incorporated deliberately for therapeutic purposes, it certainly raises toxicity concerns [2]. Several groups have attempted to characterize such nanopowders in order to ascertain their safety. The elemental composition of Rasa parpati, another traditional mercury-based powder, was evaluated using inductively coupled plasma-optical emission spectrometry (ICP-OES) and the results indicated a mercury content greater than 10 g/kg in the samples [3]. Similarly, yet another metallic preparation, Siddha Makardhwaja was analysed using instrumental neutron activation analysis (INAA) and was reported to contain mercury (85.3%) and sulphur (14.1%) [4]. Saper et al. had reported mercury concentration to be 20.23 mg/g in the herbal medicine products manufactured in South Asia and sold in stores in Boston [5]. Similarly, 1/5th of 193 Ayurvedic medicines purchased via the internet were found to contain mercury, lead or arsenic [6]. These findings have been countered by the traditional medicine practitioners. It is believed that these metallic ingredients are not contaminants and are deliberately added key constituents in these preparations. In spite of the metallic content, these powders have been employed as therapeutic formulations, as it is believed that these metals do not exist in their elemental form in the preparations, but rather in a complex biocompatible form. However, no concrete scientific evidence has been presented to justify these claims. Although the debate on the origin and the role of metallic constituents in the traditional medicine formulations rages on, another crucial aspect with respect to traditional herbo-metallic preparations has come to the fore in the recent years. Wide variations in the mercury content were observed in the commercial samples, which could be attributed to the differences in preparation procedures adopted by the manufacturers. The lack of gold standard for quality control and multiple procedures available for preparation of these formulations further contribute to the variations in composition and possibly both therapeutic and toxic effects of these preparations. The purpose of this study was to carry out a comprehensive physicochemical characterization of RS preparations available in the Indian market, using modern characterization techniques.
Materials and Methods
Samples of different batches of RS were procured randomly from three different manufacturers. To maintain discretion, the manufacturers were designated as X, Y and Z. The container labels of all three manufacturers mentioned the presence of mercury, but not its concentration. The drug name and dosage details are listed in Table 1.
| Name of the drug | Sample ID | Dosage (mg) |
|---|---|---|
| EkagunaSindura | X-B1 | 100-200 |
| Rasa Chenduram | X-B2 | 50-100 |
| Rasa Chendooram | Y-B1 | 100-200 |
| Rasa Chendooram | Y-B2 | 100-200 |
| Rasa Chendooram | Y-B3 | 100-200 |
| Rasa Sindur | Z-B1 | Not mentioned |
| Rasa Sindur | Z-B2 | Not mentioned |
Details of commercially available samples of Rasasindura where X-B1 and X-B2 are samples obtained from X-manufacturer with Batch 1 and Batch 2 preparation. Y-B1, Y-B2 and Y-B3 obtained from Y-manufacturer with Batch 1, Batch 2 and Batch 3 preparation. Z-B1 and Z-B2 obtained from Z-manufacturer with Batch 1 and Batch 2 preparation
Table 1: Name of the drugs and dosage indications
Particle size, zeta potential and surface area
The average particle size and zeta potential of the aqueous dispersion of the samples were determined using a Zetasizer (Zetasizernano, Malvern Instruments Limited, USA). The particle size distribution was carried out using laser diffraction technique (Bluewave Microtrac, Nikkiso, Japan). Surface area was determined based on the adsorption of nitrogen on particle surfaces using surface area analyzer (ASAP 2020, Micromeritics, USA). The powder samples were also passed through different sieves ranging from ASTM 20 – ASTM 325 and the samples retained on each sieve were weighed and the percentage retained was calculated.
Electron microscopy
The surface morphology of the commercial samples of RS was qualitatively assessed using a cold field emission scanning electron microscope (JSM 6701F, Jeol, Japan). The ultrafine structure of RS was analysed using a field emission transmission electron microscope (JEM 2100F, Jeol, Japan). The selected area electron diffraction (SAED) patterns were recorded by dispersing the sample over a carbon coated copper grid.
Elemental analysis
The commercial samples of RS were mixed with boric acid and pelletized using a 25-tonne hydraulic press to obtain thin discs of 34 mm diameter. The elemental composition of the samples was determined using an X-ray fluorescence spectrometer (S8 Tiger, Bruker AXS, Germany) using a 4 kW Rhodium anode X-ray tube. Energy dispersive X-Ray spectroscopy (EDAX, Oxford, UK) was also used to identify the elements.
Crystallinity
The crystal phases of all the samples were analysed using an X-ray diffractometer (D8 Focus, Bruker AXS, Germany). The XRD patterns were recorded at ‘2θ’ ranging between 10° and 60° at a scan rate of 0.01°/s.
Thermal analysis
The melting point, thermal stability and degradation temperature of the samples were analyzed using a Thermogravimetry-Differential Thermal Analyzer (SDT Q600, TA Instruments, USA).
Results
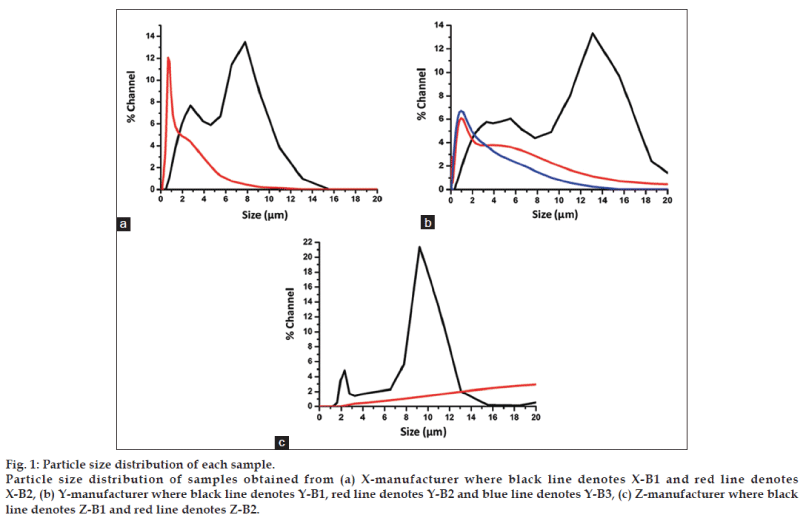
All samples from the manufacturers ‘X’ and ‘Y’ exhibited orange red hue characteristic of the vermillion or red cinnabar colour. However both samples from manufacturer Z showed a dark pink colour. The difference in colour between the samples may be attributed to the different particle sizes of the samples [7]. The samples from manufacturer X and Y were very fine powders whereas those from manufacturer Z were coarse. It was observed that there was a huge variation in the size distribution between the samples (fig. 1). A considerable percentage of the population in all the samples existed in the micron range. The sieve analysis of the samples shown in the Table 2 also suggested the wide size ranges of the particles. Interestingly, the samples from manufacturers Z showed particle sizes between 2 to 900 μ, which were much higher than those observed with the samples from manufacturers X and Y. This agrees with the difference in colour observed for the samples from manufacturers X, Y and Z. The agglomeration of the particles could be one of the factors contributing to the wide variations in the particle size distributions. Agglomeration is the result of attractive forces between the particles. The shape and the size of the particles as well as their surface charge play key roles in determining their agglomeration. Generally, irregular shaped particles tend to agglomerate to a larger extent as reported for alumina powders [8]. Since calcination and milling processes generally lead to formation of irregular shapes and sizes, it is probable that the solid-state processes leading to the synthesis of RS might have resulted in irregular particle shapes and sizes.
| Sample ID | Retained on ASTM 20 (%) | Retained on ASTM 45 (%) | Retained on ASTM 60 (%) | Retained on ASTM 80 (%) | Retained on ASTM 120 (%) | Retained on ASTM 325 (%) | Less than 0.045 mm (%) |
|---|---|---|---|---|---|---|---|
| X–B1 | 0.00 | 0.00 | 1.50 | 5.13 | 7.40 | 22.60 | 63.37 |
| X–B2 | 0.00 | 0.00 | 3.30 | 4.40 | 8.00 | 25.30 | 59.00 |
| Y–B1 | 0.00 | 0.00 | 1.13 | 7.10 | 11.03 | 21.60 | 59.14 |
| Y–B2 | 0.00 | 0.00 | 1.80 | 10.80 | 13.70 | 23.00 | 50.70 |
| Y–B3 | 0.00 | 0.00 | 1.53 | 11.40 | 15.90 | 24.70 | 46.47 |
| Z–B1 | 4.00 | 13.80 | 17.10 | 18.80 | 21.60 | 23.40 | 1.30 |
| Z–B2 | 1.10 | 11.23 | 16.80 | 19.40 | 25.00 | 25.40 | 1.07 |
ASTM: American society for testing and materials
Table 2: Sieve analysis of rs samples
Figure 1: Particle size distribution of each sample.
Particle size distribution of samples obtained from (a) X-manufacturer where black line denotes X-B1 and red line denotes
X-B2, (b) Y-manufacturer where black line denotes Y-B1, red line denotes Y-B2 and blue line denotes Y-B3, (c) Z-manufacturer where black
line denotes Z-B1 and red line denotes Z-B2.
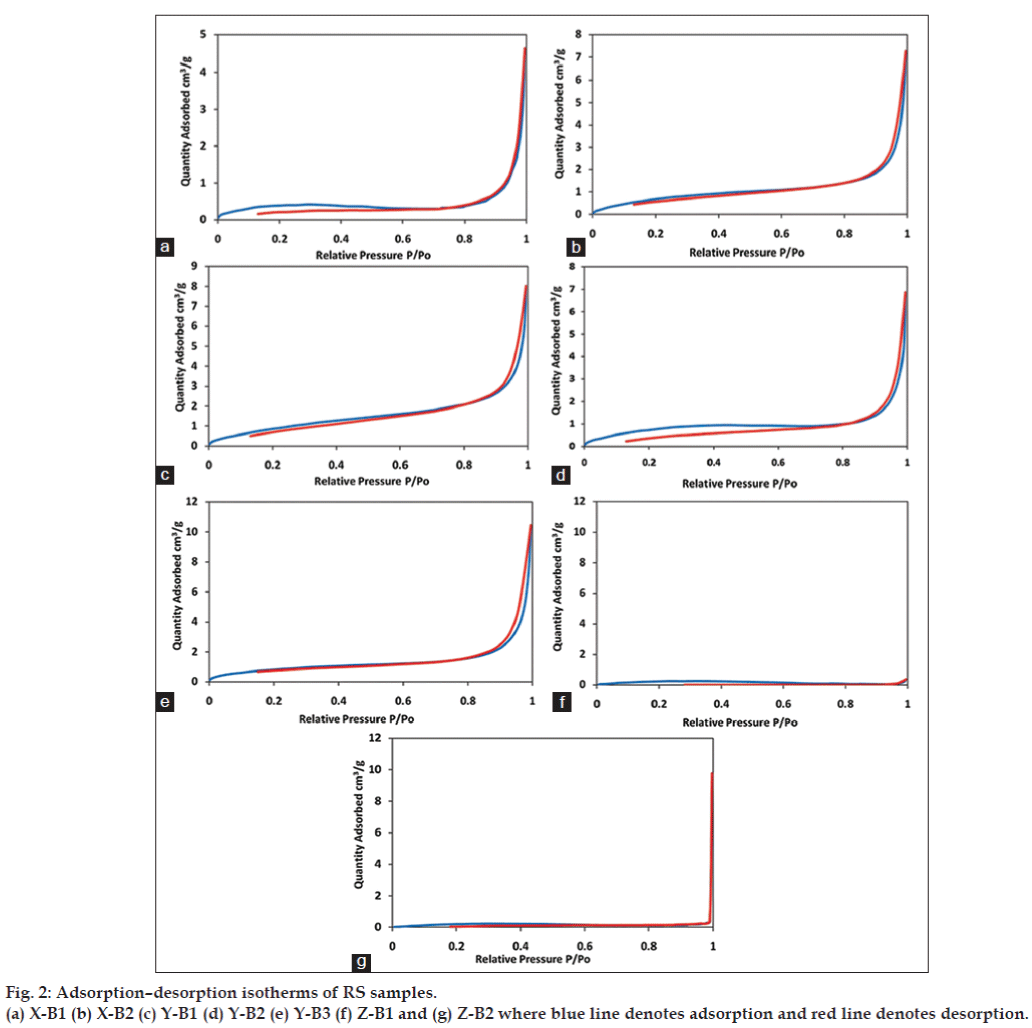
All samples were insoluble in water. The variation in colour and particle size indicates difference in the preparation procedures among the Ayurvedic manufacturers of RS. Increase in particulate size will ultimately affect pharmacokinetics of the drug. Smaller particle size will enable drugs to circumvent barriers that are impenetrable to larger particles [9]. Reduction in size will increase the surface to volume ratio, which in turn can enhance the interactions with biological components [10]. Another factor that can influence particle stability in solvent is its zeta potential. Table 3 shows the average particle size and zeta potential of the RS samples. Average particle size of the samples ranged between 400 and 535 nm. The zeta potential ranged between - 23 and - 37 mV and there was no significant batch-tobatch and manufacturer-to-manufacturer variation in zeta potential. The zeta potential values indicate an incipient to moderate colloidal stability for these particles according to the DLVO theory and therefore formation of agglomerates is possible. The mechanism of cellular uptake of RS has not yet been established. Zeta potential plays an important role in particle uptake by cells, especially in intestinal mucosa whose extracellular surface is negatively charged due to presence of glycocalyx, which is a polymeric material excreted by epithelial cells [11]. The negative zeta potential indicates that the cell uptake of RS might be less. The surface charge also determines the electrostatic interactions, which in turn determines the mechanism and magnitude of protein adsorption [12]. Intestinal uptake of RS may be low due to the presence of anionic groups on its surface, which affects protein adsorption in negatively charged extracellular surface. Fig. 2 shows the nitrogen adsorption-desorption patterns for the different samples of RS. The adsorption profiles show large deviation from the Langmuir adsorption isotherms indicating occurrence of a multilayer adsorption in the samples. The adsorption pattern also exhibits characteristics of weak adsorbateadsorbent interactions. The absence of a knee in the absorption profile indicates absence of micropores in the sample. The absence of significant hysteresis also suggests absence of pores in the sample. It is observed that all samples showed an inflection at P/ Po>0.9. This is a trend associated with macroporous samples with large voids. The incomplete adsorptiondesorption profiles obtained for Z-B1 and Z-B2 suggests the coarse nature of this sample, thus implying the inapplicability of BET analysis for these samples.
| Sample ID | Average particle size (nm) | Zeta potential (mV) |
|---|---|---|
| X-B1 | 514.2 | −23.5 ± 5.43 |
| X-B2 | 434 | −26.2 ± 7.49 |
| Y-B1 | 532.6 | −34.4 ± 6.38 |
| Y-B2 | 402.6 | −36.6 ± 7.02 |
| Y-B3 | 435.6 | −26.9 ± 5.92 |
| Z-B1 | 519 | −25.6 ± 7.90 |
| Z-B2 | 446.1 | −25.9 ± 8.00 |
Values of zeta potential are expressed as mean±standard deviation
Table 3: Average particle size and zeta potential of rs samples
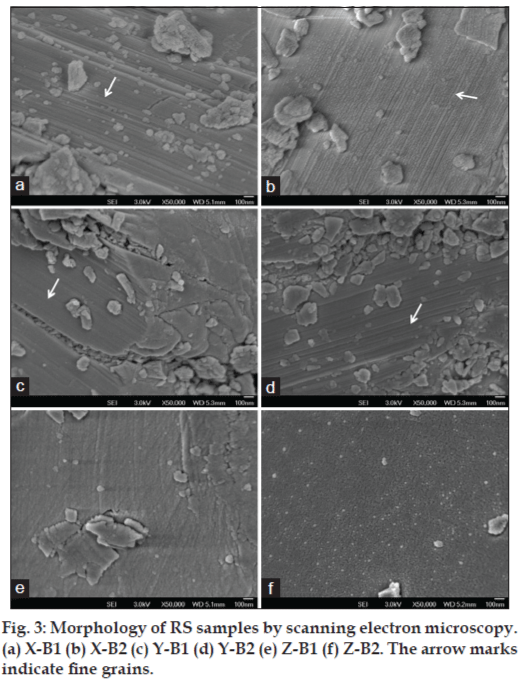
Fig. 3 shows the scanning electron micrographs of the different samples of RS. All the samples exhibited inhomogeneous surface morphology as evident from the scanning electron micrographs. X-B1 (fig. 3a) revealed more spherical particles on strip-like surface, whereas X-B2 (fig. 3b) contained aligned fine grains on lamellar surface. The particle size ranged from 5-100 nm in X-B1 and X-B2 samples. The samples from manufacturer Y were irregular in shape and size with agglomeration (fig. 3c and d) (Y-B3 not shown). Z-B1 and Z-B2 samples showed particles with more-defined morphology (fig. 3e and f). Such wide variations clearly demonstrate difference in synthesis of these drugs by various manufacturers especially during the mechano-chemical processing, which plays an important role in modifying the physicochemical characteristics.
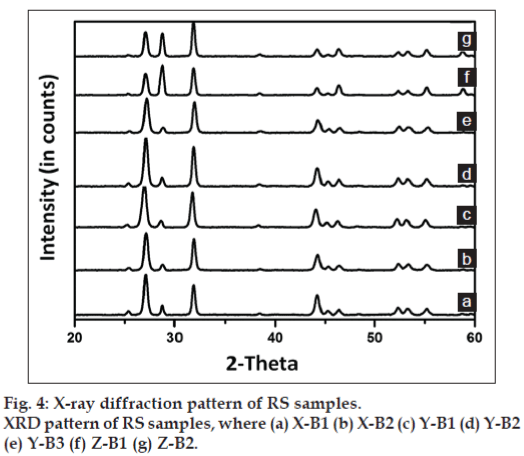
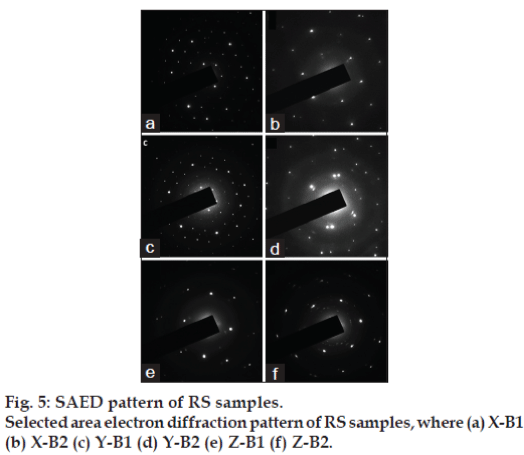
The X-ray diffractograms of the samples are shown in fig. 4, in which peaks corresponding to mercuric sulphide [01-080-2192, ICDD], with a hexagonal system and primitive lattice structure are observed. The minimum crystallite size, calculated from Scherrer formula, ranged between 16.7 and 22.7 nm with minimum variation between batches (Table 4). The mass percentage of Hg in pure mercuric sulphide (HgS) can be determined from stoichiometry as 86.2%. Interestingly, this is in accordance with the mass percentage of mercury (84-89%) determined from X-ray fluorescence spectroscopy, which indicates that the mercury in RS is in the form of HgS. Fig. 5 shows the selected area electron diffraction (SAED) pattern of RS samples. The SAED pattern indicates the hexagonal lattice characteristic of mercuric sulphide and the d values ranged from 0.108-1.226 nm. This correlates with the x-ray diffraction studies, which also indicated a primitive hexagonal lattice arrangement in the samples.
| Name | FWHM | 2θ | Minimum crystallite size (nm) |
|---|---|---|---|
| X-B1 | 0.397 | 27.11 | 20.35 |
| X-B2 | 0.439 | 27.15 | 18.40 |
| Y-B1 | 0.482 | 26.98 | 16.74 |
| Y-B2 | 0.430 | 27.13 | 18.80 |
| Y-B3 | 0.465 | 27.20 | 17.37 |
| Z-B1 | 0.426 | 28.79 | 19.03 |
| Z-B2 | 0.360 | 31.80 | 22.70 |
FWHM: Full width at half maximum; 2θ values are expressed in degrees
Table 4: Grain size of each sample of rs
Table 5 shows the elemental composition of the RS samples. Elements such as Hg, S, Mn and Fe were found in all the samples. Mercury and sulphur were found to be the major constituents of all the samples, with concentration ranging from 84 to 89% and 9 to 11% respectively, which is further confirmed from the EDAX spectra (Table 6). Mercury level was very high with reference to WHO standards. However, mercury may not be present in free form but in its sulphide form along with other macro- and micronutrients [13]. It is yet to be demonstrated experimentally whether mercury dissociates from the sulphide after it is ingested in the body.
| Element | Mass (%) | ||||||
|---|---|---|---|---|---|---|---|
| X-B1 | X-B2 | Y-B1 | Y-B2 | Y-B3 | Z-B1 | Z-B2 | |
| Mercury | 88.5 ± 1.42 | 84.7 ± 2.24 | 84.8 ± 1.36 | 85.4 ± 1.13 | 85.5 ± 0.90 | 89.2 ± 0.71 | 88.7 ± 0.70 |
| Sulphur | 10.05 ± 1.52 | 10.69 ± 2.24 | 11.20 ± 1.57 | 10.6 ± 1.14 | 11.05 ± 0.94 | 9.61 ± 0.75 | 10.01 ± 0.75 |
| Manganese | 0.42 ± 0.08 | 0.41 ± 0.04 | 0.39 ± 0.04 | 0.38 ± 0.02 | 0.38 ± 0.02 | 0.37 ± 0.01 | 0.37 ± 0.02 |
| Calcium | 0.01 ± 0.01 | 0.05 ± 0.01 | 0.04 ± 0.005 | - | 0.01 ± 0.01 | - | 0.01 ± 0.01 |
| Iron | 0.01 ± 0.01 | 0.06 ± 0.01 | 0.02 ± 0.00 | 0.02 ± 0.02 | 0.01 ± 0.005 | 0.02 ± 0.01 | 0.01 ± 0.01 |
| Silica | 0.02 ± 0.02 | 0.04 ± 0.04 | 0.01 ± 0.00 | 0.006 ± 0.01 | 0.02 ± 0.02 | 0.01 ± 0.01 | 0.02 ± 0.02 |
| Potassium | 0.006 ± 0.01 | - | - | 0.05 ± 0.05 | 0.08 ± 0.07 | - | - |
Values are expressed as mean ± standard deviation
Table 5: Elemental composition of rs samples determined using x-ray fluorescence spectroscopy
| Element | Mass (%) | ||||||
|---|---|---|---|---|---|---|---|
| X-B1 | X-B2 | Y-B1 | Y-B2 | Y-B3 | Z-B1 | Z-B2 | |
| Mercury | 65.04 ± 6.37 | 55.57 ± 2.07 | 67.29 ± 1.31 | 56.28 ± 0.59 | 57.83 ± 5.64 | 72.86 ± 0.15 | 73.92 ± 0.48 |
| Sulphur | 14.70 ± 0.23 | 10.76 ± 0.93 | 15.63 ± 0.62 | 10.85 ± 0.54 | 12.66 ± 1.18 | 15.38 ± 0.49 | 14.66 ± 0.33 |
| Oxygen | 20.25 ± 6.14 | 33.67 ± 1.14 | 13.63 ± 0.50 | 32.86 ± 0.04 | 29.50 ± 6.82 | 11.76 ± 0.33 | 11.42 ± 0.82 |
| Arsenic | a | a | 3.45 ± 0.18 | a | a | a | a |
Values are expressed as mean±standard deviation; a – denotes element not present in the sample
Table 6: Elemental analysis of rs samples by energy dispersive x-ray analysis
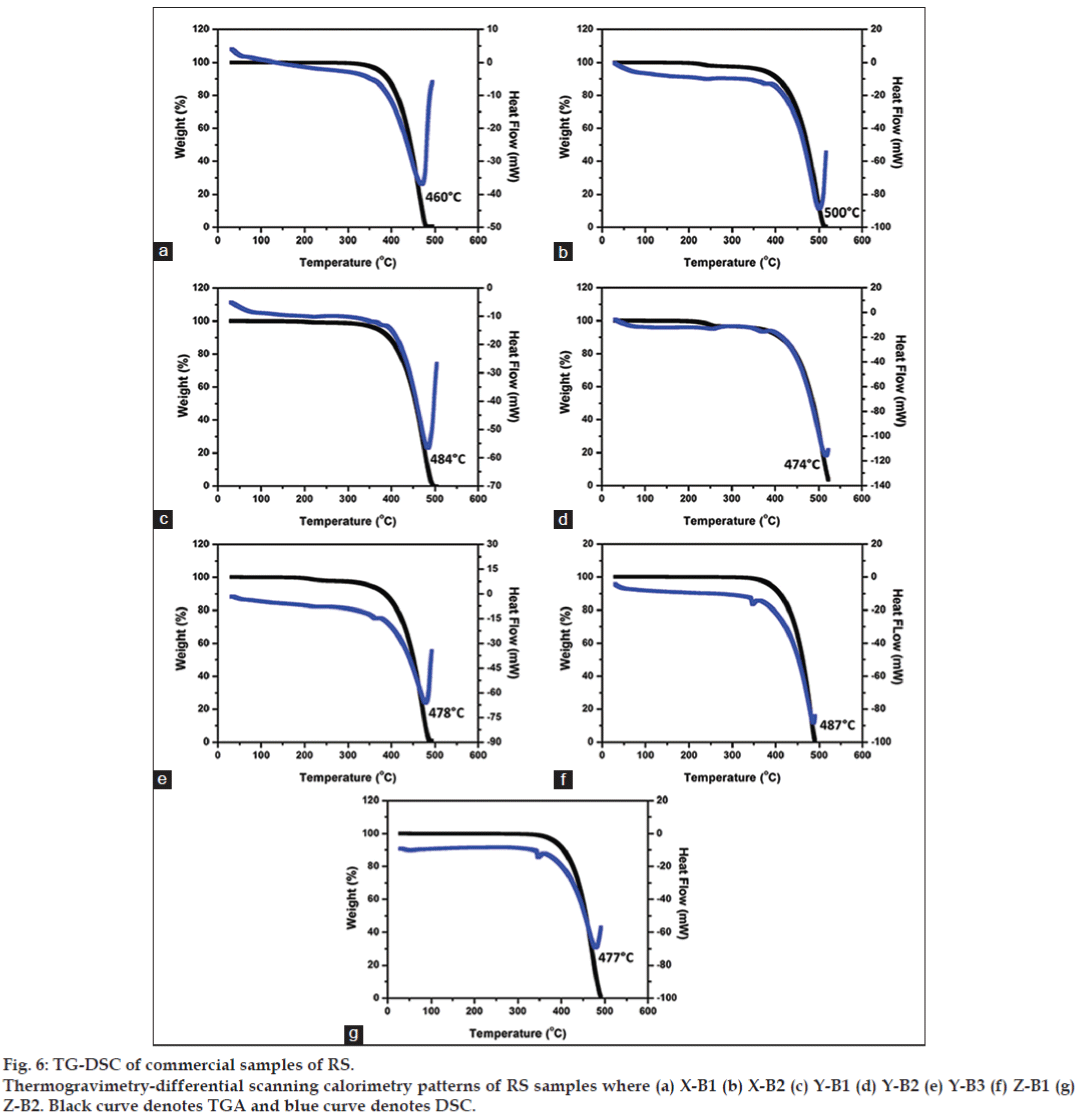
Humans require macronutrients (calcium, magnesium,) and micronutrients (iron and manganese) to carry out a range of physiological functions [14]. Calcium is needed for blood cell function, bone, muscle, heart and digestive system functions, while magnesium is required for processing of ATP [15]. Iron is utilized by haemoglobin [16]. Hence the presence of these elements even in small quantities might serve to impart therapeutic value to the preparation. These elements are most likely introduced in RS during the elaborate treatment processes designed to purify mercury and sulphur. Interestingly, there was no considerable variation in the elemental composition between the various commercial samples investigated implying that the composition chiefly is dependent on the ingredients introduced during the purification stages and not on the mechanochemical grinding processes during the preparation. The thermal analyses of all the samples are shown in fig. 6. The TG-DSC results indicate degradation point of 460° for X-B1 and 500° for X-B2. The degradation point of Y-batch samples ranged from 474-484°. The degradation point of Z-batch samples ranged from 477-487°.
Discussion
The need for characterization of Rasasindura samples arises due to recent reports on toxicity of herbo-metallic preparations containing more than the permissible limit of heavy metals. Although use of metals in Ayurveda has been in practice since ages, the lack of pharmacovigilance raises questions on the scientific use of heavy metals as a form of medication. The physicochemical characterization of RS samples of different batches from different manufacturers has been investigated. Noticeable differences in surface morphology, surface area and particle size indicated probable variations in manufacturing procedure. These results indicate necessity for standardization of preparation procedures. Elemental analyses revealed high mercury content (84-89%) present as HgS, confirmed later from the X-ray diffractogram. Although elemental concentration is high and more than the permissible limits, it is also evident that mercury is not in the free form, which may be attributed to the stringent purification steps followed to detoxify metals and convert them into biocompatible form. The drug may not get absorbed through the intestinal tract due to its negative zeta potential and also due to its insolubility. This may be the reason the drug is said to be non-toxic. Since absorption through gastrointestinal tract may be minimal or nil, questions arise over its therapeutic potential. On the contrary, these drugs are administered with honey as a vehicle, which may aid in absorption of the drug through the intestinal tract after digestion. Honey has been reported to provide stability and act as capping agent for delivery of platinum nanoparticles [17]. The human dose of RS is 125 mg for a 60 kg adult, which can be considered to be minimal. All these factors necessitate the need for its preclinical toxicity as well as therapeutic efficacy studies in laboratory animals. Characterization of commercial samples has only lead to a better understanding of the physicochemical properties of RS. But a vast lacunae still exists on the therapeutic implications these properties may impart as well as their toxicological manifestations which can only be answered by in vitro and in vivo studies to confirm the safety of this traditional form of medication. Even though such drugs have been in clinical practice in the Indian subcontinent for thousands of years, the lack of pharmacovigilance has dent a severe blow on the assessment of patient safety.
Acknowledgements
The authors gratefully acknowledge the funding provided by the Drugs and Pharmaceutical Research Programme (VI-D and P/267/08/09/TDT), Department of Science and Technology (DST), India and SASTRA University for this work. We also acknowledge the funding from Nano Mission Council (SR/S5/NM-07/2006 and SR/NM/PG- 16/2007), DST, India for SEM and XRD.
References
- Reddy KR. Text Book of Rasa Sastra. Varanasi: Chaukhambha Sanskrit Bhawan; 2007.
- Dargan PI. Heavy metal poisoning from Ayurvedic traditional medicines: An emerging problem? Int J Environ Health 2008;2:463-74.
- Giacomino A, Abollino O, Malandrino M, Karthik M, Murugesan V. Determination and assessment of the contents of essential and potentially toxic elements in Ayurvedic medicine formulations by inductively coupled plasma-optical emission spectrometry. Microchem 2011;99:2-16.
- Kumar A, Nair AG, Reddy AV, Garg AN. Availability of essential elements in bhasmas: Analysis of Ayurvedic metallic preparations by INAA. J RadioanalNuclChem 2006;270:173-80.
- Saper RB, Kales SN, Paquin J, Burns MJ, Eisenberg DM, Davis RB, et al. Heavy Metal Content of Ayurvedic Herbal Medicine Products. JAMA 2004;292:2868-73.
- Saper RB, Phillips RS, Sehgal A, Khouri N, Davis RB, Paquin J, et al. Lead, Mercury and Arsenic in US- and Indian-manufactured Ayurvedic medicines sold via the Internet. JAMA 2008;300:915-23.
- Gessner A, Lieske A, Paulke B, Müller R. Determination of size and concentration of gold nanoparticles from UV/Vis spectra. Anal Chem 2007;79:4215-21.
- Kou J, Bourell DL. Structural evolution during calcination of sol-gel synthesized alumina and alumina-8 vol% zirconia composite. J Mate Sci 1997;32:2687-92.
- Maynard AD. Nanotoxicology: Laying a firm foundation for sustainable nanotechnologies. In: Monteiro-Riviere NA, Tran CL, editors. Nanotoxicology: Characterization, Dosing and Health effects. New York: Informa Health Care; 2007.
- Zuin S, Pojana G, Marcomini A. Effect-oriented physicochemical characterization of nanomaterials. In: Monteiro-Riviere NA, Tran CL, editors. Nanotoxicology: Characterization, Dosing and Health effects. New York: Informa Health Care; 2007.
- Gropper SS, Smith JL, Groff JL. Advanced nutrition and human metabolism. 5th ed. Belmont: Wadsworth; 2009.
- Yoon JY, Kim JH, Kim WS. The relationship of interaction forces in the protein adsorption onto polymeric microspheres. Colloids Surf A PhysicochemEng Asp 1999;153:413-9.
- Swamy GY, Ravikumar K. Characterization of Indian Ayurvedic herbal medicines for their metal concentrations using WD-XRF spectrometry. X-Ray Spectrom 2010;39:216-20.
- Elanor W, Rolfes S. Understanding Nutrition. 10th ed. New York: Thomson-Wadsworth; 2005.
- Dunn MJ, Grant R. Red blood cell calcium and magnesium: Effects upon sodium and potassium transport and cellular morphology. BiochimBiophysActa 2005;352:97-116.
- Rotruck JT, Pope AL, Ganther HE, Swanson AB, Hafeman DG, Hoekstra WG. Selenium: Biochemical role as a component ofglutathione peroxidase. Science 1973;179:588-90.
- Bendale Y, Bendale V, Paul S, Bhattacharyya SS. Green synthesis, characterization and anticancer potential of platinum nanoparticles. J Chinese Integr Med 2012;10:681-9.
