- *Corresponding Author:
- Kalpana Patel
Department of Quality Assurance, Anand Pharmacy College, Opp. Town Hall, Anand-388001, India
E-mail: kalpana_jpatel@yahoo.com
| Date of Submission | 28 May 2016 |
| Date of Revision | 14 September 2016 |
| Date of Acceptance | 27 September 2016 |
| Indian J Pharm Sci 2016;78(5):631-640 |
This is an open access article distributed under terms of the Creative Commons Attribution-NonCommercial-ShareAlike 3.0 License, which allows others to remix, tweak, and build upon the work non-commercially, as long as the author is credited and the new creations are licensed under the identical terms.
Abstract
A high performance liquid chromatographic method was developed and validated for the quantitative determination of brinzolamide and brimonidinetartrate. Employing an isocratic RP-HPLC Phenomenex C18 (5 μm, 250×4.6 mm) column resulted in an adequate separation for brinzolamideand brimonidine tartrate with retention time of 5.7±0.345 and 3.8±0.568 min, respectively. Best resolution was achieved with the phosphate buffer (pH 6.6):acetonitrile:methanol (45:15:40) as mobile phase pumped at the flow rate of 1.0 ml/min with the detection wavelength of 254 nm. Regression coefficient for both brinzolamide and brimonidine tartrate was found to be 0.9993 and 0.9965, respectively indicating linearity within the concentration range. Fractional factorial design, 24-1 was applied to assess the robustness of the developed method. Various independent variables selected for robustness testing were wavelength, acetonitrile volume in the mobile phase, flowrate and pH of the mobile phase. It was statistically evinced that retention time of drugs without the loss of resolution between two drugs, is affected by varying the independent variables flow rate and acetonitrile volume in the mobile phase from minimum to maximum. Hence, the limits must be strictly defined for the method conditions; flow rate and acetonitrile volume in mobile phase for optimum separation of drugs with acceptable retention time and resolution. The validation parameters like linearity, precision, accuracy, limit of detection and limit of quantitation were also found to be suitable. The proposed method can hence be successfully applied to quantify brinzolamide and brimonidine tartrate during quality control of formulation.
Keywords
Brinzolamide, brimonidine tartrate, high performance liquid chromatography, validation, robustness, fractional factorial design
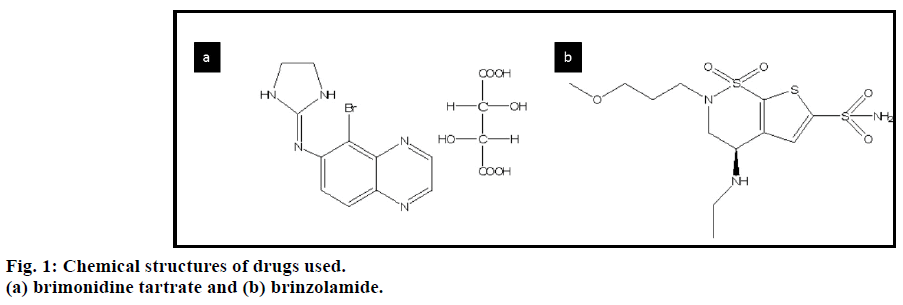
A novel fixed dose combination for open angle glaucoma approved by USFDA combines a carbonic anhydrase inhibitor brinzolamide (BZ) (1%) with an alpha agonist brimonidine tartrate (BT) (0.2%) [1]. BZ chemically is (R)-(+)-4-Ethylamino- 2-(3-methoxypropyl)-3,4dihydro-2H-thieno- [3,2-e]- 1,2-thiazine-6-sulfonamide-1,1dioxide [2] (fig. 1a) and BT chemically is 5-bromo-6-(2-imidazolidinylideneamino) quinoxaline L-tartrate (fig. 1b) [3]. An official method for the quantification of BZ is available in the United States Pharmacopoeia [2] and various analytical methods like spectrophotometry and chromatography are available for estimation of BZ in combination with other ophthalmic drugs other than BT [4-6]. Also for the estimation of BT and its combination with ophthalmic drugs other than BZ several analytical methods like HPTLC, HPLC, spectrofluorimetry are reported [7-24]. As far as simultaneous estimation of BZ and BT is considered, spectrophotometric methods [25-27] and HPLC method is reported [28,29]. The reported method for simultaneous estimation by BZ and BT by HPLC does not include the application of design of experiments (DoE) in robustness testing as a part of extensive method validation. The determination of robustness during analytical method validation nowadays is best known and most widely applied in the pharmaceutical world because of the strict regulations in that domain set by regulatory authorities which require extensively validated methods and also it facilitates the in detail study of the factors that negatively affects the quality in pharmaceutical analysis processes such as transfer of analytical method protocol from donor site to acceptor site. Hence, in the present work chromatographic method along with Quality by Design (QbD) approach to study robustness of the developed method has been reported.
The emergence of the use of QbD principles in pharmaceutical manufacturing has led to the application of QbD to analytical methods also, as per recent suggestions by FDA [30] implementation of QbD helps to develop robust method facilitating continuous improvement throughout the life cycle of the method.
DoE is a good alternative than classical approach one variable at a time (OVAT) tool to evaluate robustness providing very innovative framework with a predictive probability that offers maximum information about how the factors influence the response evaluated while requiring minimum time that further can facilitate process of method transfer protocol from transferring to receiving site [31-34]. Thus, in the present study, a multivariate approach using experimental design is employed to study the simultaneous variation of factors for a response to understand the robustness of the method thereby determining the critical factors and strict control of these critical factors during the execution of method.
Hence an attempt has been made to develop a simple, sensitive, economical and robust method for the simultaneous analysis of BZ and BT; and DoE was applied to assess the robustness of the developed method, followed by graphical interpretation of data by Pareto chart, 3D plots and statistical interpretation by ANOVA and MLR.
Materials and Methods
Pharmaceutical grade BZ and BT were procured as a gratis sample from Biocon Limited, Bengaluru and Sun Pharma Advanced Research Centre, Vadodara, respectively. All solvents and chemicals used were of analytical grade, purchased from Merck Specialities Pvt. Ltd., India and S. D. Fine-Chem Limited, Mumbai, respectively.
HPLC, LC-2010 CHT, Shimadzu, Japan was used in the study. The method optimization was performed using Phenomenex C18 (5 μm, 250×4.6 mm) column and diode array detector SPD- M20 A, Shimadzu, Japan. Development and validation of HPLC method was accomplished using LC solution software version 1.25 (Shimadzu, Japan). Method robustness testing using experimental design was carried out by Design-Expert trial version 9.0.1 (Stat-Ease Inc., Minneapolis). The calculations were carried out using Microsoft Excel 2010 software (Microsoft Corporation, USA).
Preparation of standard solutions
Standard stock solutions of 1000 μg/ml for BZ and BT were prepared by weighing accurately 100 mg of BZ and BT, dissolving in small volume of mobile phase and diluting up to the mark 100 ml with the diluent mobile phase. Further dilutions from this standard stock solution were carried out to obtain a working standard solution of concentration 1000 ng/ml.
Method development and optimization of chromatographic conditions
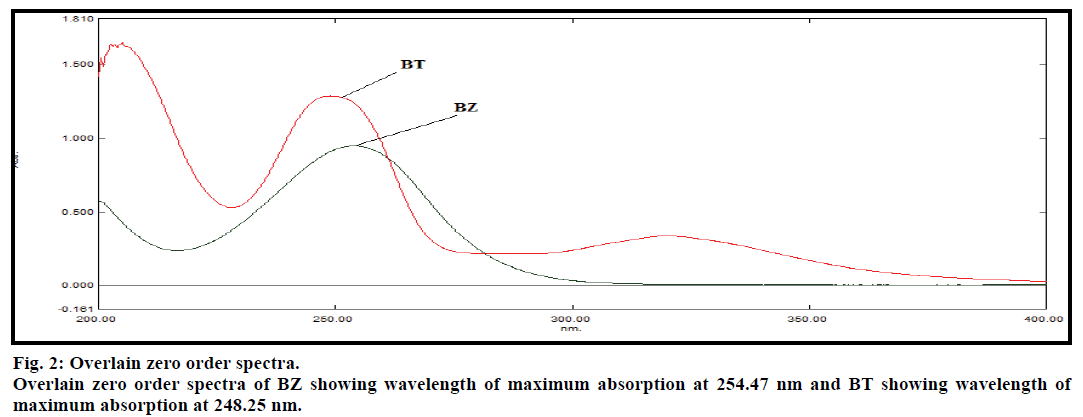
Chromatographic separations were carried out and the chromatograms were recorded using several solvents with different buffers as mobile phase to achieve proper separation of both the drugs with acceptable retention time, theoretical plates and resolution. Several solvents tried were methanol, water, acetonitrile and different buffers like potassium phosphate buffer of pH 4, 5, 6, 7, 10 and sodium phosphate buffer of pH 7. The mobile phase was filtered through 0.45 micron nylon membrane filter, degassed in ultrasonic bath and pumped from the respective solvent reservoir to the column at the flow rate of 1.0 ml/min. The column temperature was maintained at 25° and the detection wavelength kept was 254 nm (fig. 2). The injection volume was kept 20 μl. Equilibration of column was practiced for 30 min prior to the injection of the drug solution. For the resolved peak, peak area, theoretical plates, retention time and resolution were recorded.
Validation of the current method was performed in accordance with the ICH Q2 (R1) Guidance for the determination of accuracy, precision, LOD, LOQ and sensitivity [35]. System suitability test was performed before analysis and the result of each system suitability test was compared with the defined acceptance criteria. Resolution (>2.0), retention factor (k>2), theoretical plate (N>2000), tailing factor (T≤2.0) and %RSD were evaluated for results from five replicate injections of the drug solution.
Linearity
Linear relationship between peak area and concentration for both the drugs was evaluated over the concentration range of 50-1600 ng/ml. Homoscedasticity of the variances along the regression line of each drug was verified using the Bartlett’s test. The standard deviation of slope and the intercept was calculated using ordinary least squares.
Precision
Precision of the developed method was studied by performing repeatability and intermediate precision and it was expressed in % RSD. Three replicates of three concentration; 100, 200 and 400 ng/ml for both BZ and BT drug were analyzed on the same day for repeatability and on the different day to ascertain intermediate precision.
Accuracy
The accuracy was evaluated by the methodological recovery studies to check the recovery of each drug at different levels in the sample solution for the optimized method. It was carried out by adding known amount of standard drug solution (125, 250 and 375 ng/ml) to the sample solution (250 ng/ml for each drug) at 50, 100 and 150% level and analyzing it by the proposed method, in triplicate. Percent recovery was then calculated for both the drugs, BZ and BT.
Robustness
To study robustness, four factor fractional factorial designs (FFD) was employed (24-1). Full factorial designs were fractionated by the exclusion of experiments designed to identify higher order effects and this reduced designs are known as fractional factorial designs [36,37]. The combinations of factor levels represent the conditions at which responses will be measured. Each experimental condition is called a run and the response measurement an observation. The entire set of runs is the design. Fractional factorial experiments uses known properties of the design to selectively reduce the size of an experiment and limiting the tradeoff of critical information that might be lost by not conducting a comprehensive investigation of all possible combinations of the levels of the factors of interest. Fractional factorial experiments allow informed decisions to be made about the consequences of reducing the size of an experiment [38,39].
Specificity
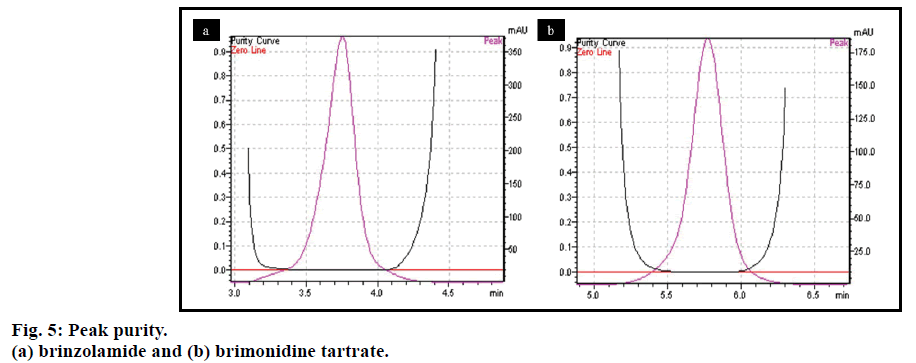
ICH guidelines define specificity as the ability to assess unequivocally the analyte in the presence of components which may be expected to be present [35]. In the present study the specificity of the HPLC method was examined by identifying the peak purity of the separated species to ensure that no co-eluting or co-migrating impurity was contributing to the peak’s response. Peak purity was studied by evaluating the peak profile of the BZ and BT obtained by injecting sample solution of suspension containing 300 ng/ml BZ and 60 ng/ml BT.
Limit of detection (LOD) and limit of quantitation (LOQ)
The determination of LOD and LOQ was based on the average standard deviation of the response and slope of constructed calibration curves (n=5) as described in the linearity calculation. Hence, sensitivity of the proposed method was estimated in terms of LOD and LOQ using formulae; LOQ=10×σ/S and LOD=3×σ/S. respectively, where, σ is standard deviation of the Y-intercept of the five calibration curves and S is mean slope of five calibration curve.
In the present study, four factors i.e. pH of mobile phase (factor A), flow rate (factor B), acetonitrile volume in mobile phase composition (factor C) and wavelength (factor D) were selected based on the criticality of factors observed during trial runs, chromatographic intuition and experience gained from previous optimization studies. To quantitatively analyze the deviation from the original value for the considered response, the Rt and percentage recovery, the arrays of factors examined were deliberately changed from the optimum method settings of both the drugs BZ and BT. The four factors with their deliberate changes in terms of high and low level is as shown in the Table 1. The experimental domain of the selected variables included 8 experimental runs with coded values for factor levels using FFD. All experiments were performed in randomized order to minimize the bias effects of uncontrolled factors. Design expert software was used to predict the percentage contribution of each factor followed by ANOVA statistical analysis, along with graphical interpretation of perturbation, contour and 3D surface plot.
| Factors | High level | Low level |
|---|---|---|
| pH (unit) (A) | 6.8 | 6.4 |
| Flow rate (ml/min) (B) | 1.2 | 0.8 |
| Acetonitrile volume in mobile phase composition (ml) (C) | 20 | 10 |
| Wavelength (nm) (D) | 256 | 252 |
Table 1: Experimental Factors and Levels
Application of analytical method for analysis of ophthalmic suspension
One ml of the eye drop suspension formulation (1.0 and 0.2% suspension of BZ and BT, respectively) was accurately transferred in a 10 ml volumetric flask containing about 4 ml of the diluent mobile phase and it was sonicated for 5 min to obtain a clear solution followed by dilution up to the mark with the same diluent and filtration using a 0.45 μm nylon membrane filter. Further dilution was carried out to obtain final concentration of 300 and 60 ng/ml for BZ and BT, respectively. 20 μl of this solution was injected and the peak area from the obtained chromatogram was recorded. This study was repeated three times and percent recovery along with %RSD was calculated.
Results and Discussion
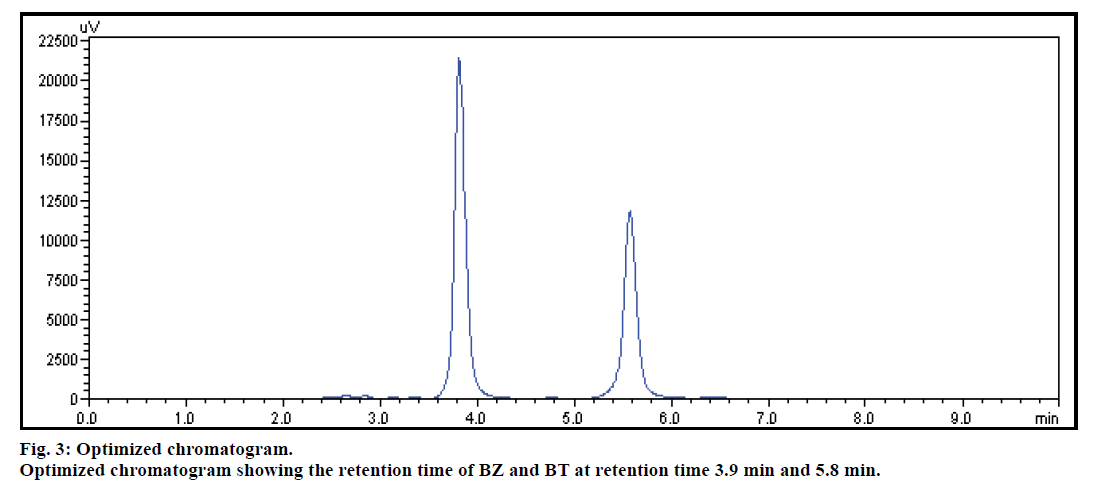
The mobile phase was optimized for resolution of both drugs in short run time. A series of mobile phase including acetonitrile, water and methanol individually as well as in combination were tried in different ratio and compositions with the objective of satisfying system suitability parameter. Initially, methanol and acetonitrile alone and in combination with water, did not elute both the drugs, but resulted in elution of only one drug. Hence, acetonitrile was tried with methanol, where BZ was not eluted up to run time of 15 min. While methanol in combination with water/ acetonitrile (50:50) resulted in peak splitting with distorted peak shape for BT along with elution of BZ at Rt of 7 min. Further, to improve peak shape and reduce peak splitting, it was thought of interest to adjust pH using different buffers to elute the drugs. Hence, the mobile phase containing phosphate buffer and methanol in ratio of 50:50 was attempted which resulted in the elution of both drugs, with fronting in peak for BZ. Further, ternary mixture mobile phase consisting of phosphate buffer (pH 7) along with acetonitrile and methanol was attempted which gave satisfactory elution profile for both the drugs, BZ and BT but the SST parameters obtained were not as per the specifications. The best optimized results along with the acceptable SST parameters were obtained by using the combination of (50 mM) phosphate buffer (pH 6.6):methanol:acetonitrile (45:40:15) as mobile phase which provided the optimum conditions for proper migration and resolution of BZ and BT. Under these conditions, the eluted peaks were narrow, resolved and free from tailing. The elution order was BT (Rt=3.8±0.568 min) and BZ (Rt=5.7±0.345 min) at detection wavelength of 254 nm (fig. 3).
The system suitability parameters like repeatability of peak area for BZ and BT (63686.67±0.293 and 96344±0.409 for BZ and BT, respectively), theoretical plate (4851.610±0.578 and 7715.465±0.841 for BZ and BT, respectively), resolution (7.296±0.108) and tailing factor (asymmetric factor, 1.094±0.321 and 1.010±0.138 for BZ and BT, respectively) were as per the specifications and the method applicability was found to be suitable.
The adherence to the Beer’s law for BZ and BT was ascertained by regression coefficient (r2) of 0.9993 and 0.9965, respectively (Table 2). Further homoscedasticity of variance for response peak area with respect to the concentration range of 50-1600 ng/ ml for BZ and BT was also validated by Bartlett’s test. The results signified that the variance of response was homogeneous as the calculated χ2 value for BZ (4.934) and BT (4.557) was found to be less than the critical value at 95% confidence interval, χ2 (0.05, 7)=14.1. The LOD of BZ and BT was found to be 6.06 and 5.51 ng/ ml, respectively. The LOQ for BZ and BT was found to be 18.38 and 16.70 ng/ml, respectively. The low value of LOD and LOQ indicated adequate sensitivity of the method.
| Parameters | BZ | BT |
|---|---|---|
| Linearitya | ||
| Calibration range (ng/ml) | 50-1600 | 50-1600 |
| Regression equation | y=51.234x+978.3 | y=75.266x+3888.6 |
| Correlation coefficient (r2) | 0.9993 | 0.9965 |
| Slope±SD | 0.037±0.0361 | 0.272±0.307 |
| Intercept±SD | 94.125±1.477 | 125.514±1.192 |
| Bartlett’s testb (X2) | 4.934 | 4.557 |
| Sensitivity (ng/ml) | ||
| LOD | 6.06 | 5.51 |
| LOQ | 18.38 | 16.7 |
| Precisionc (%RSD) | ||
| Repeatability | 0.26 | 0.29 |
| Intermediate Precision | 0.45 | 0.38 |
| Accuracyd (%) | ||
| Recovery studies | 99.84-100.62 | 100.34-100.63 |
a mean of five replicates, bχ2(0.05,7) <value 14.1 at 95 % confidence interval, cmean of six replicates, d mean of three replicate at three concentration level, SD is standard deviation, RSD is relative standard deviation
Table 2: Validation Analytical Parameters
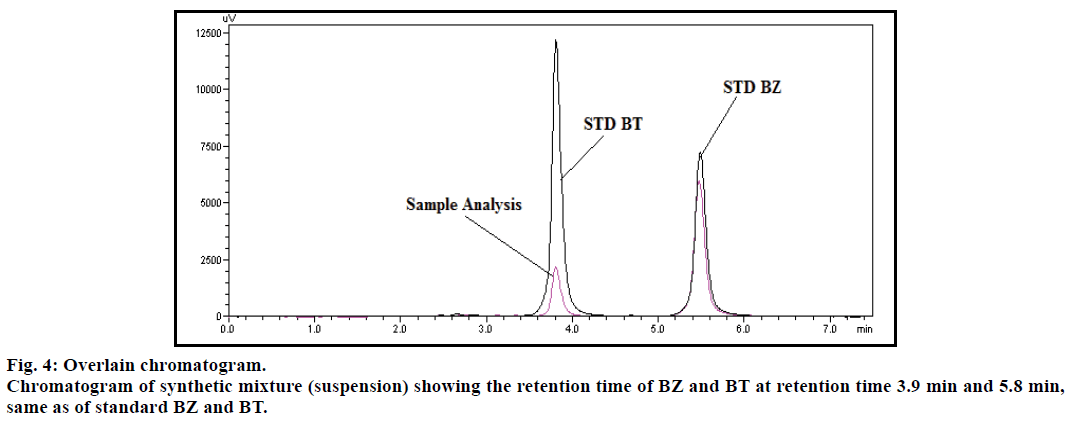
Specificity of the method was established by comparing retention time of both drugs BZ and BT, obtained from the formulation and the standard drug. The retention time of the standard drug and the formulation was found to be same for both the drugs (fig. 4), so the method was found to be specific. Moreover there was no interference from excipients at the peaks observed for both the drugs and also the base line did not show any significant noise. There was no impurity detected for both BZ and BT (fig. 5), while peak purity index was found to be 1.000 and 0.99994 for BT and BZ, respectively.
Precision of developed method was evaluated by repeatability and intermediate precision. The intraday precision for BZ and BT showed % RSD less than 0.26 and 0.29%, respectively (Table 2). And the interday precision for BZ and BT revealed % RSD less than 0.45 and 0.38%, respectively. The low value of % RSD represented good repeatability and reproducibility of the developed method.
Accuracy was carried out at three different levels 50, 100 and 150%. The percentage recoveries for BZ and BT were in the range of 99.84-100.62% and 100.34- 100.63%, respectively. The low value of %RSD indicated the accuracy of the method; hence the developed method can be applied for routine drug analysis (Table 2).
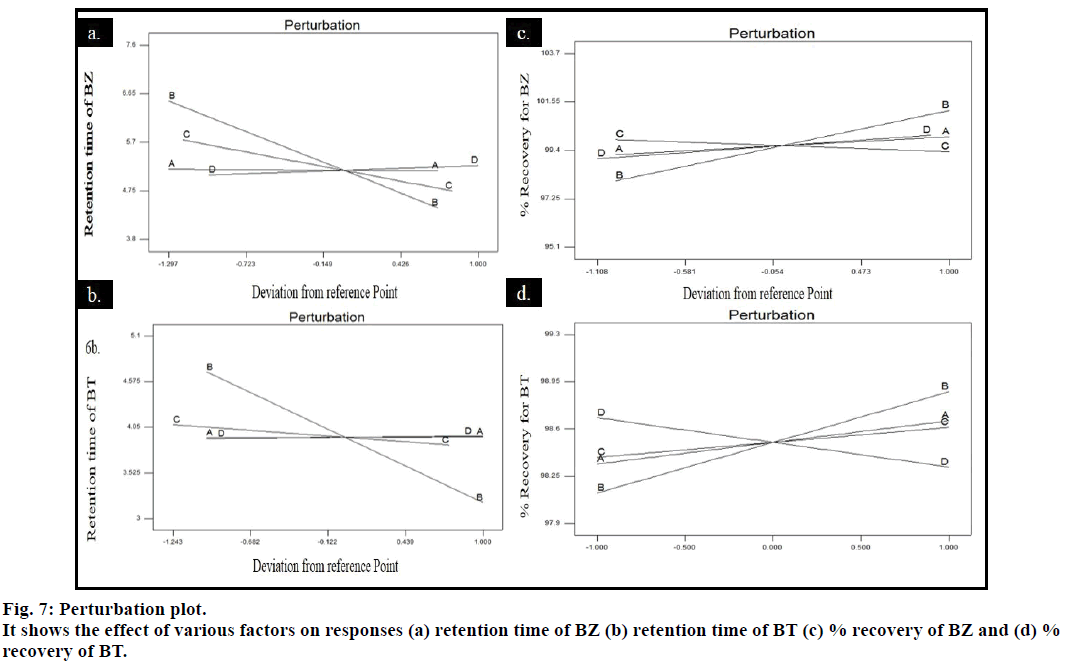
All the runs as per the design domain were performed independently and the effects obtained on the responses are as shown in the Table 3. The factorial model selected for the response retention time showed that for the retention time of BZ and BT, the independent factors flow rate and acetonitrile volume in the mobile phase were significantly affecting the response. Changing the factors as per the experimental domain resulted in slight variation in the retention time of both BZ and BT without loss of separation. While for the response percentage recovery of BZ and BT no significant model terms were observed. All the statistical parameters were found to be in range depicting the best fit of the model applied as shown in Table 4. Rather than analysis of single coefficient whole model equation was used and in depth analysis was carried out to assess whether they produced significant or non-significant effect on response. Equations obtained from the models were for retention time of BZ+5.54+0.066×A- 1.04×B–0.37×C+0.092×D–0.4×A×C; retention time of BT+3.96+0.033×A–0.75×B-0.12×C+0.015×D-0.11 ×A×C; % recovery of BZ+99.55+0.21×A+1.57×B- 0.27×C+0.52×D+1.73×A×D and for % recovery of BT+98.50+0.16×A+0.38×B+0.11×C-0.18×D+0.19× A×B+0.22×A×D. As per the constructed polynomial equation, factor B (flow rate) and factor C (volume of acetonitrile in the mobile phase) were significantly affecting the response and showed negative influence on the response retention time for both the drugs i.e. decreasing their levels increased the response.
| Factors | Responses | ||||||
|---|---|---|---|---|---|---|---|
| A pH |
B Flow rate |
C Acetonitrile |
D Wavelength |
Rt of BZ | Rt of BT | % Recovery for BZ |
% Recovery for BT |
| 6.8 | 0.8 | 10 | 256 | 7.6 | 5.0 | 100.316 | 98.105 |
| 6.4 | 0.8 | 10 | 252 | 6.3 | 4.7 | 99.648 | 98.368 |
| 6.8 | 1.2 | 10 | 252 | 5.2 | 3.4 | 99.818 | 99.151 |
| 6.4 | 0.8 | 20 | 256 | 6.6 | 4.6 | 96.777 | 97.937 |
| 6.8 | 1.2 | 20 | 256 | 3.9 | 3.0 | 103.699 | 99.295 |
| 6.8 | 0.8 | 20 | 252 | 5.7 | 4.5 | 95.191 | 98.094 |
| 6.4 | 1.2 | 20 | 252 | 4.5 | 3.2 | 101.456 | 99.122 |
| 6.4 | 1.2 | 10 | 256 | 4.4 | 3.2 | 99.492 | 97.937 |
Table 3: Fractional Factorial Design 24-1 Domain
| Response | C.V % | Press | R-squared | Adjusted R-squared |
Predicted R-squared | Adequate precision |
|---|---|---|---|---|---|---|
| Rt of BZ | 1.92 | 0.72 | 0.999 | 0.993 | 0.936 | 37.55 |
| Rt of BT | 1.47 | 0.22 | 0.999 | 0.995 | 0.954 | 36.91 |
| % Recovery of BZ | 2.93 | 181.20 | 0.471 | -0.233 | -0.275 | 1.86 |
| % Recovery of BT | 0.50 | 5.11 | 0.702 | 0.305 | -1.116 | 3.32 |
Table 4: Anova Summary Statistics
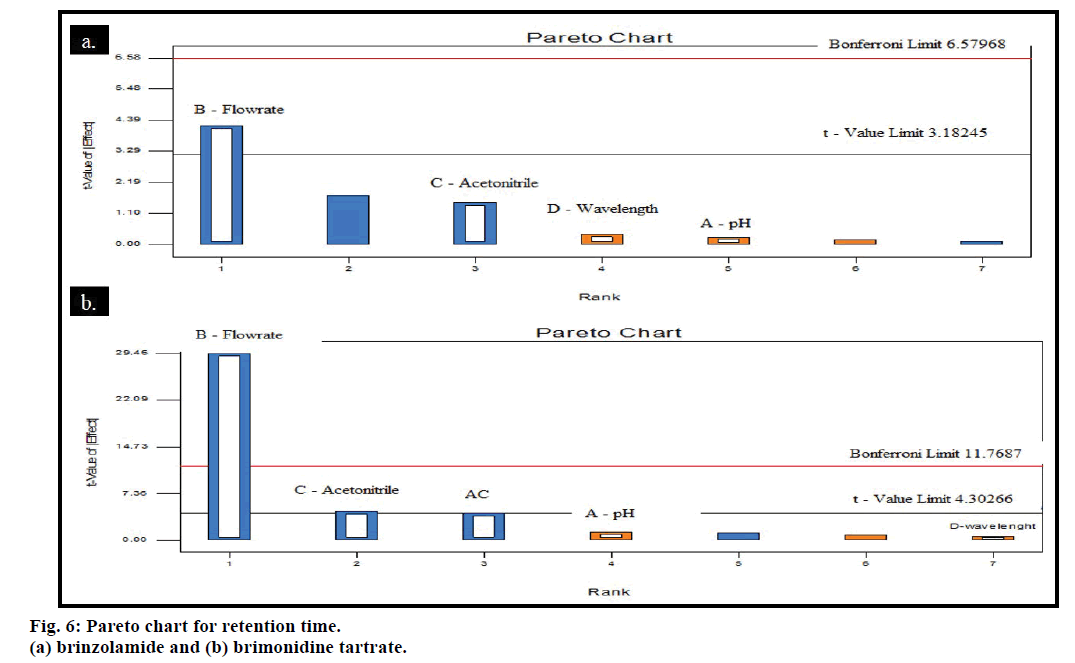
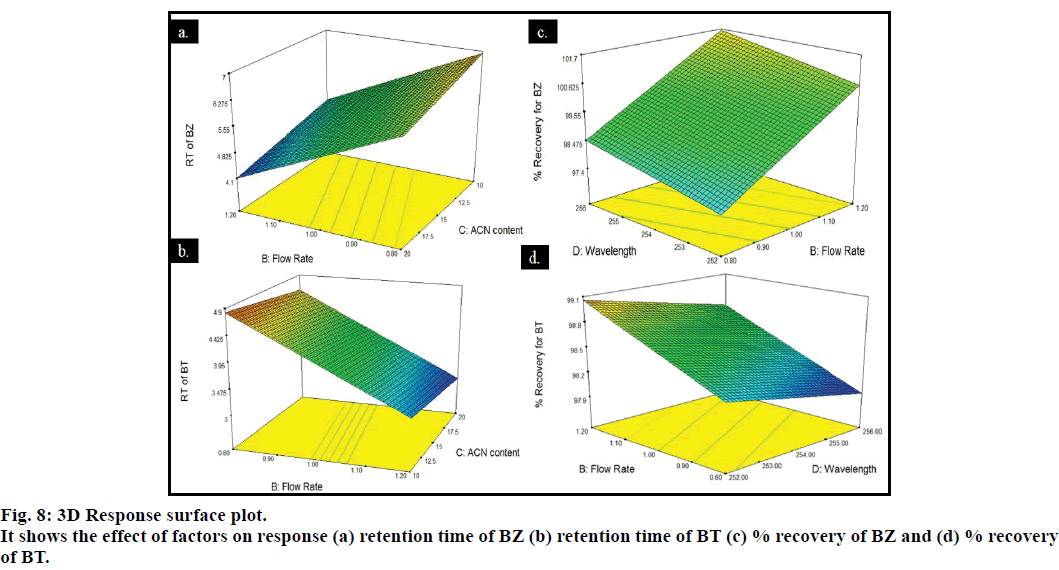
Pareto and perturbation plots were constructed to evaluate the effect of factors on the response. Pareto chart and perturbation revealed that the factor flow rate (B) was contributing more in altering the response retention time compared to other three factors for both the drugs BZ and BT (figs. 6 and 7). The 3D plot showed that when pH and wavelength were kept constant at 6.6 and 254 nm, respectively and flow rate was changed from 0.8-1.2 ml/min decrease in the retention time of BZ and BT from 4.825-4.6 min and 4.425-3 min, respectively was observed and when volume of acetonitrile was increased from 10 to 20 ml, the retention time for BZ and BT was observed to decrease from 4.825 to 4.1 min and 4.9 to 3.5 min, respectively giving an indication of deviation of the response along with the retention of the resolution between the drugs to an acceptable level (fig. 8). The percentage contribution of the factors on response of BZ and BT showed that factor B, flow rate was having more effect on response, resulting in percentage contribution of 76.41% (Rt for BT), 95.27% (Rt for BZ), 40.73% (% recovery for BZ) and 46.63% (% recovery for BT). Analysis of variance (ANOVA) showed that the F statistic values for factors flow rate and acetonitrile volume in the mobile phase were higher and the associated p values for the retention time of BZ and BT were less than 0.05, indicating that the model could explain 95% of the variability. Hence, the limits has to be set and strictly defined for the flow rate (0.9- 1.1 ml/min) and acetonitrile volume (12.5-17.5 ml) in the mobile phase for optimum separation of drugs with acceptable retention time and resolution while the method was found robust against small variation in wavelength and pH. Similarly, study of percentage recovery of BZ and BT showed that the method was robust against the evaluated four factors.
Analysis of synthetic ophthalmic suspension showed good recovery of 99.74±0.34% and 100.45±0.21% for BZ and BT, respectively and also % RSD value was found to be less than 2 indicating applicability of the method in the routine quality control testing of bulk drugs and marketed ophthalmic formulation.
Using isocratic RP-HPLC with UV detection mode, a simple, rapid and reproducible method for simultaneous estimation of BZ and BT in ophthalmic formulations was developed, optimized and validated. The percentage recovery of the drugs by the proposed method was in good agreement with the label claim of the formulation. Moreover, the relative standard deviation and coefficient of variation calculated were satisfactorily low, indicating the suitability of the proposed method for the routine estimation of ophthalmic dosage forms. Furthermore, fractional factorial design was successfully used to test the robustness of the developed HPLC method. Two level four factors Fractional factorial experimental design was employed successfully for evaluation of robustness. From results of ANOVA and analysis of Pareto, perturbation and response surfaces plots; it can be concluded that responses percentage recovery for BZ and BT are robust for all the four factors within selected range but for the response, retention time for both the drugs BZ and BT, a precautionary statement for setting the flow rate and acetonitrile volume in the mobile phase at its nominal value i.e. 1 ml/min and 15 ml, respectively should be included in the analytical procedure.
Acknowledgements
Authors thank Biocon limited, Bengaluru and Sun Pharma Advance Research Centre, Vadodara, India for providing free sample of brinzolamide and brimonidine tartrate, respectively.
Financial support and sponsorship
Nil.
Conflicts of interest
The author declares no competing interests.
References
- Whitson JT, Realini T, Nguyen QH, McMenemy MG, Goode SM. Six-month results from a phase III randomized trial of fixed-combination brinzolamide 1% + brimonidine 0.2% versus brinzolamide or brimonidine monotherapy in glaucoma or ocular hypertension. Clin Ophthalmol 2013;7:1053-60.
- United State Pharmacopoeia. USP 35 NF 30, Vol II. Rockville, MD: United States Pharmacopoeial Commission; 2012. p.1551.
- United State Pharmacopoeia. USP 30 NF 25, Vol II. Rockville, MD: United States Pharmacopoeial Commission; p. 3749.
- Khatum R, Ashraful ISM. Development and validation of analytical method for simultaneous estimation of brinzolamide and timolol by HPLC from ophthalmic preparation. Int J Pharm Sci Res 2014;5:1001-07.
- Purvi S, Ankita K, Riddhi K, Kalpana P, Tejal G. Simultaneous determination of brinzolamide and timolol maleate using three different spectrophotometric methods. World J Pharm Pharm Sci 2014;3:1955-67.
- Purvi AS, Ankita SK, Niketa RG, Kalpana GP. Simultaneous estimation of brinzolamide and timolol maleate using chromatographic methods. Res J Pharm Biol Chem 2014;5:1010-17.
- Vinayaka DG, Satishkumar SA, Manzoor A, Anil SM. Simulatanoues determination of brimondine tartrate and timolol maleate in combined pharmaceutical dosage form using two different green spectrophotmetric method. Journal of Harmonized Research in Pharmacy 2015;4:52-9.
- Hiral SP, Hemant MP. Simultaneous determination of brimonidine tartrate and timolol maleate in combined pharmaceutical dosage form using two different green spectrometric methods. World J Pharm Pharm Sci 2014;3:1331-40.
- Abdullah AE, Lobna MA, Mustafa SM, Hany MH. Development and validation of HPLC method for simultaneous estimation of brimonidine tartrate and timolol maleate in bulk and pharmaceutical dosage form. J Chromatograph Separat Techniq 2014;5:230.
- Suketa KM, Dilip GM. Analytical method development and validation for simultaneous estimation of timolol maleate and brimonidine tartrate in bulk and marketed ophthalmic formulation. J Pharm Sci Bioscientific Res 2014;4:351-6.
- Pritam SJ, Rahul NK, Sanjay JS. Development and validation of first order derivative UV-spectrophotometric method for determination of brimonidine tartrate in bulk and in formulation. Asian J Pharm Biol Res 2011;1:323-9.
- Whitson JT, Realini T, Nguyen QH, Mc Menemy MG, Goode SM. Six-month results from a phase III randomized trial of fixed-combination brinzolamide 1% + brimonidine 0.2% versus brinzolamide or brimonidine monotherapy in glaucoma or ocular hypertension. Clin Ophthalmol 2013;7:1053–60.
- Heta HD, Anandkumari DC. Three simple validated UV spectrophotometric methods for the simultaneous estimation of timolol maleate and brimonidine tartrate and their comparison using anova. Inter J Pharm Res Ana 2014;4:168-77.
- Anand M, Fonseca A, Gandhi SV, Deshpande PB. Development and validation of high performance thin layer chromatographic method for estimation of brimonidine tartrate as bulk drug and in ophthalmic solutions. Int J Pharm Tech Res 2010;2:1376-79.
- Elzanfaly ES, Saad AS, Elaziz A, Elaleem BA. A smart simple spectrophotometric method for simultaneous determination of binary mixtures. J Pharm Anal 2012;2:382-85.
- Shirke RR, Pai N. RP-HPLC determination of brimonidine tartrate in brimonidine tartrate eye drops. Indian Drugs 2002;39:484-86.
- Jain PS, Khatal RN, Jivani HN, Surana SJ. Chromatography development and validation of TLC-densitometry method for simultaneous estimation of brimonidine tartrate and timolol maleate in bulk and pharmaceutical dosage form. J Chromatograph Separat Techniq 2012;2:1-5.
- Jiang S, Chappa AK, Proksch JW. A rapid and sensitive LC/MS/MS assay for the quantitation of brimonidine in ocular fluids and tissues. J Chromatogr B Anal Technol Biomed Life Sci 2009;877:107-14.
- Madhavi A, Naidu A, Subba RDV, Srinivasu P. Development and validation of a new lc method for analysis of brimonidine tartrate and related compounds. Chromatographia 2009;69:1413-19.
- Phogat A, Kumar MS, Mahadevan N. Simultaneous estimation of brimonidine tartrate and timolol maleate in nanoparticles formulation by RP-HPLC. International Journal of Advances in Pharmaceutical Research 2011;3:31-6.
- Sonanis MC, Rajput AP. Development and validation of a new stability indicating analytical method for the determination of related components of brimonidine tartrate in drug substances and drug product using UPLC. Int J Pharm Pharm Sci 2011;3:145-50.
- Sunitha G, Bhagirath R, Alapati VR, Ramakrishna K, Subrahmanyam CVS, Anumolu PD. Fluorimetric quantification of brimonidine tartrate in eye drops. Indian J Pharm Sci 2013;75:730-32.
- Ali MS, Khatri AR, Munir MI, Ghori MA, Stability-indicating assay of brimonidine tartrate ophthalmic solution and stress testing using HILIC. Chromatographia 2007;70:539-44.
- Parmar V, Dhara P, Sharav D, Dhananjay M. Development and validation of derivative spectrophotometric method for simultaneous estimation of brimonidine tartrate and brinzolamide in combined dosage form. Int J Recent Adv Pharm Res 2014;4:1472-8.
- Agrawal P, Desai S, Jani GK. Development of ultraviolet spectrophotometric method for the simultaneous estimation of brimonidine tartrate and brinzolamide. Indian Drugs 2015;52:29-34.
- Rajashree M, Bharat S. Development and validation of spectrophotometric method for simultaneous estimation of brinzolamide and brimonidine tartrate. Asian J Pharm Life Sci 2014;4:16-20.
- Varsha A, Sonal D, Girish J. Development of RP-HPLC method for simultaneous determination of brimonidine tartrate and brinzolamide by QbD approach and its validation. Eurasian J Anal Chem 2016;11:63-78
- Gunasekar M, Mohammed A. Development and validation of ultra violet spectrophotometric and reversed-phase high performance liquid chromatography techniques for simultaneous estimation of brinzolamide and brimonidine tartrate in ophthalmic suspension formulation. Orient J Chem 2016;32:1111-20.
- Department of Health and Human Services. Pharmaceutical Quality for the 21st Century, A Risk-Based Approach Progress Report, May, 2007. US Food and Drug Administration (FDA), 2007.
- Ana RM, Costa M, Jairo KB, Luís APF. Dynamic maceration of Copaifera langsdorffi leaves: a technological study using fractional factorial design. Braz J Pharmacog 2013;23:79-85.
- Packianathera M, Chana F, Griffithsa C, Dimovb S, Phamb DT. Optimisation of micro injection moulding process through design of experiments. Procedia CIRP 2013;12:300-5.
- Tadeusz I, Anna G, Paulina M, Ewelina R. New HPLC method with experimental design and fluorescence detection for analytical study of antihypertensive mixture, amlodipine and valsartan. American J Anal Chem 2013;4:17-23.
- Janc BS, Rakic T, Slavkovic B, Kostic N, Vemic A, Malenovic A. Systematical approach in evaluation of LC method for determination of raloxifene hydrochloride and its impurities employing experimental design. J Pharm Anal 2013;3:45-52.
- International Conference on Hormonisation of Technical Requirements for Registration of Pharmaceuticals for Human Use, ICH Harmonised Tripartite Guideline, Validation of Analytical Procedures: Text and Methodology Q2(R1), Complementary Guideline on Methodology dated 06 November 1996, incorporated in November 2005, London.
- Lewis GA, Mathieu D, Phan-Tan-Luu R. Pharmaceutical Experimental Design. New York: Marcel Dekker Inc.; 1999.
- Gonzaalez A. Two level factorial experimental designs based on multiple linear regression models: a tutorial digest illustrated by case studies. Anal Chim Acta 1998;360:227-41.
- Ragonese R, Mulholland M, Kalman J. Full and fractionated experimental designs for robustness testing in the high-performance liquid chromatographic analysis of codeine phosphate, pseudoephedrine hydrochloride and chlorpheniramine maleate in a pharmaceutical preparation. J Chromatogr A 2000;870:45-51.
- Vujanovi IK. Chemometrically assissted optimization and validation of RP-HPLC method for the analysis of itraconazole and its impurities. Acta Pharm 2013;63:159-73.
- Isabela CC, Gerson AP. Robustness evaluation of the chromatographic method for the quantitation of lumefantrine using Youden’s test. Braz J Pharm Sci 2009;45:235-40.
