- *Corresponding Author:
- Sadhana Rajput
Department of Pharmacy, Centre of Relevance and Excellence in Novel Drug Delivery Systems, G. H. Patel Building, The Maharaja Sayajirao University of Baroda, Fatehgunj, Vadodara-390 002, India
E-mail: sjrajput@gmail.com
| Date of Submission | 19 January 2016 |
| Date of Revision | 19 October 2016 |
| Date of Acceptance | 25 November 2016 |
| Indian J Pharm Sci 2016;78(6):789-800 |
This is an open access article distributed under the terms of the Creative Commons Attribution-NonCommercial-ShareAlike 3.0 License, which allows others to remix, tweak, and build upon the work non-commercially, as long as the author is credited and the new creations are licensed under the identical terms
Abstract
In the present study a QbD acquiescent method utilizing design of experiment and method operable design regions methodology was evaluated for optimization of chomatographic condition for separation of ten degradation products along with peaks of aspirin and lansoprazole. Box-Behnken design was exploited to evaluate the main and interaction effects of the selected critical process parameters on the critical quality attributes, viz resolution between thee peak pairs and retention time of last eluting peak. The optimal separation was predicted at pH 3.6, with a gradient starting at 20% of acetonitrile and initial hold time of 10 min. The results of experimental methods show excellent agreement with predicted results, highlighting the importance of design of experiments in method optimization. The selected working condition was then fully validated according to ICH guidelines for linearity, range, accuracy, precision and robustness.
Keywords
DOE, QbD, SIAM, lansoprazole
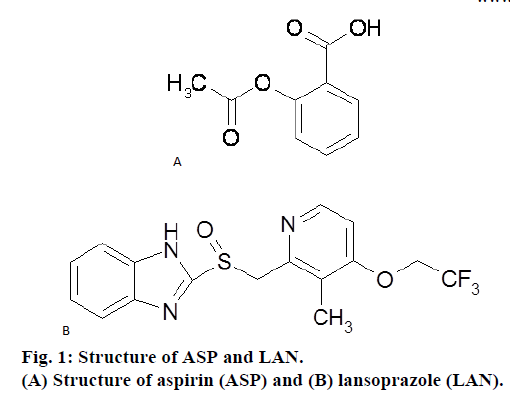
“Right analytics at right time” plays significant role in drug product development cycle and is expected to strengthen by implementation of analytical quality by design (AQbD). The need for consistency in analytical method development intensifies the dependence of pharmaceutical product development and manufacture on robust analytical data. The AQbD parallel to the product quality by design (QbD) benefits the product quality with high degree of assurance. Even though International Conference on Harmonization (ICH Q8 R2) guidelines do not discuss analytical method development in correlation with design space, it is implicit that the concept can be utilized to analytical design space and continuous improvement in method understanding [1]. A number of excellent articles appeared in the literature [2-8] that described strategies for the application of QbD principles to chromatographic method development. The work presented in this article addressed key steps of AQbD with special focus on method optimization. Aspirin (ASP, Figure 1a), is one of the most widely used drugs for analgesia, inflammation and antipyresis. Structurally, it is 2-(acetyloxy) benzoic acid. Over the past decade, antithrombotic effects of aspirin due to inhibition of cyclooxygenase activity in platelets and subsequent reduction in thromboxane A2 synthesis have been explored for the treatment and prevention of recurrence of myocardial infarction, angina and cerebral infarction. However, administration of low-dose ASP may cause gastric or duodenal ulcers, thus preventing the onset of ulcers in that patient population becomes important. Takeda Pharmaceuticals launched Takelda combination tablets, a fixed-dose combination of low-dose ASP and lansoprazole (LAN) [9]. LAN (Figure 1b) is a proton pump inhibitor, which selectively inhibits H+/K+-ATPase in gastric parietal cells. Structurally, it is 2-({ [3-methyl-4- (2,2,2-trifluoroethoxy)pyridin-2-yl]methane}sulfinyl)- 1H-1,3-benzodiazole. ASP and LAN individually have an official status in United States Pharmacopeia (USP) and British Pharmacopoeia (BP), but their combination is not official in any of the pharmacopoeias.
Several analytical techniques are available for analysis of both the drugs individually as well as in combination with other drugs [10-15]. Stability indicating high performance liquid chromatography (HPLC) method for determination of LAN in combination with other proton pump inhibitors [16], stability indicating ultraperformance liquid chromatography (UPLC) method for estimation of LAN and its impurities [17], stability indicating HPLC method for combination of low-dose ASP with esomeprazole in capsule dosage form [18], stability indicating HPLC method for simultaneous estimation of ASP and prasugrel [19] have been reported. Degradation behaviour of combination of ASP and atorvastatin had also been published [20]. Literature review revealed that the simultaneous separation of aforementioned analytes was not presented before. Therefore, in the present paper we describe the strategy based on QbD utilizing Box Behnken Design (BBD) for optimization and development of a specific stability indicating RP-HPLC method for combination of ASP and LAN and separation of their impurities resulting in an optimally performing analytical method.
Materials and Methods
ASP and LAN bulk drugs were obtained as gift samples from Sun Pharmaceuticals, Vadodara and Zydus Cadila, Ahmedabad, respectively. HPLC grade acetonitrile (ACN) was procured from Spectrochem Pvt. Ltd., Mumbai. Potassium dihydrogen phosphate was purchased from Loba Chemicals Pvt. Ltd. (Mumbai, India). Unless otherwise specified, all solutions were filtered through a 1.2 μm Ultipor N66 Nylon 6, 6 membrane filter (Pall Life Sciences, USA) prior to use. All the required solutions were prepared in HPLC grade water. Analytical grade hydrochloric acid (HCl) and sodium hydroxide (NaOH) were purchased from S. D. Fine chem. Ltd., Mumbai, India. Hydrogen peroxide (H2O2) was procured from Fischer Ltd., India.
Equipment and chromatographic condition
Photolytic degradation study was carried out in a photostability (Thermolab Scientific Equipments Pvt. Ltd., Vadodara) chamber consisting of four UV (Osram L73) and fluorescent (Osram L20) lamps. The system is capable of controlling specific temperature and humidity (±2° and ±5% RH). For thermal and humidity study; thermal-humidity (S. R. Labs Instruments, Thane, Maharashtra) chamber was used and set at accelerated condition of 40°/75% RH.
Chromatographic separation was performed on Shimadzu (Shimadzu Corporation, Kyoto, Japan) Gradient LC system equipped with Shimadzu LC- 20AD binary pump and Shimadzu SPD-M20A detector and Rheodyne 7725 injector with fixed loop of 20 μl. Data acquisition and integration was performed using LC Solutions software. Chromatographic separations were carried out using Oyster C8 column, (Column dimensions: 250×4.6 mm, 5 μm particle size) operated at 25° with gradient elution at a total flow rate of 1.0 ml/min. Mobile phase A comprised of phosphate buffer (10 mM) and mobile phase B was ACN. The gradient elution pattern of mobile phase was set as time (min)/% mobile phase B: 0.01/20, 10/20, 13/35, 16/50, 24/35, 30/30, 35/25, 37/20 and 40/20. Data analysis in design of experiment (DOE) was performed using Statease Design Expert v.9.0 software and other calculations using Microsoft Excel 2010.
Preparation of sample and buffer solutions
Stock solution was prepared in ACN at a concentration of 1000 μg/ml. From the stock solution working standards were prepared in ACN to produce 6.5-162.5 μg/ml of ASP and 1-25 μg/ml of LAN, respectively. The combined dosage formulation of LAN and ASP is Takelda combination tablets launched by Takeda Pharmaceuticals (ASP 100 mg and LAN 15 mg), is not yet available in Indian market, so a laboratory sample was prepared using the excipients mentioned in the literature [21,22]. Suitable dilutions were made in ACN to obtain the final concentration range from 6.5 to 162.5 μg/ml of ASP and 1-25 μg/ml of LAN for recovery studies and assay of synthetic mixture. In the present study phosphate buffer (10 mM) at pH 3.6 has been selected to ensure a sufficient buffer capacity. pH was adjusted 3.6 using ortho-phosphoric acid which was finally filtered with 0.2 μm nylon membrane filter and degassed by ultrasonication for 5 min.
Preparation of degradation products (DPs)
Acid/base hydrolysis was performed using a procedure in which, 6.5 mg ASP and 1 mg LAN were dissolved in 0.03 N freshly prepared HCl/NaOH by sonication for 30 s in an ultrasonicator bath. Volume was made up to the mark using 1.2 N HCl/NaOH. The solution was allowed to stand in dark for 1 h. Aliquots of 2 ml of this sample was withdrawn into another 10-ml volumetric flask, neutralized with NaOH/HCl. Similarly, placebo samples were also prepared.
Peroxide-induced degradation (oxidation) was carried out by dissolving 6.5 mg ASP and 1 mg LAN in 6% H2O2 by sonication for 30 s in an ultrasonicator bath. Volume was made up to the mark using 6% H2O2. Solution was allowed to stand in dark for 1 h. A 2 ml aliquot of this sample was withdrawn. Similarly, placebo samples were also prepared. For the photochemical stability study, a mixture of the two active pharmaceutical ingredients (API) was spread in 1 mm thickness on a petridish and exposed to 5382 LUX and 144 UW/cm2 for 11 days. For preparing dry heat DPs, API of ASP and LAN were placed in an oven at 70° for 14 days under dry heat condition in the dark and cooled to room temperature. Thermal humidity-induced degradation was studied by placing a mixture of the APIs of ASP and LAN in a stability chamber at 40±2° and 75±5% RH for 21 days. After suitable dilution with mobile phase, the degradation samples were filtered using 0.2 μ nylon membrane syringe filter prior to injection.
Results and Discussion
The QbD-based method commenced with determination of method intent or goal since QbD is a systematic approach to product and process design and development. A tool for method development was the analytical target profile (ATP) that described the requirements of method, which are expected to be measured. Here, in the present study the ATP was to develop a stability indicating liquid chromatographic method that showed well-resolved, sharp and asymmetric peak of ASP and LAN; the drug peaks should be resolved with peaks of degradants and the resolved peaks should be acquired in shorter run time [23,24].
In the present study, method design was studied for selecting appropriate experimental condition like buffers, temperature, pH, columns and organic modifier. Various buffers (ammonium acetate, ammonium formate and potassium dihydrogen phosphate buffer) were tried. Due to wide range of pH and better sensitivity of peaks phosphate buffer was selected for further method development.
Temperature does not have much effect on peak symmetry, sensitivity and resolution, hence it was kept ambient. Moreover, various columns were also tried to achieve best separation, these were Kromasil C18 (250×4.6 mm, 5 μm), Phenomenex C18 (250×4.6 mm, 5 μm) and Oyster C8 (250×4.6 mm, 5 μm). Separation achieved using Oyster C8 column (250×4.6 mm, 5 μm particle size) led to the best results.
Selection of the optimum pH range was a challenge for the present method of development. ASP is an acidic drug with carboxylic acid and acetoxy functional groups in its structure so it requires acidic pH of buffer to retain the analyte in unionized form while LAN is weakly basic in nature that contained trifluoromethane functional group and may require basic mobile phase. Various combinations of phosphate buffer with ACN and methanol were tried in an isocratic system to obtain a well-resolved chromatogram comprising of ASP and LAN in the presence of their DPs, but satisfactory results could not be achieved. Salicylic acid which was the major DP of ASP was merged with the peak of ASP. An attempt to separate the two peaks led to increase in asymmetry of the peaks. Moreover, the degradation peaks of LAN overlapped with the peak of ASP, making accurate estimation of ASP difficult. Literature review revealed that LAN is stable in basic pH and elutes as a sharp symmetric peak around pH 7. But ASP could not be eluted at this pH. It was found that ASP in its ionized form eluted as a broad and bifurcated peak. Hence, an optimized method for the two had to be developed at acidic pH around 3 to 4 where both the drugs simultaneously elute as sharp, symmetrical and well resolved peaks.
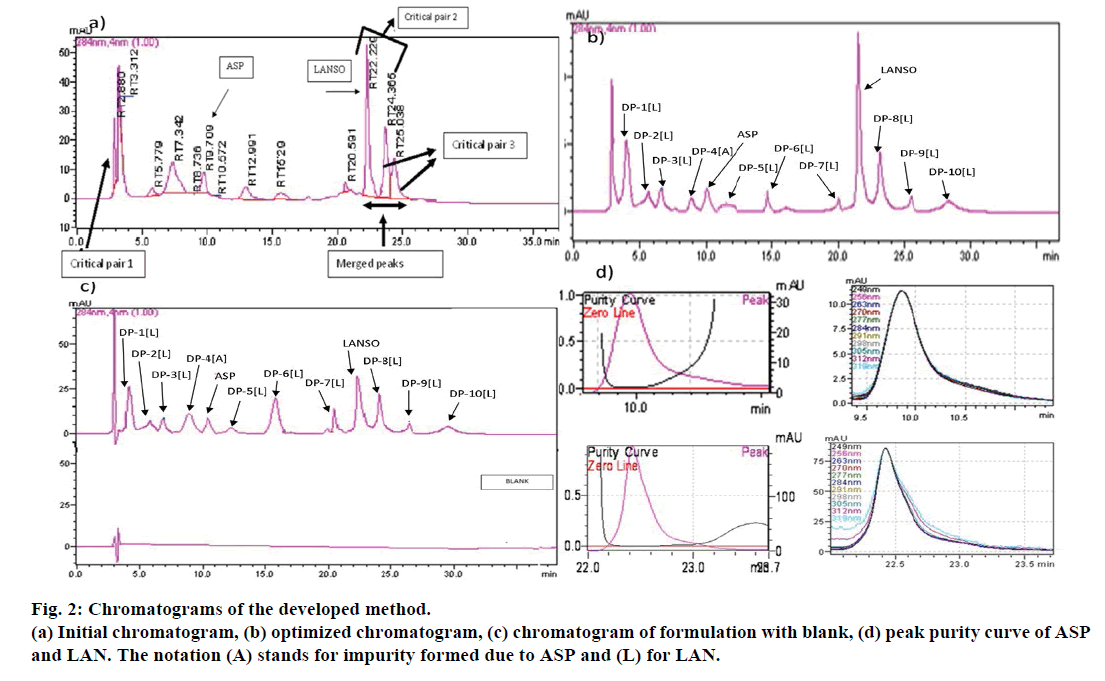
As well resolved chromatogram could not be obtained with isocratic elution; different gradient systems were then resorted to. Phosphate buffer in acidic pH range from 2.8 to 4.5 were tried. Influence of methanol and isopropyl alcohol (IPA) as organic modifiers were also evaluated. Some of the initially merged peaks were found to be resolved using methanol or IPA, but peak shape of LAN and some of its impurities was found to be distorted and baseline separation could not be achieved. Hence, optimization had to be done using combination of buffer and ACN using varying gradient slope. Figure 2 showed the initially developed chromatogram using phosphate buffer pH 3 and ACN. Here, one of the impurities of LAN was found to be merged with the H2O2 interference (critical pair 1). Peak of LAN needed to be resolved from its major non-polar impurity (critical pair 2) and two of the LAN impurities eluted as merged peaks which required baseline separation (critical pair 3). Hence, these challenges were then resolved by employing DOE approach.
Method development strategy (MDS) comprised DOE. The knowledge obtained about existing method by applying DOE helped in risk assessment. This allowed for effective control strategies for critical parameter. Factors or chromatographic parameters (CPPs) that might influence the critical responses (CQAs) were chosen and shown in Table 1. BBD with three factors and five centre points that requires total number of 17 experimental runs (Table 2) was utilized. Table 3 summarizes the data of fit and ANOVA for the developed models.
| Variables (CPPs) | -1 | 0 | +1 |
|---|---|---|---|
| pH | 3 | 3.5 | 4 |
| Initial % CAN | 20 | 25 | 30 |
| Initial hold time (min) | 4 | 8 | 12 |
| Responses (CQAs) | |||
| R1 resolution between critical pair 1 | |||
| R2 resolution between critical pair 2 | |||
| R3 resolution between critical pair 3 | |||
| Rt retention time (of last eluting peak) |
Table 1: Factors and critical responses for bbd
| Run | pH (A) | Initial %ACN (B) | Initial hold time (C) |
|---|---|---|---|
| 1 | 3.5 | 25 | 8 |
| 2 | 3.5 | 25 | 8 |
| 3 | 3.5 | 25 | 8 |
| 4 | 3.5 | 30 | 12 |
| 5 | 3.5 | 20 | 4 |
| 6 | 4 | 25 | 4 |
| 7 | 3.5 | 25 | 8 |
| 8 | 4 | 25 | 12 |
| 9 | 3 | 25 | 12 |
| 10 | 3.5 | 20 | 12 |
| 11 | 3.5 | 30 | 4 |
| 12 | 4 | 20 | 8 |
| 13 | 3 | 30 | 8 |
| 14 | 3 | 25 | 4 |
| 15 | 3.5 | 25 | 8 |
| 16 | 4 | 30 | 8 |
| 17 | 3 | 20 | 8 |
Table 2: Experimental runs for bbd
| Response | r2 | Adjusted r2 | Predicted r2 | RMSE | Standard deviation | Adequate precision | Press | F value |
|---|---|---|---|---|---|---|---|---|
| R1 | 0.9475 | 0.8799 | 0.9715 | 0.0872 | 0.25 | 9.741 | 6.77 | 14.03 |
| R2 | 0.8777 | 0.7985 | 0.9567 | 0.128 | 0.23 | 9.697 | 6.17 | 5.58 |
| R3 | 0.9865 | 0.9784 | 0.9424 | 0.117 | 0.21 | 34.092 | 1.83 | 121.75 |
| Rt | 0.9748 | 0.9425 | 0.7895 | 0.5411 | 0.6 | 19.542 | 40.07 | 30.14 |
Table 3: Summary of fit and analysis of variance (anova) of the responses
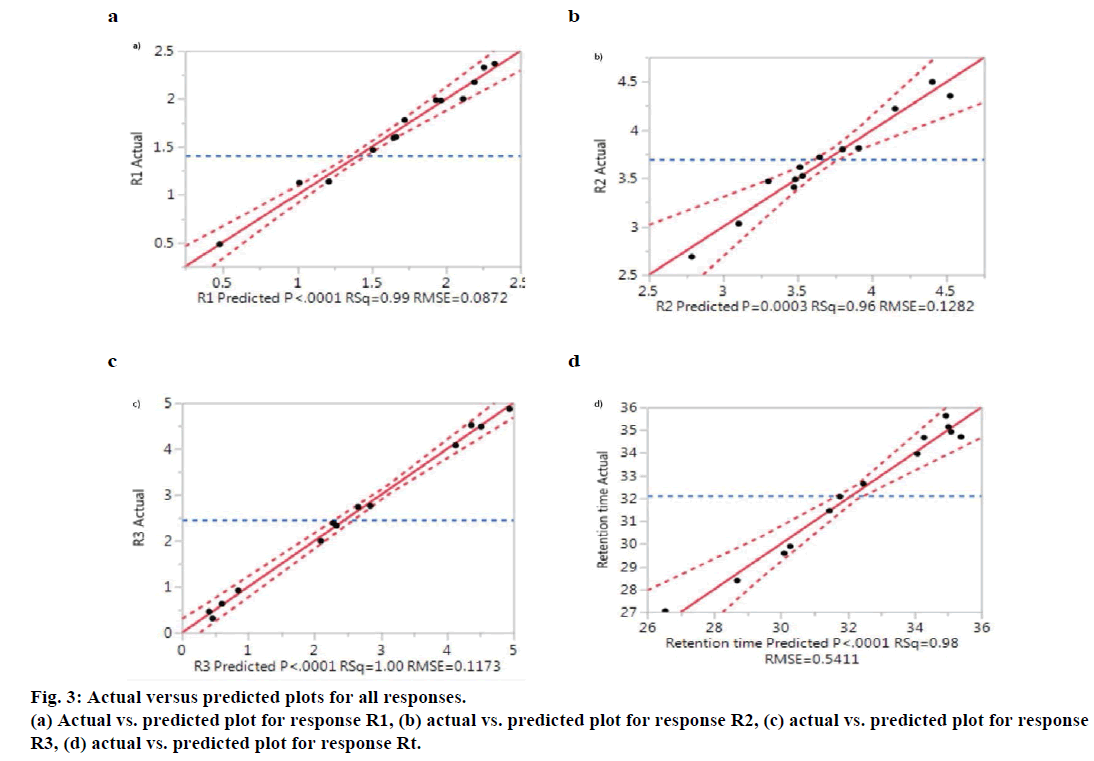
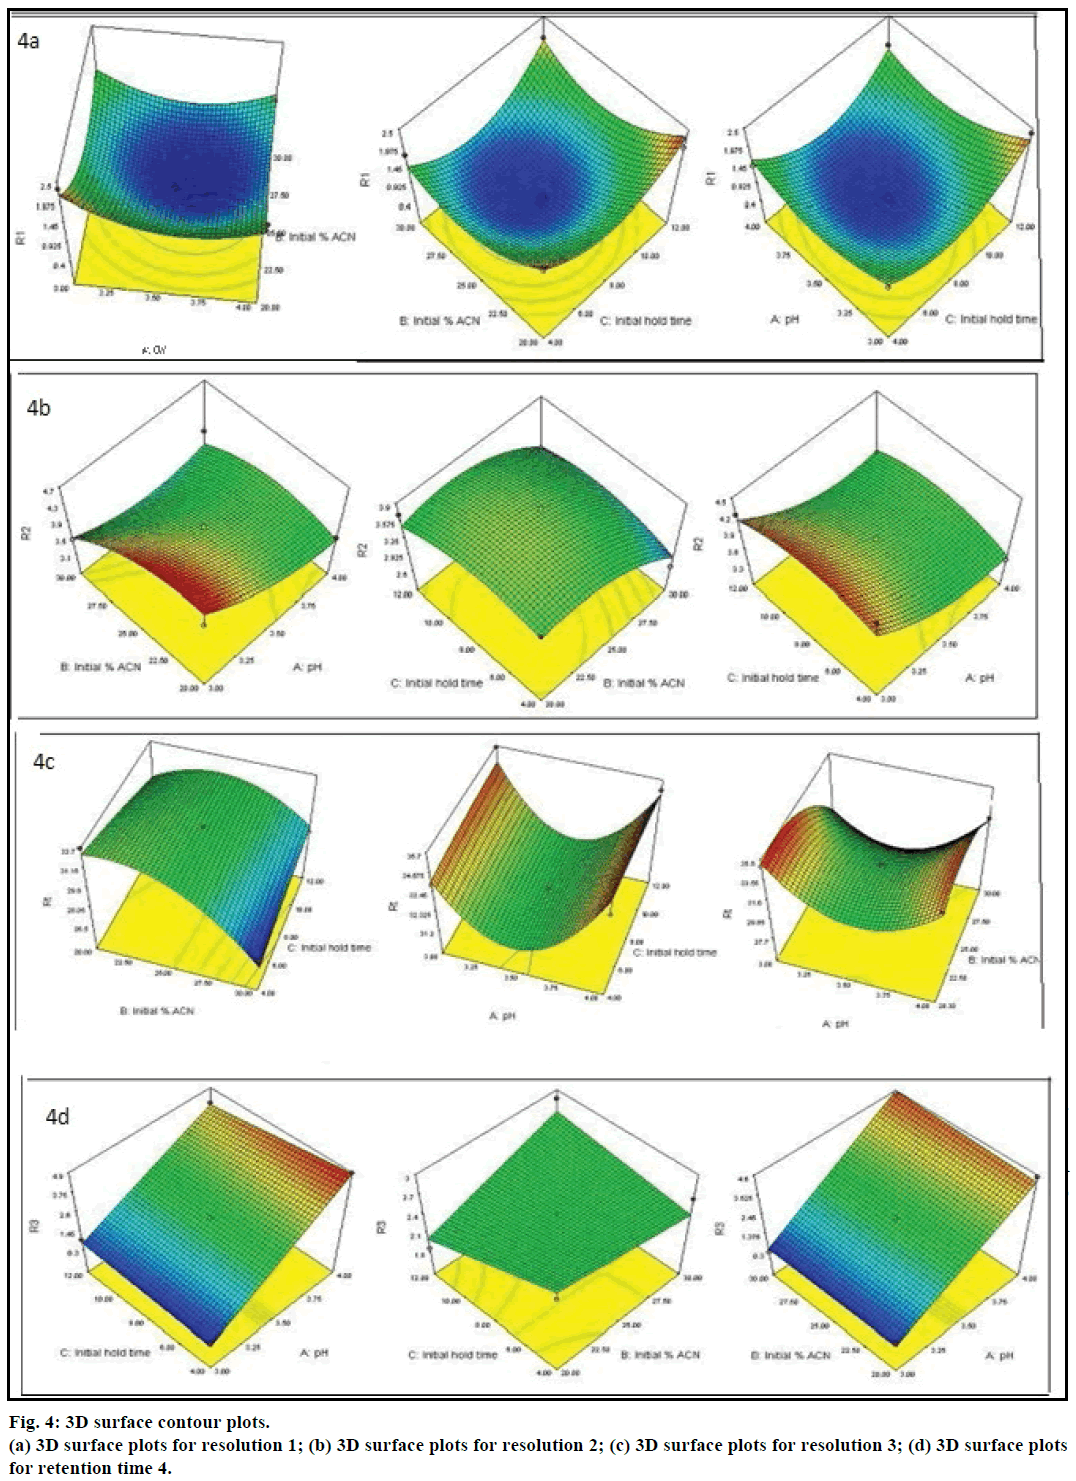
The P<0.0001 for R1, R3, R4 showed all models were statically significant, indicating the model explained a significant portion of the variability. The model fitting was good for all the responses as indicated by high r2 value (P<0.8). The values of 0.9475, 0.8777, 0.9865 and 0.9748 for R1, R2, R3 and Rt, respectively indicates that approximately 94.75, 87.77, 98.65 and 97.48% of the observed variation can be explained by grouping the variables. The ‘lack of fit’ values have been less than 0.05, which was not significantly indicated a good fit of the model for all responses. Figure 3 showed the actual vs. predicted plots of the experimental data obtained for all four CQAs along with r2 values and root mean square error (RMSE) values. The central red line is the line of linear regression along which various experimental points are dispersed, which is displayed by black spots. The dashed red line above and below, the line of fit indicated at 95% confidence level. As it can be seen from the Figure 3, all the experimental points are lying within the 95% confidence interval of their distance from the line of fit. Risk assessment and control strategy influences of important chromatographic factors were identified by ‘P-value’ in ANOVA. The ‘P-value’ associated with individual factors directs how it effects the CQA. Among all the factors, pH of mobile phase is the most influential and risk factor that can explain most variability in all responses. Hence, among all CPP’s pH of the mobile phase is high risk factor that should be rigorously controlled. For Rt, both pH and initial % of ACN were high risk factor since associated ‘P-value’ for both the factors are <0.0001. The effect exerted by individual CPPs on CQAs can also be explained by contour plots shown in Figure 4a, 4b, 4c and 4d. Moreover, interaction between different variables on the effect of the CQAs can be well studied from these plots. The colour coding indicated that as we proceed from blue to red in the graph area, value of the critical response increases. For instance, the contour plot depicted in Figure 4c for resolution R3 (resolution between critical pair, it can be observed that as the region of pH shifted from blue to red, the resolution between critical pair 3 increased whereas initial hold time and % ACN had least effect on improving resolution between critical pair 3. The relationship between the responses, influencing factors and interaction among factors is shown by prediction expression, which predicts the response values. The prediction expressions in terms of coded factors for all four CQAs generated after ANOVA analysis are shown below. A higher magnitude of the term indicates a greater contribution of that factor to the critical response studied. Moreover, the positive and negative sign on the term indicates direct and inverse proportionality, respectively on the critical response.
R1=+0.48-0.15×A-0.29×B+0.046×A×B-0.11×A× C+0.090×B×C+0.51×A2+0.69×B2 +0.81×C2, R2=+3.80-0.33×A-0.03×B-4.250E-003×C+0. 25×A×B+0.051×A×C+0.091×B×C+0.27×A2-Prediction expression and interaction plots showed the interaction among the selected CPPs on CQAs. The interaction effects among the factors were presented in regression analysis (Table 4) results. The failure of an individual factor to produce the identical effect on the response at the different levels of the other factor is an interaction effect. BC showed significant influence on response R3 and Rt while AB showed significant influence on response Rt, as the associated values are P<0.05. From Table 3, it is clear that r-squared values and adjusted r-squared values for CQAs were in close agreement with each other, RMSE and standard deviation values were <1. The measure of signal to noise ratio was given by adequate precision. A ratio higher than 4 is desirable, indicating that the corresponding model can be used to navigate the method operable design region (MODR).
| Factors | R1 coefficie nt |
P value (prob> F) | R2 coefficie nt |
P value (prob>F) | R3 coefficie nt |
P value (prob>F) | Rt coeffici ent | P value (prob>F) |
|---|---|---|---|---|---|---|---|---|
| Interce pt |
0.48 | 0.0011 | 3.80 | 0.0168 | 2.47 | <0.0001 | 31.45 | <0.0001 |
| A | -0.15 | 0.1226 | -0.33 | 0.0053 | 1.95 | <0.0001 | 0.35 | 0.1466 |
| B | -0.29 | 0.0134 | -0.30 | 0.0079 | 0.085 | 0.2753 | -1.73 | <0.0001 |
| C | 0.14 | 0.1611 | -4.250E- 003 |
0.9606 | -0.11 | 0.1635 | 0.045 | 0.8389 |
| AB | 0.046 | 0.7194 | 0.25 | 0.0734 | 0.072 | 0.5012 | 0.75 | 0.0407 |
| AC | -0.11 | 0.3877 | 0.051 | 0.6799 | -0.31 | 0.0129 | -0.31 | 0.3366 |
| BC | 0.090 | 0.4868 | 0.091 | 0.4612 | 0.25 | 0.0337 | 1.10 | 0.0077 |
| A2 | 0.51 | 0.0038 | 0.27 | 0.0520 | - | - | 3.50 | <0.0001 |
| B2 | 0.69 | 0.0007 | -0.31 | 0.0287 | - | - | -1.93 | 0.0003 |
| C2 | 0.81 | 0.0003 | -0.20 | 0.1185 | - | - | -0.10 | 0.7388 |
Table 4: Regression analysis results showing main and interaction effects of factors on responses
The optimized methods with acceptable ranges for responses were determined by setting the goals of the CQAs. Resolution R1 was selected to be >1.5, resolution R2 and R3 were set to be >2 and retention time of the last eluting peak was set to be minimum in order to reduce the total run time of method. Several optimized solutions for the specified criteria were generated by the software; out of which 4 solutions were used for checkpoint analysis (n=4) as shown in Table 5. One of the solutions with pH 3.6, Initial %acetonitrile 20% and initial hold time of 10 min was chosen as the optimized working point. The observed responses values lie within 95% confidence interval of the predicted response values. The final optimized chromatogram obtained with the selected working point is depicted in Figure 2b, which showed well resolved pairs of drugs and impurities.
| Optimized solution | Pred R1 | Obs R1 | Pred R2 | Obs R2 | Pred R3 | Obs R3 | Pred Rt | Obs Rt |
|---|---|---|---|---|---|---|---|---|
| pH: 3.83, initial %ACN: 28.80, initial hold time: 11.98 | 1.75 | 1.53 | 3.30 | 3.42 | 3.75 | 3.86 | 31.81 | 32.2 |
| pH: 3.99, initial %ACN: 24.44, initial hold time: 4.06 | 1.64 | 1.49 | 3.50 | 3.35 | 4.82 | 4.75 | 35.59 | 35.8 |
| pH: 3.36, initial %ACN: 28.52, initial hold time: 11.48 | 1.52 | 1.59 | 3.37 | 3.24 | 2.10 | 2.06 | 30.02 | 31.3 |
| pH: 3.61, initial %ACN: 20.01, initial hold time: 10.10 | 1.53 | 1.63 | 3.63 | 3.63 | 2.66 | 2.71 | 30.08 | 29.9 |
Table 5: Point verification and working point selection
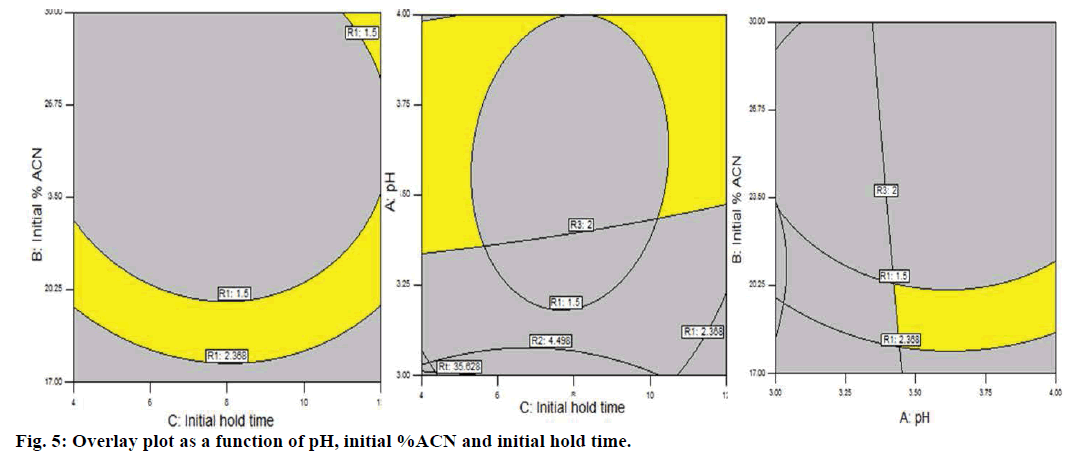
An effective model emphasizing an allowable MODR for a defined response is acquired by implementing a QbD approach. The peak purity index and peak threshold for ASP is 0.9999 and 0.9890 and for LAN 1.00 and 0.9997, respectively; which indicates spectrally pure peak (Figure 2d) of ASP and LAN was obtained in each experiment and specifies the appropriateness of the method. The multidimensional combination and interaction of input variables and process parameters that have been revealed to provide an assurance of quality is known as MODR or design space. Overlay plot of the method has been demonstrated in Figure 5. Grey region indicated non-robust method while yellow region demonstrated robust area representing the MODR. Navigation within this region is not considered as a change.
The developed stability indicating RP-HPLC method was validated according to ICH Q2 (R1) guidelines [25] for linearity, range, precision, accuracy, sensitivity, specificity and robustness. The data complying with the standards were obtained. Linearity was investigated by using concentrations in the range 6.5-162.5 μg/ml for ASP and 1-25 μg/ml for LAN. Retention time for ASP and LAN was found to be 10.2 and 22.5 min, respectively. Accuracy of the method was determined by standard addition method at three different levels (80, 100 and 120%) by recovery experiments. Known amounts of standard solutions containing ASP (44.9, 56.15 and 67.38 μg/ml) and LAN (6.8, 8.5 and 10.2 μg/ ml) were added to a pre-quantified laboratory mixture sample solutions to reach 80, 100 and 120% levels. Percent recovery was the mean of three determinations at each standard addition level. The mean percent recovery for ASP and LAN was found to be within 98- 101% and 99-102%, respectively.
To demonstrate precision, a series of measurements were done with ASP and LAN. Three replicate injections of specific standard at various time intervals on the same day were injected into system for intraday precision (repeatability) and were repeated on three different days for interday precision (intermediate precision). The % relative standard deviation (RSD) less than 2 showed that the method is precise. The limit of detection (LOD) and limit of quantification (LOQ) which determines the sensitivity of method were 1.3113, 3.98 and 0.0985, 0.298 for ASP and LAN, respectively. Specificity of the method was demonstrated by injecting the blank solution, standard solution, sample solution prepared from laboratory mixture with excipient and responses were determined.
Robustness of the method was found to be adequate for the parameters, pH, %organic composition of mobile phase and flow rate of mobile phase. The %RSD of ASP and LAN for response Rt and peak area were 10.177±1.097, 145841±0.0451, 22.476±1.32, 429225.3±0.0128 for pH; 10.392±0.06, 145529.79±0.762, 22.496±0.12, 429469.11±0.517 for %ACN; 10.284±1.82, 145742.33±0.115, 22.547±1.579, 429270.67±0.0349 for flow rate.
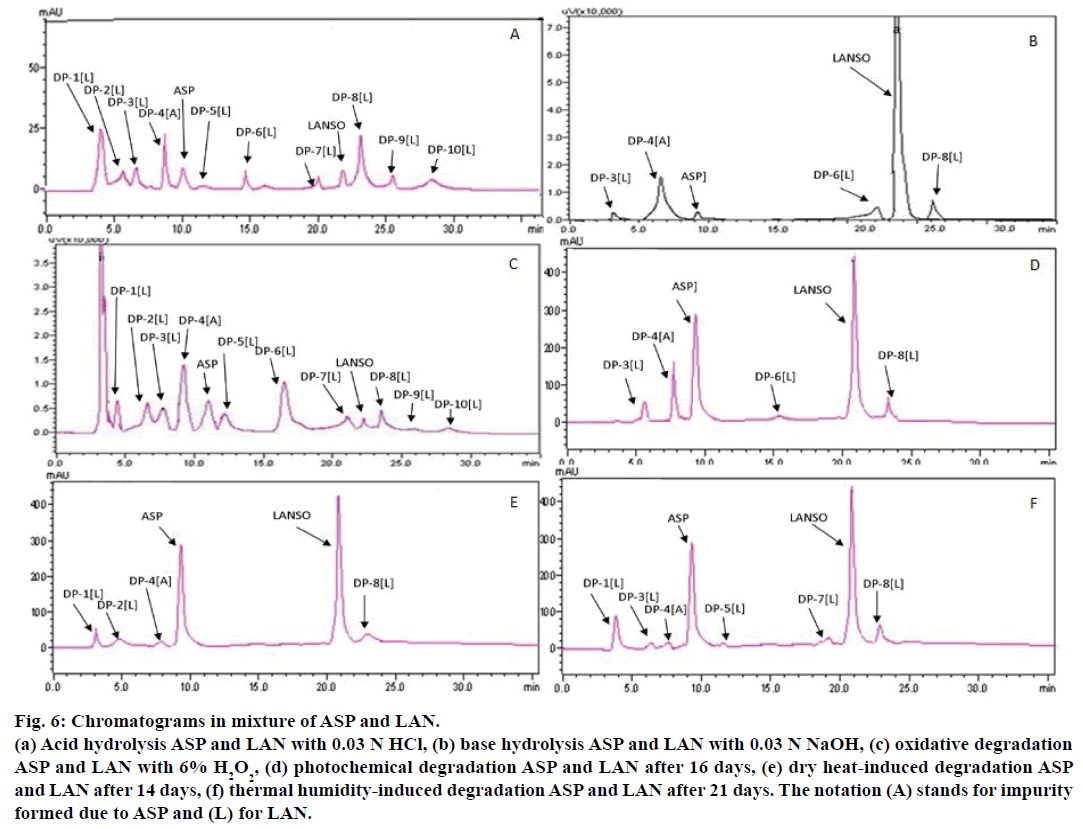
System suitability testing was carried out on freshly prepared standard solutions (n=6) containing ASP and LAN and were found to be 10.2±0.41 and 22.5±0.319 for Rt; 3152±246.3 and 41321±235.81 for theoretical plates; 1.102±0.16 and 1.42±0.0875 for tailing factor; 2.423±0.012 and 6.55±0.016 for capacity factor; 18.23±0.469 for resolution of ASP and LAN, respectively. A total of 10 DPs were formed in stress condition in ASP and LAN (Figure 2a and 2b) after forced degradation. The summary of forced degradation conditions with % degradation (calculated from regression equation) in various conditions is presented in Table 6. In acidic conditions, ASP was comparatively stable while LAN degraded rapidly up to 98% giving rise to a number of DPs. On the contrary, ASP degrades up to 95% in basic conditions while LAN was sufficiently stable at these conditions. Therefore, an optimum stressor condition where behaviour of both the drugs could be simultaneously studied again posed a major challenge. Figure 6a showed the acid degradation of ASP and LAN using 0.03 N HCl for 1 h at Rt. Salicylic acid is the major degradation related impurity, DP-4(A) of ASP, which was confirmed by spiking the standard. Available literature revealed that major process related impurity of LAN is the sulfide and sulfone impurity [26]. Ramulu et al. identified another potential acid degradation product of LAN as 1-methyl-10-thioxo-10H-4a,5,9b-triaza-indeno [2,1-a] inden-2-one [27].
| Stressor type | Stressor concentration | Time | %degradation (API) | %degradation (formulation) | ||
|---|---|---|---|---|---|---|
| LAN | ASP | LAN | ASP | |||
| Acid | 0.03 N HCl at Rt | 1 h | 98 % | 13.5% | 98.4% | 13.9% |
| Base | 0.03 N NaOH at Rt | 45 | 18.7% | 94.6% | 18.5% | 95.3% |
| Oxidation | 6% H2O2 at Rt | 1 h | 89% | 67% | 89.6% | 66.7% |
| Photo stability | 5382 LUX and 144UW/cm2 | 16 d | 18% | 12% | 16.8% | 11.7% |
| Dry heat | 70° | 14 d | 8.6% | 7% | 8.91% | 7.46% |
| Thermal humidity | 40°/75% RH | 21 d | 11.3% | 4.5% | 11.42% | 4.7% |
Table 6: Summary of forced degradation of asp and lan
Base hydrolysis of LAN exhibited a prodigious degradation behaviour. When LAN was exposed to 0.03 N NaOH for 45 min separately and as mixture with ASP, it was found that LAN degraded at a higher rate in the mixture form as compared to individual degradation. This is due to generation of salicylic acid in major quantities due to simultaneous presence of ASP, which in turn provides an acidic environment for LAN ultimately leading to more number of DPs as shown in Figure 6b. Battu and Pottabathini reported a new impurity, 7-(3-methyl-4-(2,2,2- trifluoroethoxy) pyridin-2-yl)-7H-benzo [4,5]imidazo [2,1b]benzo [4,5] imidazo [2,1-d]- [1,3,5]thiadiazine formed in harsh basic conditions [28]. DP-3(L), DP-4(A), DP-6(L) and DP-8(L), were formed in basic hydrolysis.
Figure 6: Chromatograms in mixture of ASP and LAN.
(a) Acid hydrolysis ASP and LAN with 0.03 N HCl, (b) base hydrolysis ASP and LAN with 0.03 N NaOH, (c) oxidative degradation
ASP and LAN with 6% H2O2, (d) photochemical degradation ASP and LAN after 16 days, (e) dry heat-induced degradation ASP
and LAN after 14 days, (f) thermal humidity-induced degradation ASP and LAN after 21 days. The notation (A) stands for impurity
formed due to ASP and (L) for LAN.
Oxidative degradation lead to formation of salicylic acid and phenyl acetic acid as impurities in ASP while LAN degrades to form sulfone impurity, des-sulfur LAN and N-oxide impurities as major degradants [29] but only salicylic acid was observed during ASP degradation. Peroxide degradation of ASP and LAN by 6% v/v H2O2 for 1 h is indicated in Figure 6c. All ten DPs were formed in oxidative degradation.
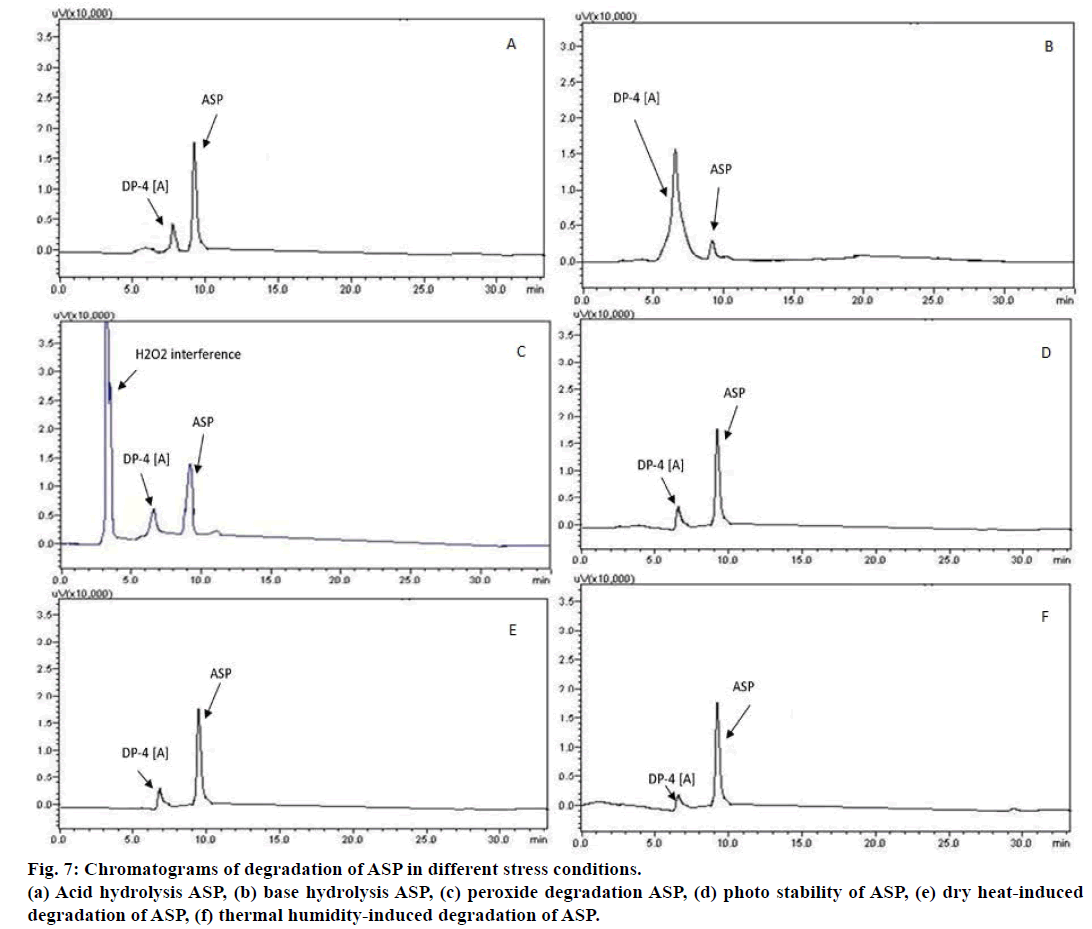
Photochemical degradation in ASP and LAN after 16 days at 5382 LUX and 144 UW/cm2 is depicted in Figure 6d. DP-3(L), DP-4(A), DP-6(L) and DP-8(L) were formed in photochemical degradation. Chromatograms for dry heat-induced degradation at 70° for 14 days and thermal humidity at 40°, 70±5% RH are shown in Figure 6e and 6f, respectively. Under dry heat condition DP- 1(L), DP- 2(L), DP-4(A), DP-8(L) and in thermal and humidity condition DP-1(L), DP-3(L), DP-4(L), DP- 5(L), DP-7(L), DP-8(L) were formed, respectively. The chromatograms of individual degradation of ASP and LAN at various degradation conditions are shown in Figure 7. The mean percentage assay values for ASP and LANSO were 100.483% and 98.436% respectively, demonstrating that the proposed method could be successfully applied for analysis of synthetic mixture.
Figure 2c displayed the chromatogram showing combined DPs of all stressor conditions applied to the prepared laboratory mixture along with blank chromatogram of prepared laboratory mixture (only excipients). No peak in the prepared synthetic mixture was found to be interfering with the analysis of ASP and/or LAN.
A specific stability indicating RP-HPLC method has been developed for estimation of ASP and LAN in presence of their DPs. By adopting a QbD approach for the method, a successful model highlighting the high risk factors and an allowed MODR for a defined CQA’s is obtained. Some of the challenges in method development and optimization which seemed to be unmanageable were successfully overcome by experimental design in a scientific way. The method was successfully validated for linearity, accuracy, precision and robustness. The sample recovery was in good agreement with the respective label claim, which suggested non-interference of formulation additives in its estimation. Hence, the developed stability indicating RP-HPLC method could be successfully applied for estimation of ASP and LAN in bulk and laboratory mixture.
Conflict of interest
Nil.
Financial support and sponsorship
Nil.
References
- Elder DP, Borman P. Improving analytical method reliability across the entire product lifecycle using QbD approaches. Pharm Outsourcing 2013;142:484.
- Schmidt AH, Molnár I. Using an innovative quality-by-design approach for development of a stability indicating UHPLC method for ebastine in the API and pharmaceutical formulations. J Pharm Biomed Anal 2013;78-79:65-74.
- Orlandini S, Pinzauti S, Furlanetto S. Application of quality by design to the development of analytical separation methods. Anal Bioanal Chem 2013;405:443-50.
- Hafeza HM, Elshanawany AA, Abdelaziz LM, Mohama MS. Design of experiment utilization to develop a simple and robust RP-UPLC technique for stability indicating method of ciprofloxacin hydrochloride and metronidazole in tablets. Eurasian J Anal Chem 2015;10:84-105.
- Hubert C, Houari S, Rozet E, Lebrun P, Hubert P. Towards a full integration of optimization and validation phases: An analytical-quality-by-design approach. J Chomatogr A 2015;1395:88-98.
- Panda SS, Beg S, Kumar R, Bera VV, Singh P. Analytical quality-by-design compliant ultrafast liquid chromatographic method for determination of paliperidone in extended release tablet dosage form. J Bioanal Biomed 2015;7:116-23.
- Kalariya PD, Patel P, Srinivas R, Kumar Talluri MVN. Quality by design based development of a selective stability-indicating UPLC method of dolutegravir and characterization of its degradation products by UPLC-QTOF-MS/MS. New J Chem 2015;39:6303-14.
- Zakrajsek J, Stojic V, Bohanec S, Urleb U. Quality by design based optimization of a high performance liquid chromatographic method for assay determination of low concentration preservatives in complex nasal formulation. Acta Chim Slov 2015;62:72-82.
- https://www.takeda.com/news/2014/20140612_6603.html.
- Singh S, Dubey N, Jain DK. Simultaneous estimation of atorvastatin, clopidogrel and in capsule dosage forms using UV-spectroscopy. Asian J Res Chem 2010;3:885-7.
- Ramakrishna G, Nageshwar R, Vasu R. Simultaneous determination of atorvastatin and in human plasma by LC-MS/MS: Its pharmacokinetic application. Sci Pharm 2012;80:923-40.
- Choudhary N, Siddiqui I, Rai J, Singh S, Surabhi S, Gautam H. Simultaneous estimation of lansoprazole and naproxen by using UV spectrophotometer in tablet dosage form. Der Pharma Chemica 2013;5:67-74.
- Sinha PK, Damle MC, Bothara KG. A Validated stability indicating HPTLC method for determination of and clopidogrel bisulphate in combined dosage form. Eurasian J Anal Chem 2009;4:152-60.
- Ramulu K, Rao BM, Rao NS. Identification, isolation and characterization of potential degradation product in lansoprazole drug substance. Rasayan J Chem 2013;6:274-83.
- Katsuki H, Hamada A, Nakamura C, Arimori K, Nakano M. High-performance liquid chromatographic assay for the simultaneous determination of lansoprazole enantiomers and metabolites in human liver microsomes. J Chomatogr B 2001;757:127-33.
- Janardhanan VS. Stability-indicating HPLC method for the simultaneous determination of pantoprazole, rabeprazole, lansoprazole and domperidone from their combination dosage forms. Int J Drug Dev Res 2011;3:323-35.
- Rao PV, NagendraKumar M, Ravikumar M. A Novel validated stability-indicating UPLC method for the estimation of lansoprazole and its impurities in bulk drug and pharmaceutical dosage forms. Sci Pharm 2013;81:183-93.
- Reddy PS, Hotha KK, Sait S. Complexity in estimation of esomeprazole and its related impurities stability in various stress conditions in low-dose and esomeprazole magnesium capsules. Sci Pharm 2013; 81:475-92.
- Patel SM, Patel CN, Patel VB. Stability-indicating HPLC method for simultaneous determination of and prasugrel. Indian J Pharm Sci 2013;75:413-9.
- Sherikar O, Mehta P. Comprehensive assessment of degradation behavior of and atorvastatin singly and in combination by using a validated RP-HPLC method. Sci Pharm 2013;81:195-210.
- http://www.rxlist.com/prevacid-drug.htm.
- Roop KK, Vyas SP, Farhan JA, Gaurav J. The Theory and Practice of Industrial Pharmacy. Special ed. New Delhi: CBS Publishers; 2009.
- ICH Q8 (R2), Harmonised Tripartite Guideline, on Pharmaceutical development. Proceedings of the International Conference on Harmonization; 2009.
- ICH Q9, Harmonised Tripartite Guideline, on Quality Risk Management. Proceedings of the International Conference on Harmonization; 2005.
- ICH Q2 (R1), Harmonised Tripartite Guideline, on Validation of analytical procedure. Proceedings of the International Conference on Harmonization; 2005. Geneva.
- Reddy GM, Mukkanti K, Laxmi Kumar T, Moses Babu J, Reddy PP. Synthesis and characterization of metabolites and potential impurities of lansoprazole, an antiulcerative drug. Synth Commun 2008;38:3477-89.
- Ramulu K, Rao BM, Someswara Rao N. Identification, isolation and characterization of potential degradation product in lansoprazole drug substance. Rasayan J Chem 2013;6:274-83.
- Battu S, Pottabathini V. Hydrolytic degradation study of lansoprazole, identification, isolation and characterization of base degradation product. Am J Anal Chem 2015;6:145-55.
- Reddy PS, Sait S, Hotha KK. Extensive study of and its related impurities under various stressed conditions in low dose and esomeprazole magnesium capsules. Am J Pharm Tech Res 2012;2:847-62.
