- *Corresponding Author:
- Y. Chen
General Surgery, Ningbo No.2 Hospital, Ningbo, Zhejiang Province, China
E-mail: nbeycyj@163.com
| Date of Submission | 22 February 2019 |
| Date of Revision | 29 June 2019 |
| Date of Acceptance | 27 September 2019 |
| Indian J Pharm Sci 2019;81(6):1045-1052 |
This is an open access article distributed under the terms of the Creative Commons Attribution-NonCommercial-ShareAlike 3.0 License, which allows others to remix, tweak, and build upon the work non-commercially, as long as the author is credited and the new creations are licensed under the identical terms
Abstract
Hepatocelluar carcinoma severely affects patients because of high incidence of cancer-mediated deaths. Wnt and hedgehog signaling pathways have been known to be associated with hepatocelluar carcinoma cell proliferation and migration; however, molecular connections between the two pathways are largely unknown. In this investigation the expression levels of key Wnt signaling genes (Wnt3, TCF7, and FZD8) and hedgehog signaling genes (Smo, Gli1, Gli2, and Gli3) were identified to be higher in hepatocelluar carcinoma cell lines (HepG2 and SMMC-7721) than in normal liver cell line (LO2). Western blot results indicated that β-catenin, Smo, and Gli1 levels were all higher in hepatocelluar carcinoma cells than in normal liver cells. In addition, overexpression of β-catenin activated Smo and Gli1 as well as accelerated HepG2 cell migration and proliferation. Further, immunoprecipitation assay showed that β-catenin/TCF4 complex directly bound to Smo and Gli1 promoters. Suppression of β-catenin or Gli1 inhibited HepG2 cell migration and proliferation, and Gli1 silencing inhibited β-catenin overexpression effects on cell migration and proliferation, and silencing of β-catenin inhibited Wnt3a-meidated induction of hedgehog signalling gene expressions, suggesting that β-catenin acts at the upstream of Smo and Gli1. Taken together, these results provided information for direct connection between Wnt and hedgehog signalling via β-catenin/TCF4 complex that broaden the regulatory mechanism for Wnt and hedgehog signalling pathways.
Keywords
TCF4/β-catenin complex, Smo, Gli1, hepatocellular carcinoma
Cancer severely affects the quality of life of humans and results in high incidence of cancer-mediated death. In recent years, around 700 000 patient die of liver cancer, which is the second most cause of death among all the cancers worldwide[1]. As one of the important liver cancers, hepatocelluar carcinoma (HCC) frequently detected in patients worldwide, results in the second largest population death[2]. The mortality of HCC is over 662 000 every year worldwide with very high incidence in the developing countries[3]. Diabetes mellitus, alcohol abuse, obesity, hepatitis B virus and hepatitis C virus infections, autoimmune hepatitis and several metabolic diseases are known to be the risk factors that cause HCC[4]. These important risk factor-induced inflammatory responses further activate necrosis and chromosomal lesions, which subsequently result in tumour cell formation[5]. HCC progression was known to be a multi-step process; however, the exact molecular mechanism for HCC generation remains largely unknown. More recently, comprehensive genomic sequences were analysed for HCC cases to identify a large number of methylations, mutations and expressions of RNA or miRNA are associated with HCC formation[6]. In addition, the signalling pathways including Wnt signalling, IDH1, and VEGFA have been suggested as the potential therapeutic targets with existing inhibitors[6].
Wnt signalling is one of the key cascades that plays important role in the development and stemness of tissues including cancer[7]. Wnt/β-catenin or the β-catenin/T-cell factor (TCF) pathway is the other name of canonical Wnt signalling pathway[8], regulates diverse aspects of biological processes via modulation of its signal[9-11]. Wnt signalling transcription factor β-catenin stabilization in cytosol is the key step of signalling, which activates downstream gene expressions. The stabilization of β-catenin was regulated by glycogen synthase kinase-3β (GSK3β) associated protein complex through phosphorylation[12]. Phosphorylated β-catenin is subsequently degraded by the 26s proteasome in an ubiquitination manner[12,13]. Once signal stimulated by Wnt molecules, GSK3β inactivated and further accumulate β-catenin in cytosol and nucleus. In the nucleus, β-catenin and its interacting partner TCF/lymphoid enhancer binding factor (TCF/LEF) together activate Wnt signaling downstream gene transcription[12]. Immunoprecipitation assay (ChIP)-sequencing based whole genome level analysis identified that TCF/LEF binds core sequences (T/AC/GAAAG) in the downstream gene promoters[14].
Hedgehog (Hh) signalling regulates diverse biological processes including development of invertebrate and vertebrate organisms[15]. Constitutive activation of the Hh signalling pathway has been known to be tightly associated with cancer development and progression in multiple ways[16]. First observation of Hh signalling was in the Drosophila melanogaster embryonic segment where secreted proteins were induced[17]. Sonic Hh, desert Hh, and Indian Hh from mammals regulate patterns and structures of tissues[17]. Furthermore, aberrant activation of Hh signalling is required for almost all basal cell carcinomas, rhabdomyosarcomas and medulloblastomas, also, some Hh signallingactivated tumours were identified[15,18-20]. In normal condition, the transmembrane protein Patched1 (Patch1) and Smoothened (Smo), another transmembrane protein are interacted to keep inactive of Hh signalling. When the sonic Hh secreted which binds Patch1 and inactive it. The binding of Hh molecule and Patch1 resulted in activation of Smo protein[19,21]. Smo subsequently activates GLI-Kruppel family transcription factorsmediated downstream gene expressions to activate Hh signalling[21]. GLI-Kruppel family member 1 (Gli1) was identified its function in modulation of E-cadherin/ β-catenin-controlled cancer cell properties. Gli1 activates a gel-forming mucin, MUC5AC expressions, which in turn inhibit E-cadherin-dependent cell-cell adhesions while activating pancreatic ductal adenocarcinoma cell migration and invasion[14]. Previous studies reported that the inhibitors of Hh signalling pathway suppressed liver cancer cell proliferation and invasion[22]; inhibition of sonic Hh signalling together with histone deacetylase effectively control liver cancer[23]. Activation of Wnt/ β-catenin and macrophage was observed as key steps of liver cancer development[24]. Furthermore, Let7b suppress Frizzled4 to regulate Wnt/β-catenin signalling in liver cancer cells[25].The role of Wnt and Hh signalling pathways and their connections to histopathological heterogeneity in HCC has been reported. This study reported that Wnt and Hh signalling were activated during early stage of HCC[26]. Wnt/β-catenin, notch and Hh signalling activation has been known to be tightly associated with liver cancer. Also, β-catenin as a key Wnt signalling molecule to connect with E-cadherin, which is a key regulator of cancer cell[27]. TGFβ signalling was associated with activation of sonic Hh and Wnt pathway in hepatocellular carcinoma[28]. However, the molecular connections between Wnt and Hh signalling in HCC has not been reported.
Here, the key Wnt and Hh signaling gene expressions was analysed in HCC cell lines and normal liver cell lines. Further, molecular and chemical analyses were performed to examine direct regulation of the key Wnt signaling transcription factors β-catenin/TCF4 complex on activation of Hh signalling molecules Smo and Gli1. β-catenin overexpression or knock-down and Gli1 knock-down cells were used to analyse cell migration and proliferation rates. This study provided useful information for understanding molecular connection between Wnt and Hh signalling in HCC.
Materials and Methods
Cell culture:
Normal liver cell line (LO2) and HCC cell lines (HepG2 and SMMC-7721) were obtained from the Institute of Biochemistry and Cell Biology (Chinese Academy of Sciences, Shanghai, China). Cells were cultivated in a CO2 incubator at 37° in Dulbecco’s modified Eagle medium (GIBCO, USA) supplemented with 10 % fetal bovine serum, 100 μg/ml each of streptomycin and penicillin (Sigma, USA). Wnt3a (100 ng/ml) was treated to normal HepG2 as well as β-catenin supressed HepG2 cells for 24 h and the cells were harvested.
RNA manipulation:
Two micrograms of total RNA extracted from LO2, HepG2, and SMMC-7221 cells were reverse-transcribed using a GoScript reverse transcription kit (Promega) follow the manufacturer’s instructions. Quantitative RT-PCR was performed following procedures described previously and the expression levels of each gene were normalized to GADPH level from the same sample[29]. The primers used for qRT-PCR in this study are listed in Table 1.
| Primer | Sequences |
|---|---|
| Wnt3 F | ATCATAAGGGGCCGCCTGGCGAAGGCTGG |
| Wnt3 R | CTTGCAGGTGTGCACGTCGTAGA |
| TCF7 F | CTGCAGACCCCTGACCTCTCT |
| TCF7 R | ATCCTTGATGCTAGGTTCTGGTGT |
| FZD8 F | CTGGTGGAGATCCAGTGCTC |
| FZD8 R | TTGTAGTCCATGCACAGCGT |
| Smo F | 5’-ACCTATGCCTGGCACACTTC-3’ |
| Smo R | 5’-AGGAAGTAGCCTCCCACGAT-3’ |
| Gli1 F | 5’-CCAGAGTTCAAGAGCCTGG-3’ |
| Gli1 R | 5’-CCTCGCTCCATAAGGCTCAG-3’ |
| Gli2 F | 5’-GTTCCAAGGCCTACTCTCGCCTG-3’ |
| Gli2 R | 5’-CTTGAGCAGTGGAGCACGGACAT-3’ |
| Gli3 F | 5’-GGGTGAACAGCATCAAAATGGAG-3’ |
| Gli3 R | 5’-CCGATAGCCATGTTGGTGG-3’ |
| TCF4 F | 5’-AGAGCGACAAGCCCCAGAC-3’ |
| TCF4 R | 5’-ATTCGCTGCGTCTCCCATC-3’ |
| β-catenin F | 5’-TCGCCAGGATGATCCCAGC-3’ |
| β-catenin R | 5’-GCCCATCCATGAGGTCCTG-3’ |
| GAPDH F | 5’-GACCTGCCGTCTAGAAAAAC-3’ |
| GAPDH R | 5’-CTGTAGCCAAATTCGTTGTC-3’ |
| Smo F1 F | 5’-CGTTGAGGGAGACTTGCTTA-3’ |
| Smo F1 R | 5’-CTTGGATGAATACCTGTGGC3-3’ |
| Smo F2 F | 5’-CTCTGAGTGACTCCGAGGTTAT-3’ |
| Smo F2 R | 5’-TAGTTGGTCCTAAGGTTGTTTG-3’ |
| Gli1 F3 F | 5’-TGAAGTCTTATTCCCTCCCAC-3’ |
| Gli1 F3 R | 5’-TCCCTCTACCATTTCTTGTTCT-3’ |
Table 1: Primer Sequences
Overexpression and RNA interferences:
Open reading frame regions of TCF4 (NM_013685.2, NCBI) and β-catenin (NM_001165902.1, NCBI) were synthesized from the Sangon corporation (Shanghai, China). The overexpression of TCF4 and β-catenin was via expressing vector pcDNA3.1(+). siRNA for β-catenin (ON-TARGET plus SMART pool, L-004018), siRNA for Gli1 (ON-TARGET plus SMART pool, J-041026-05) and siRNA (ON-TARGETplus si CONTROL non-targeting pool, D-001810) were purchased from Dharmacon RNA Technologies (Chicago, USA). The HepG2 cells were cultured and transformation of overexpression or siRNA constructs once the cell density reached 30-50 % confluence. After 12 h of transfection, of 30 nM of the siRNA duplex, 2 μg of TCF4 overexpression or β-catenin overexpression plasmids via lipofectamine 2000 (Invitrogen) and Opti- MEM®I reduced serum medium (Gibco) according to the instruction of the manufacturers, RNA was extracted for analysis or cell migration and proliferation rate were analysed.
Western blot analysis:
Protein from LO2, HepG2, and SMMC-7221 cells was extracted using a lysis buffer (7 M urea, 2 M thiourea, 2 % CHAPS, 40 mM Trizma base, 40 mM dithiothreitol , 1 % protease inhibitor) in cold condition. Subsequently, the cell lysates were centrifuged at 15 000×g for 10 min. Total protein concentration was measured using Bradford protein assay kit (Bio-Rad, Richmond, CA, USA). The protein (20 μg) from each sample was electrophoresed on a SDS-PAGE and further transferred to the immobilon-P transfer membranes (Millipore, Tokyo, Japan). After the transfer, the membrane was incubated in a blocking solution containing 1× TBS, 5 % skim milk and 0.05 % Tween-20 for 1 h before blotting with the primary antibodies at 25° for 2 h. The following primary antibodies were used; antiSmo antibody (1:1000, Abcam, ab72130), antiβ-catenin antibody (1:2000, Abcam, ab16051), antiGli1 antibody (1:2000, Abcam, ab49314), and antiGAPDH (Abcam, ab8245). The membranes were washed twice with 1X PBS and incubated with an antimouse or antirabbit HRP-linked secondary antibody (1:2000, Cell Signaling Technology) for 1 h.
Cell proliferation assay:
Cell proliferation rate of HepG2 was analysed using CCK-8 Kit (Dojindo Bio., Japan) following manufacture’s instruction. Cell proliferation rates of β-catenin overexpression, β-catenin and Gli1 siRNAs or β-catenin overexpression in Gli1 siRNA infected cells were compared to control group was previous described[21].
Cell migration assay:
The migration of HepG2 cells were analysed by the scratch assay. HepG2 cells with treatments were seeded in 6-well plates and cell layers were scratched by a sterile 20 μl pipette tip. After 24 and 48 h of wounding, 5 fields were randomly selected and photographed for calculated migrating distance.
Statistical analysis:
Significant differences between groups were calculated via Prism 5 (GraphPad, San Diego, CA). Statistical differences between groups were analyzed by oneway ANOVA, followed by Bonferroni’s multiple comparison tests and p values lower than at least 0.05 were considered as significant.
Results and Discussion
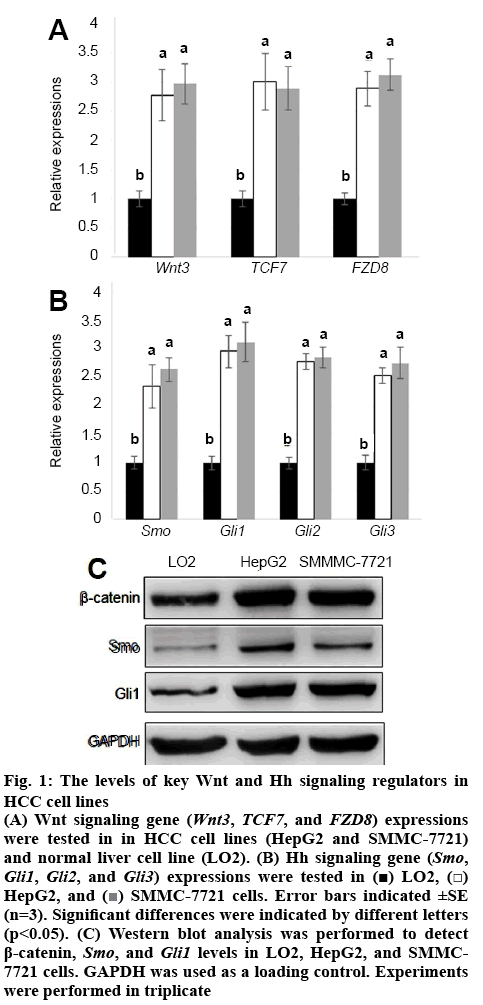
Wnt and Hh signalling was known to play important roles in HCC cell proliferation[26]. To analyse the detailed function of Wnt and Hh signalling in HCC cells, first, the expression levels of key genes in these 2 pathways were analysed. Wnt signalling genes (Wnt3, TCF7, and FZD8) and Hh signalling genes, Smo, Gli1, Gli2 and Gli3 were collected and their expression levels were tested in LO2 and HepG2 and SMMC-7721 cell lines. The qRT-PCR results showed that levels of Wnt signalling genes Wnt3, TCF7 and FZD8 were all higher in HepG2 and SMMC-7721 than in LO2 cells (figure 1A). Also, Hh signalling gens Smo, Gli1, Gli2, and Gli3 were activated in HepG2 and SMMC-7721 than in LO2 cells (figure 1B). Further, the protein levels of key Wnt signaling regulator β-catenin and Hh signalling regulator Smo and Gli1 were analysed using western blot analysis. Similar with qRT-PCR results, the protein levels of β-catenin, Smo, and Gli1 all were higher in HepG2 and SMMC-7721 cell lines than in LO2 cell line (figure 1C).
Figure 1:The levels of key Wnt and Hh signaling regulators in HCC cell lines
(A) Wnt signaling gene (Wnt3, TCF7, and FZD8) expressions were tested in in HCC cell lines (HepG2 and SMMC-7721) and normal liver cell line (LO2). (B) Hh signaling gene (Smo, Gli1, Gli2, and Gli3) expressions were tested in  LO2,
LO2,  HepG2, and
  SMMC-7721 cells. Error bars indicated ±SE (n=3). Significant differences were indicated by different letters (p<0.05). (C) Western blot analysis was performed to detect β-catenin, Smo, and Gli1 levels in LO2, HepG2, and SMMC-7721 cells. GAPDH was used as a loading control. Experiments were performed in triplicate
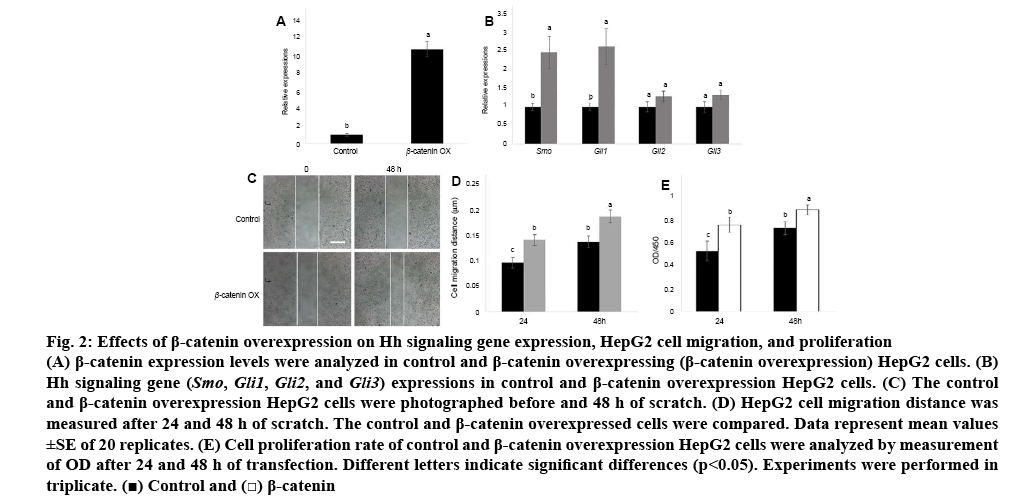
Since Wnt and Hh signalling genes were activated in HCC cells than in normal liver cells, the relationship between Wnt and Hh signalling was further examined. β-catenin was transiently overexpressed in HCC cells and the expression level of β-catenin was analysed. The qRT-PCR data indicated that β-catenin was highly expressed in HepG2 cells than in normal liver cells (figure 2A). Next, two Hh signalling genes Smo and Gli1 expression levels were analysed in β-catenin overexpressing cells. The results indicated that Smo and Gli1 were activated by overexpression of β-catenin (figure 2B).
Figure 2: Effects of β-catenin overexpression on Hh signaling gene expression, HepG2 cell migration, and proliferation
(A) β-catenin expression levels were analyzed in control and β-catenin overexpressing (β-catenin overexpression) HepG2 cells. (B) Hh signaling gene (Smo, Gli1, Gli2, and Gli3) expressions in control and β-catenin overexpression HepG2 cells. (C) The control and β-catenin overexpression HepG2 cells were photographed before and 48 h of scratch. (D) HepG2 cell migration distance was measured after 24 and 48 h of scratch. The control and β-catenin overexpressed cells were compared. Data represent mean values ±SE of 20 replicates. (E) Cell proliferation rate of control and β-catenin overexpression HepG2 cells were analyzed by measurement of OD after 24 and 48 h of transfection. Different letters indicate significant differences (p<0.05). Experiments were performed in triplicate.  Control and
  β-catenin
β-catenin level was higher in HCC cells than in normal liver cells; therefore, the function of β-catenin in HCC cells was further examined. Migration and proliferation were examined in HepG2 cells and β-catenin overexpressed HepG2 cells. Compared to HepG2 cells, β-catenin overexpressed cells promoted migration speed after 24 and 48 h of wounding (figures 2C, D). In addition, HepG2 cell proliferation was examined. Similar to migration results, cell proliferation rates were activated by overexpression of β-catenin in HepG2 cells (figure 2E).
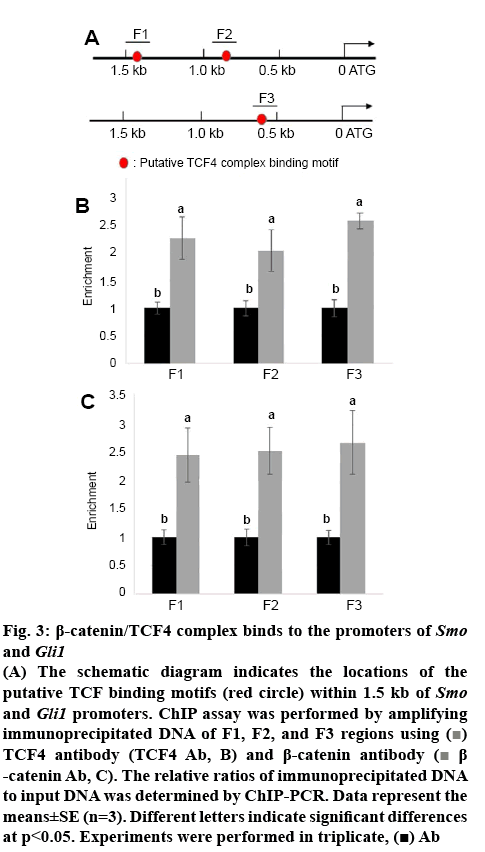
Smo and Gli1 are activated by overexpression of β-catenin; therefore, the possibility of direct regulation of Smo and Gli1 by β-catenin/TCF4 tested. Sequences of Smo and Gli1 promoters were further analysed and identified that two and one putative TCF/LEF binding motifs (AGAAAG)[14], occurred within 1.5 kb region of Smo and Gli1 promoter fragments, respectively (figure 3A). To test whether β-catenin/TCF4 directly binds to the putative motifs within Smo and Gli1 promoters, ChIP assays were performed using either antiTCF4 or β-catenin antibody and IgG was used as the antibody control for precipitation. The immunoprecipitated DNA fragments were amplified by the primer pairs priming F1, F2, and F3 regions in the Smo and Gli1 promoters and the levels of F, F2, and F3 amplified from input DNA was used as the control to normalize the data. ChIP-PCR results indicated that β-catenin and TCF4 directly bound to F1, F2, and F3 fragments (figures 3B, C).
Figure 3: β-catenin/TCF4 complex binds to the promoters of Smo and Gli1
(A) The schematic diagram indicates the locations of the putative TCF binding motifs (red circle) within 1.5 kb of Smo and Gli1 promoters. ChIP assay was performed by amplifying immunoprecipitated DNA of F1, F2, and F3 regions using  TCF4 antibody (TCF4 Ab, B) and β-catenin antibody (
 β-catenin Ab, C). The relative ratios of immunoprecipitated DNA to input DNA was determined by ChIP-PCR. Data represent the means±SE (n=3). Different letters indicate significant differences at p<0.05. Experiments were performed in triplicate,
  Ab
Ab
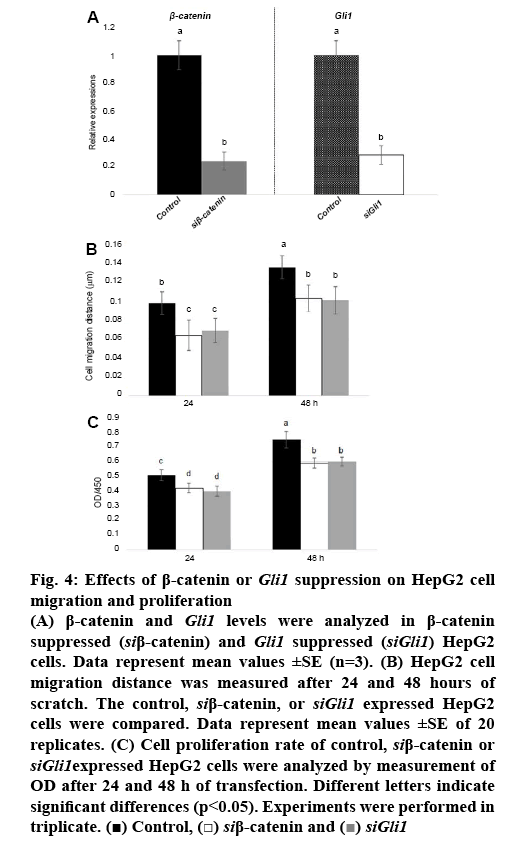
Since β-catenin directly activates transcription of Smo and Gli1, and overexpression of β-catenin activates cell migration and proliferation, it was further analysed whether β-catenin or Gli1 inhibited cell migration and proliferation. Gene specific siRNA for β-catenin or Gli1 as well as scramble control RNA were transformed into HepG2 cells. The expression analysis showed that siRNA suppressed β-catenin or Gli1 compared to control (figure 4A). Further, cell migration was examined in control and β-catenin or Gli1 suppressed HepG2 cells. The results showed that β-catenin or Gli1 suppression inhibited cell migration speed (figure 4B). Also, proliferation of HepG2 cells was inhibited by suppression of β-catenin or Gli1 (figure 4C).
Figure 4: Effects of β-catenin or Gli1 suppression on HepG2 cell migration and proliferation
(A) β-catenin and Gli1 levels were analyzed in β-catenin suppressed (siβ-catenin) and Gli1 suppressed (siGli1) HepG2 cells. Data represent mean values ±SE (n=3). (B) HepG2 cell migration distance was measured after 24 and 48 hours of scratch. The control, siβ-catenin, or siGli1 expressed HepG2 cells were compared. Data represent mean values ±SE of 20 replicates. (C) Cell proliferation rate of control, siβ-catenin or siGli1expressed HepG2 cells were analyzed by measurement of OD after 24 and 48 h of transfection. Different letters indicate significant differences (p<0.05). Experiments were performed in triplicate.  Control,
  siβ-catenin and
  siGli1
Further, it was analysed to find out whether β-catenin overexpression-induced promotion of cell migration and proliferation via activation of Hh signalling. To address this question, β-catenin was overexpressed in Gli1 siRNA transfected HepG2 cells. The qRT-PCR results showed that transfection of either Gli1 siRNA alone or Gli1 siRNA together with β-catenin overexpression all significantly repressed Gli1 expression. Also, β-catenin level was significantly higher in the cells transfected either β-catenin overexpression alone or Gli1 siRNA together with β-catenin overexpression compared to control. Further, migration and proliferation of HepG2 cells with each transfection was analysed. Gli1 suppressed cells showed delay of cell migration while β-catenin overexpression accelerated cell migration, but β-catenin overexpression did not accelerate cell migration when Gli1 was suppressed. Gli1 suppression inhibited cell proliferation while β-catenin overexpression activated cell proliferation rate. Also, Gli1 suppression inhibited β-catenin overexpression -induced activation of cell proliferation.
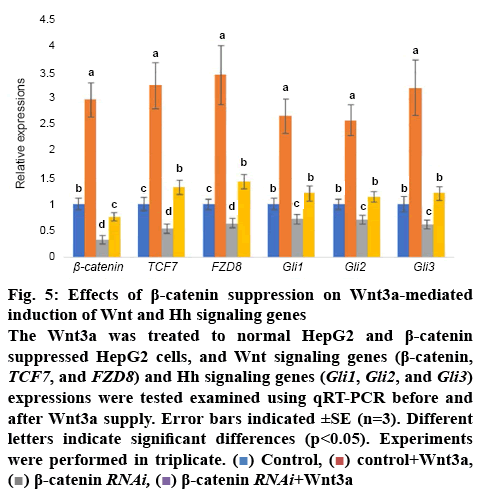
To further evaluate relationship between Wnt and Hh signalling, the Wnt3a was treated to HCC cells. The results showed that Wnt3a treatment significantly induced β-catenin, TCF7, and FZD8) and Hh signalling genes (Gli1, Gli2, and Gli3) expressions. However, the Wnt3a-mediated induction was suppressed in β-catenin inhibited HCC cells (figure 5).
Figure 5: Effects of β-catenin suppression on Wnt3a-mediated induction of Wnt and Hh signaling genes
The Wnt3a was treated to normal HepG2 and β-catenin suppressed HepG2 cells, and Wnt signaling genes (β-catenin, TCF7, and FZD8) and Hh signaling genes (Gli1, Gli2, and Gli3) expressions were tested examined using qRT-PCR before and after Wnt3a supply. Error bars indicated ±SE (n=3). Different letters indicate significant differences (p<0.05). Experiments were performed in triplicate.  Control,
  control+Wnt3a,
  β-catenin RNAi,
  β-catenin RNAi+Wnt3a
Cancer is caused by the abnormal cell growth that may be able to invade other tissues and spread overall the body. Liver cancer is one of the important cancers which cause the second highest number of its related death[2]. HCC is one of the most frequently diagnosed liver cancer, has been known to be associated diverse factors[30]. Previous studies showed that the PI3K/AKT pathway is altered in HCC tumour development[31]; murine double minute 2 homolog (MDM2) and mechanistic target of rapamycin (mTOR) are the downstream regulators of PI3K/AKT pathway, and MDM2 overexpression regulates p53 commonly in cancer[32]; and MDM2 and mTOR are highly expressed in tumour than in adjacent tissues, and plays important roles in HCC development[33]. Recently, microRNAs have been identified that they serve as signalling modulators in development of cancer, and play key roles in HCC cell progression[34]. Previous studies indicated that Wnt and Hh signalling plays key role during liver cancer cell development, migration, proliferation, and metastasis[22-28]. However, the molecular relationship between Wnt and Hh signalling in HCC to control cancer cell activity remains unclear.
In this study, HCC cell lines (HepG2 and SMMC-7721) and normal liver cell line (LO2) were used to investigated the roles of Wnt and Hh signalling in HCC migration and proliferation. First, the key Wnt and Hh signalling genes, Wnt3, TCF7 and FZD8 for Wnt and Smo, Gli1, Gli2, and Gli3 for Hh were chosen for evaluating their expression levels in HCC or normal liver cell lines. Both the signalling genes were significantly overexpressed in HCC cell lines compared to normal liver cell line. In addition, β-catenin, Smo, and Gli1 protein levels were also dramatically higher in HCC cell lines than in normal liver cell line. These data indicated that the Wnt and Hh signalling were activated in HCC. To further investigate the meaning of activation of Wnt signalling in HCC cells, β-catenin, a master transcription factor of Wnt signalling, was overexpressed in one of the HCC cells HepG2. Subsequent experiments using β-catenin overexpressed cells revealed that HepG2 cell migration and proliferation rates were increased by overexpression of β-catenin. In addition, suppression of β-catenin or Gli1 by gene specific siRNAs significantly inhibited HepG2 cell migration and proliferation, suggesting Wnt and Hh signalling may play a positive role in HCC progression.
Further, interestingly, β-catenin overexpression induced two key Hh signalling genes Smo and Gli1 expressions in HepG2 cells. β-catenin is a transcription factor, which interact with TCF4 to regulate downstream gene expressions. Genome-wide targets screening of TCF/LEF via ChIP-sequencing identified that T/A C/GAAAG are the core sequences which recognized by TCF transcriptional complex[14]. Based on these results, the question raised is whether β-catenin/ TCF4 transcriptional complex binds to Smo and Gli1 promoters. Interestingly, promoter sequence analysis revealed that the T/A C/GAAAG motifs are occurred in their promoters. ChIP assay using β-catenin or TCF4 antibodies confirmed that the transcriptional complex including β-catenin and TCF4 directly bound to the Smo and Gli1 promoter regions to actives their transcriptions.
To further dissect molecular connection between Wnt and Hh signalling and its role during liver cancer cell migration and proliferation, β-catenin and Gli1 were overexpressed or suppressed by siRNAs. β-catenin overexpression activated while β-catenin suppression inhibited HepG2 cell migration and proliferation. Also, Gli1 suppression showed similar effect with β-catenin suppressed cells that inhibited HepG2 cell migration and proliferation. Since β-catenin containing transcriptional complex directly activates Smo and Gli1 promoters, the hypothesis raised is whether β-catenin action on HepG2 cell migration is via control of Gli1, which is downstream regulator of Smo in Hh signalling. To answer this question, β-catenin overexpressed in Gli1 suppressed HepG2 cells. Gli1 siRNA infection inhibited β-catenin overexpression -mediated induction of Gli1, and the cell migration and proliferation was also lower than in β-catenin overexpression cells. In addition, treatment of Wnt3a, the inducer of Wnt signalling activated expression of Wnt signalling genes including β-catenin, TCF7, and FZD8 and the key Hh signalling genes Gli1, Gli2, and Gli3. Since β-catenin positively regulated Hh gene expressions, the Wnt3a further treated to β-catenin suppressed HepG2 cells. The data indicated that Wnt3a-mediated induction of Hh signalling genes in HepG2 was inhibited by suppression of β-catenin. These results suggest that Wnt signalling might be via β-catenin to partially regulate the expression of Hh signalling molecules e.g. Smo and Gli1 to control HCC cell migration and proliferation. These results are Hh signalling molecules Smo and Gli1 are the targets of Wnt signalling transcription factor β-catenin, and this signalling path is important for regulation of HCC cell migration and proliferation. Further experiments using tumor tissue implanting assay will be more interesting and clearly dissect their roles during HCC invasion and progression; however, our analyses provided molecular connections between Wnt and Hh signalling in HCC and will be important for cancer therapy in the future.
References
- Ferlay JSI, Dikshit R, Eser S, Mathers C, Rebelo M, Parkin DM, et al. Cancer incidence and mortality worldwide: sources, methods and major patterns in GLOBOCAN 2012. Int J Cancer 2015;136:E359-86.
- Islami F, Miller KD, Siegel RL, Fedewa SA, Ward EM, Jemal A. Disparities in liver cancer occurrence in the United States by race/ethnicity and state. CA Cancer J Clin 2017;67(4):273-89.
- Mazzanti R, Arena U, Tassi R. Hepatocellular carcinoma: Where are we? World J Exp Med 2016;6(1):21-36.
- Yang JD, Roberts LR. Hepatocellular carcinoma: A global view. Nat Rev Gastroenterol Hepatol 2010;7(8):448-58.
- Karagozian R DZ, Baffy G. Obesity-associated mechanisms of hepatocarcinogenesis. Metabolism 2014;63:607-17.
- Cancer Genome Atlas Research Network. Comprehensive and Integrative Genomic Characterization of Hepatocellular Carcinoma. Cell 2017;169(7):1327-41 e23.
- Zhan T, Rindtorff N, Boutros M. Wnt signaling in cancer. Oncogene 2017;36(11):1461-73.
- Shtutman M, Zhurinsky J, Simcha I, Albanese C, D'Amico M, Pestell R, et al. The cyclin D1 gene is a target of the beta-catenin/LEF-1 pathway. Proc Nat Acad Scie USA 1999;96(10):5522-7.
- Moon RT, Kohn AD, De Ferrari GV, Kaykas A. WNT and β-catenin signaling: diseases and therapies. Nat Rev Gen 2004;5(9):691-701.
- Clevers H. Wnt/β-catenin signaling in development and disease. Cell 2006;127(3):469-80.
- Brack AS, Conboy MJ, Roy S, Lee M, Kuo CJ, Keller C, et al. Increased Wnt signalling during aging alters muscle stem cell fate and increases fibrosis. Science 2007;317(5839):807-10.
- Gordon MD, Nusse R. Wnt signalling: multiple pathways, multiple receptors, and multiple transcription factors. J Biolo Chem 2006;281(32):22429-33.
- Aberle H, Bauer A, Stappert J, Kispert A, Kemler R. beta-catenin is a target for the ubiquitin-proteasome pathway. EMBO J 1997;16(13):3797-804.
- Schuijers J, Mokry M, Hatzis P, Cuppen E, Clevers H. Wnt-induced transcriptional activation is exclusively mediated by TCF/LEF. EMBO J 2014;33(2):146-56.
- Bushman W. Hedgehog Signaling in Development and Cancer. Prostate Cancer: Berlin, Germany: Springer; 2007. p. 107-18.
- Xin M, Ji X, De La Cruz LK, Thareja S, Wang B. Strategies to target the Hedgehog signaling pathway for cancer therapy. Med Res Rev 2018;38(3):870-913.
- Taipale J, Beachy PA. The Hedgehog and Wnt signalling pathways in cancer. Nature 2001;411(6835):349-54.
- Beauchamp EM, Ringer L, Bulut G, Sajwan KP, Hall MD, Lee Y-C, et al. Arsenic trioxide inhibits human cancer cell growth and tumor development in mice by blocking Hedgehog/GLI pathway. J Clin Investig 2011;121(1):148.
- Wang K, Pan L, Che X, Cui D, Li C. Sonic Hedgehog/GLI1 signaling pathway inhibition restricts cell migration and invasion in human gliomas. Neurol Res 2010;32(9):975-80.
- Huangfu D, Anderson KV. Signaling from Smo to Ci/Gli: conservation and divergence of Hedgehog pathways from Drosophila to vertebrates. Development 2006;133(1):3-14.
- Rohatgi R, Milenkovic L, Scott MP. Patched1 regulates hedgehog signaling at the primary cilium. Science 2007;317(5836):372-6.
- Sheng X, Sun X, Sun K, Sui H, Qin J, Li Q. Inhibitory effect of bufalin combined with Hedgehog signaling pathway inhibitors on proliferation and invasion and metastasis of liver cancer cells. Int J Oncol 2016;49(4):1513-24.
- Li J, Cai H, Li H, Liu Y, Wang Y, Shi Y, et al. Combined inhibition of sonic Hedgehog signaling and histone deacetylase is an effective treatment for liver cancer. Oncol Rep 2019;41(3):1991-7.
- Debebe A, Medina V, Chen CY, Mahajan IM, Jia C, Fu D, et al. Wnt/beta-catenin activation and macrophage induction during liver cancer development following steatosis. Oncogene 2017;36(43):6020-9.
- Cai H, Chen Y, Yang X, Ma S, Wang Q, Zhang Y, et al. Let7b modulates the Wnt/beta-catenin pathway in liver cancer cells via downregulated Frizzled4. Tumour Biol 2017;39(7):1010428317716076.
- Tripathy A, Thakurela S, Sahu MK, Uthanasingh K, Behera M, Ajay AK, et al. The molecular connection of histopathological heterogeneity in hepatocellular carcinoma: A role of Wnt and Hedgehog signaling pathways. PloS One 2018;13(12):e0208194.
- Giakoustidis A, Giakoustidis D, Mudan S, Sklavos A, Williams R. Molecular signalling in hepatocellular carcinoma: Role of and crosstalk among WNT/ss-catenin, Sonic Hedgehog, Notch and Dickkopf-1. Can J Gastroenterol Hepatol 2015;29(4):209-17.
- Steinway SN, Zanudo JG, Ding W, Rountree CB, Feith DJ, Loughran TP Jr, et al. Network modeling of TGFbeta signaling in hepatocellular carcinoma epithelial-to-mesenchymal transition reveals joint sonic hedgehog and Wnt pathway activation. Cancer Res 2014;74(21):5963-77.
- Zittermann SI, Issekutz AC. Basic fibroblast growth factor (bFGF, FGF-2) potentiates leukocyte recruitment to inflammation by enhancing endothelial adhesion molecule expression. Am J Pathol 2006;168(3):835-46.
- Merle CT. Molecular mechanisms underlying hepatocellular carcinoma. Viruses 2009;1(3):852-72.
- Lachenmayer A, Alsinet C, Chang CY, Llovet JM. Molecular approaches to treatment of hepatocellular carcinoma. Dig Liver Dis 2010;42 Suppl 3:S264-72.
- Wade M, Li YC, Wahl GM. MDM2, MDMX and p53 in oncogenesis and cancer therapy. Nature reviews Cancer 2013;13(2):83-96.
- Populo H, Lopes JM, Soares P. The mTOR signalling pathway in human cancer. Int J Mol Sci 2012;13(2):1886-918.
- Xie KL, Zhang YG, Liu J, Zeng Y, Wu H. MicroRNAs associated with HBV infection and HBV-related HCC. Theranostics 2014;4(12):1176-92.
