- *Corresponding Author:
- Sumera Latif
Institute of Pharmacy, Lahore College for Women University, Lahore, Pakistan
E-mail: sumera_latif@hotmail.com
| Date of Submission | 02 February 2019 |
| Date of Revision | 22 April 2019 |
| Date of Acceptance | 28 July 2019 |
| Indian J Pharm Sci 2019;81(5):843-850 |
This is an open access article distributed under the terms of the Creative Commons Attribution-NonCommercial-ShareAlike 3.0 License, which allows others to remix, tweak, and build upon the work non-commercially, as long as the author is credited and the new creations are licensed under the identical terms
Abstract
The preparation of microspheres by emulsion solvent evaporation technique has become an area of considerable attention in pharmaceutical industry. In the present study, investigation reports the formulation of microspheres of levofloxacin using ethyl cellulose and Eudragit L100 in order to mask the bitter taste of drug. Ten microsphere formulations F1 to F10 were fabricated by varying the ratio of polymers at different stirring speed (700-850 rpm). Particle size, shape, flow properties, encapsulation efficiency and in vitro release profile of the prepared microspheres were studied. Fourier-transform infrared spectroscopy and differential scanning calorimetry showed no significant drug polymer interaction. Kinetic modeling results demonstrated that release data was best fit to Korsmeyer-Peppas model suggesting non-Fickian behavior. Taste masking was evaluated using a five-point scale of taste evaluation. Taste of the drug was significantly concealed (p<0.05). F3 showed excellent taste concealing and considered as the most palatable formulation. In conclusion, formulated microparticles of levofloxacin could increase patient compliance and palatability.
Keywords
Levofloxacin; microspheres, emulsion solvent evaporation, SEM, FTIR, DSC, taste masking
Taste is the most significant factor prevailing patient acquiescence. Taste concealing is vital for bitter drugs for enhancing patient compliance mainly in paediatrics and geriatrics[1]. A number of techniques have been established for improvement of taste such as spray coating, granulation, inclusion complexation, mass extrusion, use of ion exchange resin, solid dispersions, fluidized bed coating, microencapsulation, liposomes, multiple emulsion and gel formation techniques[2].
Microencapsulation is one of the most successful techniques for masking the obnoxious taste of drugs. Microencapsulation includes different approaches like centrifugal extrusion, air suspension coating, pan-coating, spray drying, solvent evaporation, spray congealing, emulsion solvent diffusion, polymerization and coacervation phase separation. The most suitable method for preparation of microspheres is solvent evaporation technique because of its obvious advantages. This procedure is easier to carry out in laboratory circumstances under ordinary conditions of temperature thus also suitable for thermolabile substances[3]. This method produces a stable emulsion without disturbing drug effectiveness[4]. Moreover, control of particle size is easier as compared to other techniques[5].
Microspheres are highly suited for sustained drug delivery systems. Their importance lies in the fact that microspheres widely spread in the gastrointestinal tract and thus minimize damage to the GI mucosa by inhibiting localized accumulation of drugs. Low amounts of drugs can be delivered for diagnostic or therapeutic purposes enclosed within a polymeric structure for oral and IV drug administration and the residence time of the drug at the target site can be prolonged[6,7].
Levofloxacin (LFX) was selected as a model drug because of its bitter taste and its use in wide range of infections. LFX also necessitates recurrent dosing to sustain therapeutic effect due to its short biological half-life (6-8 h) and varying plasma concentration. Sustained release formulation of LFX can assist retaining effective drug concentration, lessen dosing times, improve conformity and thus optimize drug therapy. To surmount non-conformity due to its astringent taste, it becomes necessary to manage drug in controlled dosage form like microspheres[8].
Ethyl cellulose (EC) is advantageous because of its hydrophobic nature[9]. Eudragit L 100 (EL100) was used because of greater swellability as compared to EC[10]. Dichloromethane (DCM) is the most common solvent for the encapsulation using solvent evaporation technique because of its high volatility, low boiling point and high immiscibility with water. Also, DCM produces microspheres with spherical and more uniform shape[11].
Currently, LFX taste is concealed by film coating technique. But this technique has some disadvantages including high installation and energy costs and requiring more efficient drying procedures. Keeping in view these drawbacks, the present study was aimed to mask the LFX bitter taste by solvent evaporation method using EC and EL100 as taste masking agents. The blend of these two polymers has not previously been used for the formation of palatable LFX microparticles. Prepared microspheres were characterized using Fourier-transform infrared spectroscopy (FTIR), differential scanning calorimetry (DSC) and scanning electron microscopy (SEM) and also evaluated for various micromeritic properties, in vitro dissolution profile and taste concealing.
Materials and Methods
LFX and EL100 were provided as gift samples by Jawa Pharmaceuticals, Lahore, Pakistan. EC, methanol and Tween-80 were obtained as a gift from CCL Laboratories, Lahore, Pakistan. All chemicals used were of analytical grade.
Preparation of LFX-loaded microspheres:
LFX-loaded microspheres were prepared using EC and EL100 alone and in combination by emulsion solvent evaporation method. Different amounts of EC and EL100 (Table 1) were dissolved in 100 ml of 1:1 mixture of methanol and DCM with continuous stirring at room temperature. LFX was then added to above solution. Mixture was stirred for 15-20 min on a magnetic stirrer to form a homogenous mixture. This solution was transferred into beaker containing 100 ml water and 0.05 % Tween 80 (emulsifying agent) with constant stirring on a Silverson mixer at 650 rpm for half an hour. The mixture was agitated further for 2.5 h at 750-800 rpm. The formulated microspheres were filtered by Whatman filter paper no.1. Solvents were allowed to evaporate at room temperature. The collected microspheres were dried under shade for 24 h. The dried microspheres were evaluated for different tests[12].
| Formulation | Levofloxacin (mg) | Eudragit L 100 (mg) | Ethyl cellulose (mg) | Drug:polymer ratio |
|---|---|---|---|---|
| F1 F2 F3 F4 F5 F6 F7 F8 F9 F10 |
100 100 100 100 100 100 100 100 100 100 |
0 100 100 200 300 400 500 600 700 800 |
100 0 100 200 300 400 500 600 700 800 |
1:1 1:1 1:2 1:4 1:6 1:8 1:10 1:12 1:14 1:16 |
Table 1: Composition of the various LFX microspheres
Characterization of microspheres and particle size analysis:
Prepared microspheres were evaluated by different characterization tools such as particle size, entrapment efficiency, percent yield and drug loading. Structure analysis was performed using FTIR, DSC and SEM. Particle size was measured using sieve analysis technique and the average particle size was determined from the Eqn.[13], average size (μm) = cumulative percent weight retained/100.
Drug entrapment efficiency:
Microspheres (50 mg) were crushed for determination of drug entrapment and extracted with aliquots (30 ml) of 0.1 N HCl. The extract was transferred to a 100 ml volumetric flask and the volume was made up using 0.1 N HCl. The solution was filtered and after suitable dilution, the absorbance was measured using a spectrophotometer at 292 nm against 0.1 N HCl as blank[14]. Drug entrapment efficiency of microspheres was calculated from the calibration curve generated for LFX over a concentration range of 1-10 μg/ml in 0.1 N HCl. Percent yield of microspheres was determined using following formula[15]: percent yield = practical yield/theoretical yield×100.
Scanning electron microscopy (SEM):
The SEM (JSM 6480 S-Jeol Japan) was used to evaluate surface morphology and to verify size of prepared microspheres. Microspheres were mounted on double sided sticking tape fixed on platinum stubs and scanned with a focused electron beam. Secondary electrons discharged from the samples were detected and the SEM image was formed at resolution power of 10-100 000 times[16].
Fourier-transform infrared spectroscopy (FTIR):
FTIR was used for confirmation of possible interactions of drug and polymers. IR spectra of LFX, EC, EL100 and formulated microspheres were obtained on FTIR spectrophotometer (Alpha-P Bruker Germany) by using attenuated total reflection (ATR) crystal across 4000-400 cm-1.
Differential scanning calorimetry (DSC):
DSC provides information in relevance to the physical characteristics of the sample as crystalline or amorphous, reveals compatibility between drug and polymers in formulations and entrapment of drug in the polymers[17]. DSC of LFX, polymers and microspheres were performed on TA instrument (model Q 600, USA). Samples (2-5 mg) were accurately weighed, sealed in an aluminum pan and heated at constant rate of 10°/min under a nitrogen purge (100 ml/min).
Bulk density and tapped density:
Microspheres (5 g) were accurately weighed (w) and placed into a measuring cylinder. Volume occupied (v) was noted without upsetting the cylinder and bulk density (ρb) was calculated using the following Eqn.[18], ρb = m/v. The sample present in the measuring cylinder was tapped 100 times. The final volume (vo) after tapping was recorded and the tapped density (ρt) was calculated using the following Eqn.[19], ρt = m/vo.
Flow properties:
Prediction of flowability was done by determination of Hausner ratio, angle of repose and Carr’s index. A higher Hausner ratio is a sign of greater cohesion between particles, while a high Carr’s index is indicative of the tendency to form bridges[18]. Hausner ratio of microparticles was determined by comparing tapped density to the bulk density using the Eqn.[20], Hausner Ratio = ρt / ρb. Carr’s index was calculated according to the Eqn.[21], Carr’s index = (ρt–ρb)/ρt. Microspheres (1 g) were transferred into funnel, which was placed 10 cm above the surface of a plain paper. Microspheres were allowed to flow freely until the funnel became vacant and displaced mass per time (g/s) was calculated[22].
Angle of repose:
Fixed funnel standing method was used to determine angle of repose of prepared microspheres. The microspheres (1 g) were allowed to flow through funnel hole on a plain paper kept on the horizontal surface to form a stack of microspheres. Angle of repose was calculated by putting the values of radius (r) and height of the heap (h) in the following Eqn.[23], tan θ= h/r.
Drug content analysis:
A stock solution containing 1 mg/ml of pure drug was prepared by dissolving 100 mg of LFX in 100 ml 0.1 N HCl (pH 1.2) using a volumetric flask. The standard stock solution was further diluted to obtain a working standard solution of 100 μg/ml. Working standard solution was then diluted with 0.1 N HCl to obtain a series of solutions with the concentration range of 1-10 μg/ml. A calibration curve for LFX was prepared by measuring the absorbance at the λmax of 292 nm. For drug content analysis, microspheres were accurately weighed (10 mg) and dissolved in 0.1 N HCl to give final concentration of 10 μg/ml. The drug content was calculated from the calibration curve.
In vitro drug release studies:
In vitro drug release studies were conducted using USP (type II) dissolution apparatus with 900 ml of dissolution medium maintained at 37±1° for 10 h at 100 rpm. 0.1 N HCl (pH 1.2) was used as a dissolution medium for first 2 h and then dissolution was continued in 900 ml phosphate buffer pH 6.8 for next 8 h[24]. Samples (5 ml) were withdrawn at 1, 2, 3, 4, 5, 6, 7, 8, 9 and 10 h intervals and analysed by spectrophotometer at 292 nm for first 2 h and 286 nm for next 8 h. Dissolution medium was replaced throughout the study to maintain the sink conditions. In vitro drug release data was also fitted to different kinetic models to predict in vitro performance of formulations such as zero order, first order, Higuchi, Korsmeyer-Peppas and Hixon-Crowell model using DD solver[25].
Taste evaluation studies:
For determination of threshold concentration for bitterness, 10 human volunteers were used. LFX was used as control. Aqueous solutions of LFX with concentrations 45, 50, 65, 75, 80, 85 and 90 μg/ ml were prepared using a stock solution of LFX (1000 μg/ml). Each volunteer was given the drug solutions, which were placed in mouth for a few seconds and the bitterness was recorded using a numerical five-point scale (Table 2) for taste evaluation. Volunteers were asked to gargle and wait for a few min before tasting the next solution. The mean bitterness value of each solution was calculated using the level of bitterness sensed by each individual member of the panel[26]. A third order polynomial equation was used to derive relationship between bitterness score (Y) and log LFX concentration (X)[27].
| Taste characteristics | Score |
|---|---|
| Pleasant Tasteless Slightly bitter Moderately bitter Intensely bitter |
0 1 2 3 4 |
Table 2: Five point scale for taste evaluation
In vivo taste evaluation:
The taste evaluation test, also known as panel testing, is a psychophysical rating of the gustatory (sense of taste) stimuli[28]. Taste evaluation of LFX microparticles were performed on panel of ten healthy human volunteers after taking approval from Human Ethical Committee, Institute of Pharmacy, LCWU (ref no. Dir/ LCWU/157A). The study protocol was clarified and written consent from volunteers was obtained. Solution of pure drug was used as control. Solution of every microsphere formulation (90 μg/ml) was tasted by each volunteer. By comparing the taste with that of pure drug solution, bitterness was recorded on numerical five-point scale (Table 2) for taste evaluation. Also, the volunteers were asked to gargle with distilled water between subsequent tastings and wait for almost 5 min before tasting the solution of next formulation. Taste masking of drug was statistically compared by applying one-way ANOVA to all formulations. Statistical significance was considered when p<0.05.
Results and Discussion
LFX microspheres were successfully prepared by emulsion solvent evaporation method using EC and EL100 alone and in combination. Particle size for all formulations was satisfactory. The mean particle size ranged from 50±0.051 (F1) to 555±0.11 μm (F10, Table 3). It was observed that with increase of polymer concentration particle size also increased due to viscous nature of polymers, which aided in particle consolidation. Drug content ranged from 79.7 % for F1 to 90.8 % for F10. Drug entrapment ranged from 79 % for F1 to 90 % for F10 (Table 3). Highest entrapment efficiency and drug content was obtained with drug:polymer ratio 1:16. As the EC/ EL100 concentration increased, drug content and encapsulation efficiency also increased.
| Formulations | Particle size (µm, mean±SD) |
Drug content (%, mean±SD) |
Encapsulation efficiency (%, mean±SD) |
|---|---|---|---|
| F1 F2 F3 F4 F5 F6 F7 F8 F9 F10 |
50±0.051 90±0.98 120±1.00 200±2.90 259±1.00 298±0.76 201±0.11 330±0.85 432±0.34 555±0.11 |
79.71±0.15 44.9±0.009 82.9±0.01 82.96±0.11 84.0±0.0023 86.5±0.05 87.4±0.01 88.9±0.003 90.3±0.001 90.8±0.005 |
79.5±0.05 45.9±0.011 80.6±0.011 82.0±0.03 82.6±0.005 85.8±0.11 86.9±0.005 87.0±0.009 87.9±0.012 90.0±0.067 |
n=6
Table 3: Physical properties of LFX microspheres
Micrometric properties of all formulated microspheres are presented in Table 4. It was observed that as the EC/EL100 ratio increased, bulk and tapped densities decreased for all formulations except F2 and F4 concluding that microspheres had dissimilar shapes[29]. Microsphers showed good flow characteristics with Hausner ratio less than 1.20 and compressibility index less than 16. Angle of repose was found to be below 30o suggesting the free-flowing nature of the microspheres.
| Formulations | Bulk density (g/cm3) | Tapped density (g/cm3) | Carr’s index | Hausner Ratio | Flow rate (g/sec) | Angle of repose (o) |
|---|---|---|---|---|---|---|
| F1 | 0.22±0.011 | 0.28±0.01 | 12.8±0.1 | 1.20±0.01 | 0.076±0.01 | 23.0±0.84 |
| F2 | 0.30±0.015 | 0.33±0.01 | 11.8±0.5 | 1.13±0.05 | 0.065±0.05 | 22.3±0.051 |
| F3 | 0.138±0.001 | 0.177±0.05 | 15.6±0.5 | 1.20±0.05 | 0.053±0.01 | 20.4±0.091 |
| F4 | 0.248±0.001 | 0.275±0.01 | 9.76±0.05 | 1.1±0.011 | 0.075±0.02 | 24.7±0.01 |
| F5 | 0.127±0.005 | 0.134±0.03 | 5.3±0.158 | 1.05±0.05 | 0.064±0.01 | 23.2±0.05 |
| F6 | 0.15±0.01 | 0.158±0.02 | 11.26±0.2 | 1.14±0.01 | 0.079±0.03 | 20.5±0.09 |
| F7 | 0.125±0.025 | 0.153±0.03 | 16.73±0.2 | 1.17±0.01 | 0.078±0.01 | 25.9±0.01 |
| F8 | 0.084±0.003 | 0.088±0.05 | 6.75±0.02 | 1.08±0.01 | 0.098±0.02 | 25.06±0.04 |
| F9 | 0.067±0.001 | 0.094±0.02 | 17.2±0.2 | 1.4±0.02 | 0.99±0.005 | 28.8±0.01 |
| F10 | 0.137±0.001 | 0.164±0.01 | 16.6±0.15 | 1.17±0.01 | 0.978±0.01 | 29±0.006 |
n=6
Table 4: Micromeritic properties of LFX microparticles
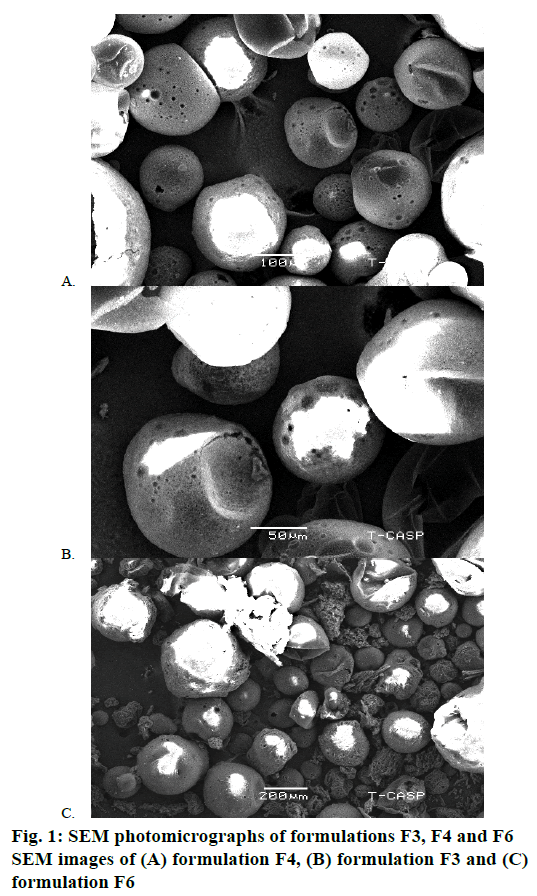
SEM revealed that most of LFX-loaded microspheres were spherical in shape (figs. 1A and B) but some have dents and shrinkage due to collapse of walls of microspheres as evident from fig. 1C. Moreover figs. 1A and B illustrated that there were no drug residues on the surface of microparticles indicating uniform distribution of drug on walls of microspheres.
The study disclosed that the stirring speed 850 rpm was the most favourable in the formation of suitable LFX microparticles. Keeping the stirring speed above 850 rpm resulted in emulsion breaking and formation of small sized particles while lower speed resulted in large sized particles formation. As a result, mean particle size of microspheres increased. The desired spherical microspheres were obtained at speed ranging from 700-850 rpm[30].
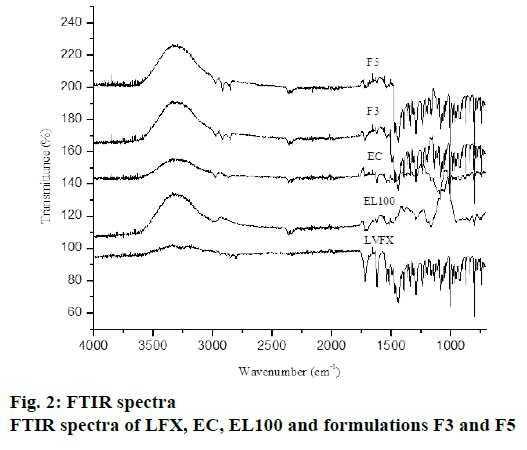
The FTIR spectra of pure drug, polymer and different formulations were recorded to detect drug-polymer interactions. The IR spectra of pure drug showed principal peaks at 1724 cm-1 (C=O stretching vibration of – COOH group), 1294 cm-1 (C-N stretching), 1084 cm-1 (C-F stretching) as shown in fig. 2. These results are in consistent with previous literature[31]. EC showed peaks at 1052, 2872-2976 and 1384 cm−1 (due to –C–O–C–stretching and C–H stretching). EL 100 showed peaks at 1598 cm-1 (C=O), 1672 cm-1 (Al-CH-bend) and 1134 cm-1 (Ar-CH In plane Bending). The principal peaks of LFX were observed in drug-loaded microsphere (fig. 2). There was no shifting of characteristic peaks in LFX-loaded microspheres indicating the absence of any significant incompatibility among LFX, EC and EL100.
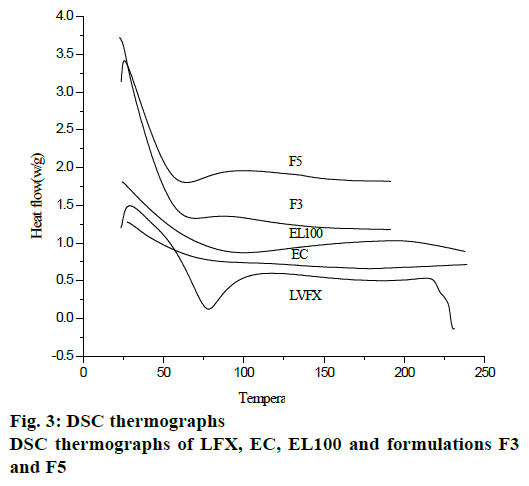
DSC curves of microspheres and pure components are shown in fig. 3. LFX showed sharp endothermic peak above 70° due to melting of the γ form of LFX. A broad exotherm was also observed at 100°. The exothermic peak at 229° was due to the crystallization of alpha or beta forms of LFX. EC showed endotherm at temperature range of 170-190°, while DSC thermograph of EL100 showed endotherm at 100° and a broad exotherm was observed at temperature range 100-230°. The absence of detectable crystalline domains in drug-loaded microparticles (fig. 3) clearly indicated that drug was completely dispersed in the microparticle formulations.
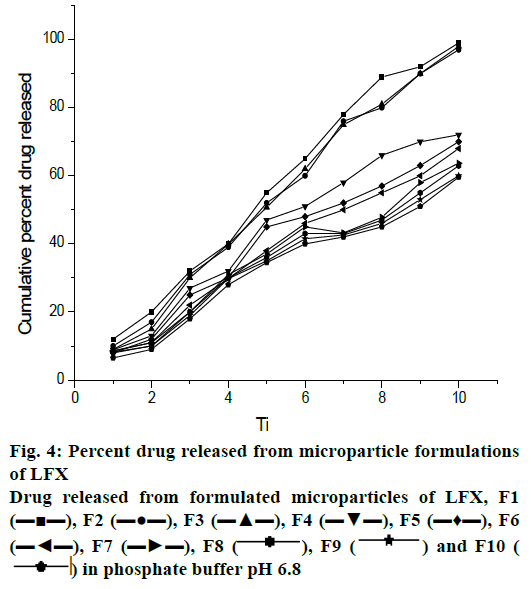
Dissolution study of the formulated microparticles was performed in 900 ml 0.1 N HCl (pH 1.2) for 2 h and drug release was found to be negligible. This was due to insolubility of drug in acidic medium. The percent drug release at 8 h in phosphate buffer pH 6.8 was as follows; F1- 99, F2- 97, F3- 99.9, F4- 88.6, F5- 70, F6- 64, F7- 63.6, F8- 63, F9- 59.9 and F10- 44. It was found that more than 95 % of drug release was achieved with drug:polymer ratio of 1:1 and 1:2 but with high concentration of both polymers (1:16) only 44 % drug release was achieved (fig. 4).
All the formulations gave best correlation for Korsmeyer-Peppas (Table 5) signifying that drug release mechanism is atypical (diffusion plus erosion). The value of ‘n’ was used to illustrate release mechanism. The value of ‘n’ for F5 and F6 formulations i.e. 0.452 and 0.502 indicated a Fickian diffusion while a value of n greater than 0.5 demonstrated that release mechanism was non-Fickian and super case II transport for all other formulations.
| Formulation | Zero order | 1st order | Higuchi | Hixson Crowell | Korsmeyer Peppas | Value of ‘n’ (Korsmeyer) | Best fit model | Drug release mechanism |
|---|---|---|---|---|---|---|---|---|
| R2 | R2 | R2 | R2 | R2 | ||||
| F1 | 0.9908 | 0.9027 | 0.8361 | 0.9491 | 0.9930 | 0.937 | Korsmeyer | Super case II transport |
| F2 | 0.9919 | 0.9247 | 0.8278 | 0.6952 | 0.9928 | 0.959 | Korsmeyer | Super case II transport |
| F3 | 0.9573 | 0.9353 | 0.8722 | 0.9712 | 0.9946 | 1.00 | Korsmeyer | Super case II transport |
| F4 | 0.9733 | 0.9821 | 0.8966 | 0.9824 | 0.9903 | 0.845 | Korsmeyer | Non-Fickian diffusion |
| F5 | 0.3125 | 0.8003 | 0.9847 | 0.6897 | 0.9926 | 0.452 | Korsmeyer | Fickian diffusion |
| F6 | 0.5064 | 0.7617 | 0.9263 | 0.6952 | 0.9273 | 0.502 | Korsmeyer | Fickian diffusion |
| F7 | 0.9421 | 0.9570 | 0.8685 | 0.9641 | 0.9690 | 0.809 | Korsmeyer | Non-Fickian diffusion |
| F8 | 0.9863 | 0.9585 | 0.8436 | 0.9805 | 0.9908 | 0.914 | Korsmeyer | Super case II transport |
| F9 | 0.9618 | 0.9247 | 0.8278 | 0.6952 | 0.9823 | 0.830 | Korsmeyer | Non-Fickian diffusion |
| F10 | 0.9421 | 0.9694 | 0.8685 | 0.9641 | 0.9837 | 0.711 | Korsmeyer | Non-Fickian diffusion |
Table 5: Kinetic modeling of drug released from formulated microparticles of LFX
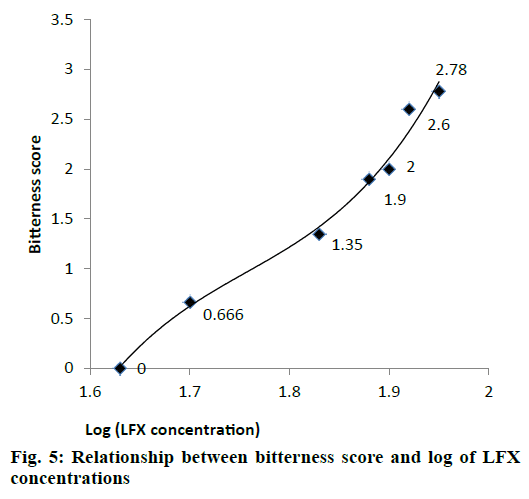
Different dilutions of LFX were subjected to in vivo taste evaluation in 10 healthy human volunteers. All volunteers gave a bitterness score ‘0’ (pleasant) for LFX solution of 45 μg/ml. Therefore, LFX concentration of 45 μg/ml was selected as bitterness threshold because concentrations higher than 45 μg/ml were sensed as bitter to human tongue (Table 6).
| Drug concentration (μg/ml) | Log concentration (μg/ml) | Average bitterness score |
|---|---|---|
| 45 | 1.63 | 0 |
| 50 | 1.7 | 0.666 |
| 65 | 1.83 | 1.35 |
| 75 | 1.88 | 1.9 |
| 80 | 1.9 | 2 |
| 85 | 1.92 | 2.6 |
| 90 | 1.95 | 2.78 |
Table 6: Average bitterness score for different LFX solutions
Relationship between bitterness scores (Y) and log LFX concentration (X) was derived by third order polynomial Eqn., (R2=0.987) as shown in fig. 5. This Eqn. (y = 114.4x3–603.1x2+1065x–629.4) can be used to calculate bitterness scores of LFX at any desired concentration.
Taste evaluation of LFX microparticles by volunteers illustrated that taste was successfully masked by EC and EL 100 in 1:1 ratio. The results of taste evaluation studies are shown in Table 7. The taste masking for formulations F1, F3, F4, F5, F6, F7, F8, F9 and F10 was significantly improved (p<0.05). F3 showed excellent taste masking with bitterness score ‘0’ (pleasant) by five volunteers and ‘1’ (tasteless) by five volunteers while F2 formulation did not show satisfactory taste masking establishing that EL100 alone is not a suitable taste masking agent.
| Formulation | V1 | V2 | V3 | V4 | V5 | V6 | V7 | V8 | V9 | V10 |
|---|---|---|---|---|---|---|---|---|---|---|
| F1 | 1 | 1 | 1 | 1 | 1 | 1 | 1 | 1 | 1 | 1 |
| F2 | 3 | 2 | 3 | 3 | 3 | 3 | 3 | 3 | 3 | 3 |
| F3 | 0 | 1 | 1 | 1 | 1 | 1 | 0 | 0 | 0 | 0 |
| F4 | 1 | 1 | 1 | 1 | 1 | 1 | 1 | 1 | 1 | 0 |
| F5 | 1 | 0 | 1 | 1 | 1 | 1 | 0 | 0 | 1 | 1 |
| F6 | 1 | 1 | 0 | 0 | 1 | 1 | 0 | 1 | 1 | 1 |
| F7 | 1 | 1 | 1 | 1 | 1 | 0 | 1 | 1 | 0 | 1 |
| F8 | 1 | 1 | 1 | 1 | 0 | 1 | 0 | 1 | 0 | 1 |
| F9 | 1 | 0 | 0 | 0 | 1 | 1 | 1 | 1 | 1 | 1 |
| F10 | 0 | 1 | 1 | 0 | 0 | 1 | 1 | 1 | 1 | 1 |
Table 7: Sensory evaluation of microsphere formulations according to five-point scale (n=10)
Hence, from the above findings, the EC and EL 100 were proved to be suitable polymers for this purpose. This combination not only masked the unpleasant taste of LFX but also proved effective in controlling the release rate of drug from microspheres. F3 formulation with drug: polymer ratio (1:2) is most palatable, results of which are supported by the in vivo taste evaluation.
The study suggested that palatable microparticles can be commercialized as patient-compliant dosage forms, such as orodispersible films, fast dissolving tablets and dry powder for reconstitution after comprehensive in vivo analysis and stability assessment. This product will find a good position in the pharmaceutical market of today because it would enhance compliance in pediatric and geriatric population.
Conflict of interest:
Authors have no conflict of interest.
References
- Pawar HA, Joshi PR. Development and evaluation of taste masked granular formulation of satranidazole by melt granulation technique. J Pharm 2014;2014:789676.
- Ahire SB, Bankar VH, Gayakwad PD, Pawar SP. A review: taste masking techniques in pharmaceuticals. Pharm Sci Monitor 2012;3:68-82.
- Obeidat WM. Recent patents review in microencapsulation of pharmaceuticals using the emulsion solvent removal methods. Recent Pat Drug Deliv Formul 2009;3:178-92.
- Piñón-Segundo E, Nava-Arzaluz MG, Lechuga-Ballesteros D. Pharmaceutical polymeric nanoparticles prepared by the double emulsion-solvent evaporation technique. Recent Pat Drug Deliv Formul 2012;6:224-35.
- Iqbal M, Zafar N, Fessi H, Elaissari A. Double emulsion solvent evaporation techniques used for drug encapsulation. Int J Pharm 2015;496:173-190.
- Wong CY, Ai-Salami H, Dass CR. Microparticles, microcapsules and microspheres: A review of recent developments and prospects for oral delivery of insulin. Int J Pharm 2018;537:223-44.
- Khan R, Arora R, Ojha A, Chopra H, Upadhayaya K . Formulation and evaluation of floating microspheres of levofloxacin. Int Res J Pharm 2018;9:186-191.
- Guan J, Cheng P, Huang S, Li Z, Wu J, Gao P, et al. Mathematic simulating of levofloxacin release from chitosan nano/microparticles. Przegląd Elektrotechniczny 2012;88:345-9.
- Chan LW, Ong KT, Heng PW. Novel film modifiers to alter the physical properties of composite ethyl cellulose films. Pharm Res 2005;22:476-89.
- Zaman M, Adnan S, Saeed M A, Farooq M, Masood Z, Chishti S A, et al. Formulation and in-vitro evaluation of sustained release matrix tablets of cellulose based hydrophilic and hydrophobic polymers loaded with loxoprofen sodium. Indo Am JPharma Res 2013;3:7389-98.
- Rahman MM, Hasan SM, Alam A, Roy S, Jha MK, Ahsan MQ, et al. Formulation and evaluation of Ranolazine sustained release matrix tablets using Eudragit and HPMC. Int J Pharm 2011;2:7-12.
- Dupinder K, Seema S. Development and characterization of lovastatin loaded microspheres. Int J Pharm Dev Technol 2014;4:71-8.
- Wu PC, Huang YB, Chang JS, Tsai MJ, Tsai YH. Design and evaluation of sustained release microspheres of potassium chloride prepared by Eudragit®. Eur J Pharm Sci 2003;19:115-22.
- Nagesh C, Venkatesh JS, Raj SM, Rabadia J, Patil S, Shankraiah M. Intra gastric floating drug delivery system of levofloxacin: formulation and evaluation. J Pharm Sci Res 2011;3:1265-8.
- Sriram P, Kamlekar D, Hazari S. Preparation and in vitro evaluation of chitosan microspheres of eplerenone. Int J Pharm Sci 2013;5:226-29.
- Selvaraj S, Karthikeyan J, Saravana Kumar N. Chitosan loaded microspheres as an ocular delivery system for acyclovir. Int J Pharm Pharm Sci 2012;4:125-32.
- Raveendra M, Lakshmi NK, Sreedhar RC, Suresh V. Formulation and in vitro evaluation of floating microspheres of timolol maleate. Res J Pharm Biol Chem Sci 2012;3:936-46.
- Ansary J, Chaurasiya AK, Bashirul Haq KM. Formulation and evaluation of metformin HCl floating microspheres. Asian J Med Biol Res 2015;1:396-405.
- Malviya RI, Srivastava PR, Bansal MA, Sharma PK. Formulation, evaluation and comparison of sustained release matrix tablets of diclofenac sodium using tamarind gum as release modifier. Asian J Pharm Clin Res 2010;3:238-41.
- Mazumder R, Allamneni Y, Firdous S, Parya H, Chowdhury A. Formulation, development and in vitro release effects of ethyl cellulose coated pectin microspheres for colon targeting. Asian J Pharm Clin Res 2013;6:138-44.
- Gowda DV, Gowrav MP, Gangadharappa HV, Khan MS. Preparation and evaluation of mixture of eudragit and ethyl cellulose microparticles loaded with ranolazine for controlled release. J Young Pharm 2011;3:189-96.
- Goudanavar P, Reddy S, Hiremath D, Udupi R. Development and in-vitro characterization of esomeprazole floating gastro retentive microspheres. J Appl Pharm Sci 2013;3:71-77.
- Kotagale NR, Parkhe AP, Jumde AB, Khandelwal HM, Umekar MJ. Ranitidine hydrochloride-loaded ethyl cellulose and eudragit RS 100 buoyant microspheres: effect of pH modifiers. Indian J Pharm Sci 2011;73:626-33.
- Arunprasad B, Teja GK. Design and evaluation of bilayered tablets to treat respiratory tract infections. Int J Pharm Pharm Sci 2013;5:250-55.
- Dash S, Murthy PN, Nath L, Chowdhury P. Kinetic modeling on drug release from controlled drug delivery systems. Acta Pol Pharm 2010;67:217-23.
- Jagdale SC, Gawali VU, Kuchekar BS, Chabukswar AR. Formulation and in vitro evaluation of taste-masked oro-dispersible dosage form of diltiazem hydrochloride. Braz J Pharm Sci 2011;47:907-16.
- Saharan VA, Dev K, Kharb V, Singh A, Jadhav H, Purohit S. Bitterness score and its correlation to drug concentration: an approach for estimating bitterness suppression in a marketed product of ofloxacin. Anal Chem Lett 2014;4:232-39.
- Yadav A. Taste masking of flouroquinolone antibiotics using ion exchange resins in Pharmacy [dissertation]. Ajmer, Rajasthan, India: Bhagwant University; 2011.
- Trivedi P, Verma A, Garud N. Preparation and characterization of aceclofenac microspheres. Asian J Pharm 2008;2:110-15.
- Rajab NA, Jawad MS. Formulation and in vitro evaluation of piroxicam microsponge as a tablet. Int J Pharm Pharm Sci 2016;8:104-14.
- Gevariya HB, Patel N. Formulation and characterization of levofloxacin loaded boidegradable nanoparticles. Asian J Pharm 2011;5:114-19.
 , F9
, F9  and F10 (
 ) in phosphate buffer pH 6.8