- *Corresponding Author:
- Linbo Zhang
Department of Nephrology, The First Hospital of Yulin, Yulin, Shaanxi Province 719000, China
E-mail: 554871756@qq.com
| Date of Received | 13 February 2023 |
| Date of Revision | 20 August 2023 |
| Date of Acceptance | 11 February 2024 |
| Indian J Pharm Sci 2024;86(1):228-235 |
This is an open access article distributed under the terms of the Creative Commons Attribution-NonCommercial-ShareAlike 3.0 License, which allows others to remix, tweak, and build upon the work non-commercially, as long as the author is credited and the new creations are licensed under the identical terms
Abstract
To explore the renal protection mechanism of targeted regulating of transforming growth factor beta receptor type 1 expression by let-7a in diabetic nephropathy rats, diabetic nephropathy rats were created through high-sugar and high-fat diet combined with a small dose of streptozotocin. Normally reared rats were taken as control group. Diabetic nephropathy rats were divided into two groups, one group was treated with let-7a analogs group, and the other group was not treated (diabetic nephropathy group). Experimental results showed that diabetic nephropathy rats had symptoms such as increased dietary frequency, weight loss, proteinuria, and decreased creatinine clearance. After let-7a treatment, the proteinuria symptoms of rats in let-7a analogs group were notably improved, and the creatinine clearance rate increased. The expression level of collagen IV in let-7a analogs group was higher than that of the control, but the difference was not significant. The expression level of fibronectin increased significantly in the diabetic nephropathy group (p<0.05), and that of the let-7a analogs group was significantly lower than that of the diabetic nephropathy group (p<0.05). The immunofluorescence expression result was consistent with the expression trend detected by Western blot. Compared with the control, the expressions of transforming growth factor-beta 1, transforming growth factor beta receptor type 1, and mothers against decapentaplegic homolog 2 in the diabetic nephropathy group were evidently increased (p<0.05), and the expression of mothers against decapentaplegic homolog 7 decreased obviously (p<0.05). The protein expression level was consistent with the messenger ribonucleic acid expression result. In summary, by regulating the levels of collagen IV and fibronectin and targeting the transforming growth factor beta receptor type 1 pathway, let-7a inhibited extracellular matrix synthesis to protect kidney function in patients with diabetic nephropathy.
Keywords
Let-7a analogs group, collagen IV, fibronectin, transforming growth factor beta receptor type 1, diabetic nephropathy
Mesenchymal stem cells are stem cells capable of self-renewal and multi-directional differentiation potential, which can be isolated from multiple tissues throughout the body[1]. Mesenchymal stem cells can be induced to differentiate into chondrocytes, adipocytes, and nerve cells under certain conditions. Moreover, mesenchymal stem cells also have immunosuppressive effects, which may be related to immune protection[2]. Exosomes are also called microvesicles, which are released by endosomes or formed by a variety of cells through budding. Exosomes can not only participate in the exchange of information between cells, but are also related to a variety of physiological and pathological processes. Exosomes from different tissues not only show the specificity of their own protein molecules, but also contain some key molecules for driving functions, which play the important role in immune response, tumor metastasis, and gene regulation.
Diabetes mellitus is a common complex disease, which is affected by genetic and environmental factors. Diabetic Nephropathy (DN) accounts for about 33 % of the total number of people with diabetes, and is one of the common causes of end-stage renal disease, which seriously affects the prognosis and survival of diabetic patients. If the progression of DN exceeds a certain stage, irreversible pathological changes will be formed. Medical effects can only slow down this condition, but can’t cure the kidney disease[3]. Studies have shown that glomerular mesangial lesions with mesangial cell proliferation as the main manifestation are one of the most prominent pathological changes in the early stage of DN. Many factors such as high sugar, high fat, and inflammation are involved in its occurrence, but the specific mechanism is still unclear[4].
MicroRNA (miRNA) is a non-coding singlestranded Ribonuclic Acid (RNA) molecule with a size of about 20 nucleotides. It can bind to the target site of messenger RNA of a specific target gene to inhibit the synthesis of related proteins or induce the degradation of messenger RNA[5,6]. miRNA plays an important and irreplaceable role in various physiological processes such as ontogeny, organ formation, cell proliferation, differentiation, and apoptosis. The let-7 family is the second miRNA molecule discovered, encoding a 22nt small RNA. The mammalian genome contains 11 miRNA molecules encoded by let-7 homologous gene family, including let-7a, which is involved in the occurrence and progression of many diseases, and is a very active miRNA family[7,8]. Studies found that let-7 was an important regulator of diabetes, which may participate in the occurrence and progression of DN by regulating the proliferation of DN mesangial cells. Bioinformatics testing showed that Transforming Growth Factor Beta Receptor 1 (TGFβ-R1) was the predicted target gene of let-7, whose sequence contained multiple let-7 binding sites and was highly conserved in the genomes of multiple species[9]. TGFBR1 can bind to TGF-β, open the Mothers Against Decapentaplegic (SMAD) signal pathway, and promote the proliferation of mesangial cells, thus playing a key role in the process of cell morphogenesis, reproduction, and differentiation[10-12]. It was also found that TGFBR1 can promote the proliferation of mesangial cells, while TGFBR1 inhibitors can inhibit the proliferation of mesangial cells, indicating that let-7/TGFBR1 may play an important role in the proliferation of DN mesangial cells. The possible mechanism is up-regulating the expression of let-7a and inhibiting the expression of its target gene TGFBR1. In turn, it regulates the SMAD signaling pathway and inhibits the proliferation of glomerular mesangial cells[13-15]. In summary, molecular biological means would be adopted to regulate the expression level of let-7a/ TGFBR1 to verify its role in DN.
Materials and Methods
Establishment of animal models and grouping:
Thirty healthy male Sprague-Dawley (SD) rats were provided by Ankang Central Hospital Experimental Animal Center and fed freely at room temperature of 25° and relative humidity of 60 %-80 %. Then, 30 rats were randomly divided into normal control group (n=10) and model group (n=20), and fed with ordinary diet and high-fat high-sugar diet, respectively. After 5 w, rats in the model group were injected unilateral intraperitoneal injection of Streptozotocin (STZ) (30 mg/kg) to establish DN model. After injection of STZ for 3 d, the fasting blood glucose of the rats was measured, and 16.7 mm or greater was considered as a successful diabetic model. The DN model was successfully prepared with blood glucose at or above 16.7 mm and urine volume and urine protein at twice of the pre-modeling level. The successful model rats were divided into let- 7A group (L7A, n=10) and DN group (n=10). Rats in L7A group were treated with let-7A analogue once a day for 6 w. During the experiment, blood glucose concentration was measured once a week, and urine protein content was measured every 2 w for 24 h.
Specimen collection and detection:
After the experiment, 24 h urine samples of rats were taken; volume was recorded, and then centrifuged. The supernatant was taken and sent to the clinical laboratory of Ankang Central Hospital for measurement of urinary creatinine, and urine protein was determined by Coomassie brilliant blue method. Then, the rats were weighed, given an intraperitoneal injection of 10 % chloral hydrate. Cardiac blood was collected with a coagulant tube and sent to the laboratory for serum creatinine. Creatinine clearance (Ccr)=(urine creatinine (mM)×urine volume (ml)/blood creatinine (mM))×(1/1440 (min)). The left ventricle was perfused with normal saline, precooled in the refrigerator until the kidneys turned pale. The kidney was removed quickly, so did the capsule, the kidney was weighed, and then part of the renal cortex was fixed with 4 % paraformaldehyde fixator. Finally, it was embedded in paraffin, sliced, and the rest was preserved in liquid nitrogen.
Hematoxylin and Eosin (H&E) staining:
Dewaxing was done first. Slices were placed into 60° oven for 2 h to fully molten wax, then into the xylene solution I for 10 min, and were put into xylene solution II for dewaxing for 5 min. After hydration, the slides from xylene solution were placed in 100 % ethanol solution for 10 min, 95 % ethanol solution for 10 min, 85 % ethanol solution for 5 min, and 75 % ethanol solution for 5 min. Finally, rinsed with distilled water for 2 min, the slices were stained. The samples were stained with hematoxylin for 5 min, differentiated with hydrochloric acid and alcohol for 30 s, rinsed with tap water for 2 min, and rinsed with distilled water for 2 min. The samples were placed in 75 % ethanol solution for 2 min and 85 % ethanol solution for 3 min, and then stained with 0.5 % eosin for 1 min. Then, they were placed in 95 % ethanol solution for 10 min, 100 % ethanol solution, xylene solution I for l0 min, and xylene solution II for 5 min successively. Finally, seal the slices with neutral gum.
Immunofluorescence staining:
Dewaxing and hydration were the same as above. The slices were washed with 0.01 M phosphate buffer on a shaker for 5 min, a total of 6 times. The slices were put in 0.3 % hydrogen peroxide/ methanol solution at 4° for 30 min, and endogenous peroxidase in the tissue was inactivated through this step. Then, slices were washed with 0.01 M phosphate buffer for 5 min, 6 times in total, placed in boiling citrate buffer for 5 min and then taken out, repeated for several times. The slices were put at room temperature to cool to normal temperature, and antigen retrieval was performed through this step. Washed with 0.01 M phosphate buffer for 5 min, 6 times in total, the slices were added with normal 10 % goat serum and incubated in a 37° incubator for 2 h for antigen blocking.
Primary antibody incubation: The primary antibody was added dropwise, placed in a 37° incubator for 1 h, and then placed in a 4° refrigerator overnight. Reheated for 30 min at room temperature, the slices were washed with 0.01 M phosphate buffer for 5 min, a total of 6 times.
Secondary antibody incubation: The primary antibody was placed in a 37° constant temperature box for 30 min, and the primary antibody was washed. Then, the fluorescent secondary antibody was added dropwise in the dark, and incubated in a humidified box at room temperature for 1 h. The nuclear was stained with 4’,6-Diamidino- 2-Phenylindole (DAPI) staining solution for 10 min and washed with 0.01 M phosphate buffer for 5 min, a total of 6 times. Finally, the pictures were observed and taken under a fluorescence microscope.
Real-time quantitative Polymerase Chain Reaction (PCR):
The primer5 was adopted to design the primer sequences, which were shown in Table 1. RNA extraction was performed. After the sample was grinded with liquid nitrogen, the total RNA was extracted with an RNA kit. Reverse transcription process was as follows; the RNA templates, xRT mix, and primers were dissolved in ultrapure water containing no nucleotides. Part one of the reaction systems 2 μl primer mix and 2 μl RNA template were added to the reaction tube, ultrapure water without nucleotide enzyme was added to make up to 15 μl, mixed well.
| Gene name | Primer direction | Primer sequence |
|---|---|---|
| Col4 | Forward | CAAACCACAGCCAATCCTTCA |
| Reverse | AAGAAGGGAAAACCCACTGTAGAGT | |
| FN | Forward | CATGGCTTTAGGCGAACCA |
| Reverse | CATCTACATTCAACAGGTATGG | |
| TGF-β1 | Forward | AGGGCTACCATGCCAACTTC |
| Reverse | CCACGTAGTAGACGATGGGC | |
| TGFBR1 | Forward | TGGCGGAATCCACGAAGA |
| Reverse | ACGGATGGATCAGAAGGTACAAG | |
| SMAD2 | Forward | ACAACAGGCCTTTACAGCTTC |
| Reverse | CTCTGTGGCTCAATTCCTGC | |
| SMAD7 | Forward | CCATCAAGGCTTTTGACTATGAAA |
| Reverse | CCATGGCTGCTGCATGAAC | |
| β-actin | Forward | CTCCATCCTGGCCTCGCTGT |
| Reverse | GCTGTCACCTTCACCGTTCC |
Table 1: Primer Sequence
Reaction system was incubated at 65° for 5 min, placed in ice bath for 8 min, and centrifuge briefly. In the second part of the reaction system, 1 μl HiFi-MMLV enzyme mix and 4 μl 5xRT mix were added, mixed well and incubated at 37° for 40 min. Finally, they were kept at 70° for 10 min. Real-time quantitative PCR was conducted. The experiment was carried out with a fluorescent quantitative PCR machine, and the operation steps were as follows.
Ultra SYBR mixture was adopted to amplify the target gene, the program was; 95° for 10 min, then 95° for 20 s, and 60° for 60 s, which were repeated for 40 cycles. The establishment of standard curve was as follows. The gradient dilution of complementary Deoxyribonucleic Acid (cDNA) of the control sample was finished, and 2 μl of each sample was taken as a template. The target gene and internal reference gene primers were adopted to amplify the target gene, and then the standard curves of target gene and internal reference gene were drawn. Real time PCR was adopted to analyze the samples. Each sample cDNA was diluted for 20 times, and 2 μl of them was taken as a template, then primer amplification of the target gene and internal reference gene was performed, respectively. At the same time, dissolution curve analysis was performed at 60°-95°. According to the PCR quantitative reaction results, the relative quantitative results of the target gene mRNA transcription level in each sample were calculated according to the 2-ΔΔct method.
Western blot detection:
The protein was extracted from the kidney tissue preserved during the operation, and the protein concentration was measured by the Bicinchoninic Acid (BCA) method. 30 μg of sample protein was taken and the protein was separated by Sodium Dodecyl Sulphate-Polyacrylamide Gel Electrophoresis (SDS-PAGE). The protein bands were transferred to Polyvinylidene Fluoride Membrane (PVDF) by wet transfer method, and then blocked with 5 % bovine serum albumin for 1 h. Then, the protein was added with antibody, incubated at room temperature for 2 h, then rinsed with Tris-Buffered Saline with 0.1 % Tween® 20 (TBST) (1 l of distilled water with 8 g of Sodium chloride (NaCl), 0.2 g of Potassium chloride (KCl), 3 g of Tris base (pH=7.4), and 1 ml of Tween 20) for 3 times. Then, the corresponding secondary antibody was added to them, incubated for 1 h, rinsed with TBST for 3 times. The protein was exposed in the electrochemical optics darkroom, the film was washed to show the protein bands. Finally, ImageJ software was adopted to analyze the band abundance for subsequent comparative analysis.
Statistical analysis:
Statistical Package for the Social Sciences (SPSS) 22.0 software was adopted for data analysis. The means comparison between the two groups was conducted by the t test; the multi-group means comparison was via one-way analysis of variance, and the Least Significant Difference (LSD) method was adopted for pairwise comparison. p<0.05 indicated that the difference was statistically significant
Results and Discussion
In Table 2, compared with the control, the 24 h urine protein of the DN group and the L7A group both increased. Compared with the DN group, the urine protein level of the L7A group was significantly decreased (p<0.05), and its level was between those of control and DN groups. Compared with the control, the creatinine clearance rate of the DN group was significantly decreased (p<0.05), which was also lower than that of the L7A group, but the difference was not statistically significant. The renal index of the DN group and the L7A group were significantly higher than that of the control (p<0.05). There was no significant difference between the DN and L7A groups. The glomerular area of the DN group and the L7A group were significantly higher than that of the control (p<0.05), and the glomerular area of the L7A group was significantly lower than that of the DN group (p<0.05). In fig. 1, the H&E staining results showed that the glomerular area of DN rats was significantly enlarged, and the symptoms of glomerular hypertrophy were alleviated after treatment of let-7a analogs.
| Group | 24 h urine protein | Creatinine clearance rate | Kidney index | Glomerular area |
|---|---|---|---|---|
| Control | 9.42±1.76 | 4.32±0.65 | 3.96±0.16 | 147.45±22.76 |
| DN | 41.32±3.86* | 2.35±0.42* | 5.92±0.31* | 195.93±39.21* |
| L7A | 24.98±2.08#* | 3.25±0.56# | 5.37±0.54* | 166.15±37.32#* |
Note: *p<0.05, indicated compared with the control and #p<0.05 indicated compared with the DN group
Table 2: comparison of rat renal function in each group.
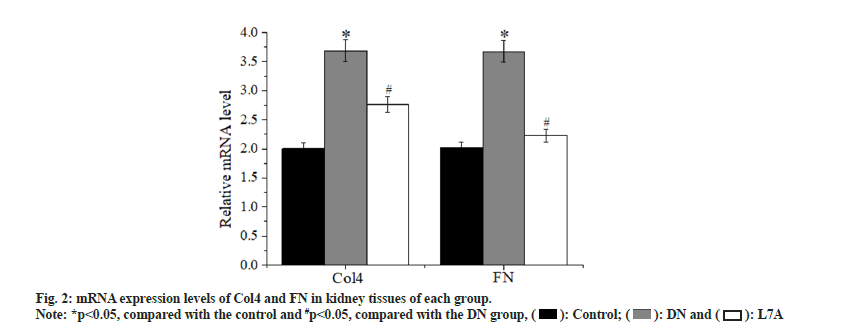
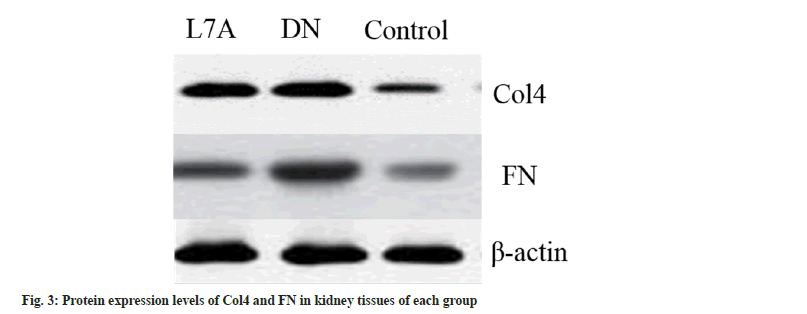
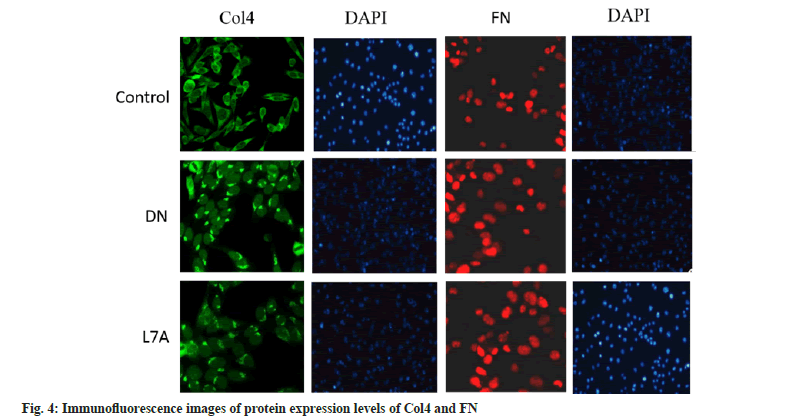
Compared with the control, the expression level of Collagen IV (Col4) was evidently increased in the DN group (p<0.05), and that of the L7A group was significantly lower than that of the DN group (p<0.05). The expression level of Col4 in the L7A group was higher than that in the control, but the difference was not significant. The expression level of Fibronectin (FN) increased significantly in the DN group (p<0.05), and that of the L7A group was significantly lower than that of the DN group (p<0.05). The expression level of FN in the L7A group was not significantly different from that in the control. The expression levels of Col4 and FN protein and mRNA expression levels of mice in each group showed similar trends (fig. 2). The immunofluorescence expression results were consistent with the expression trend detected via Western blotting (fig. 3 and fig. 4).
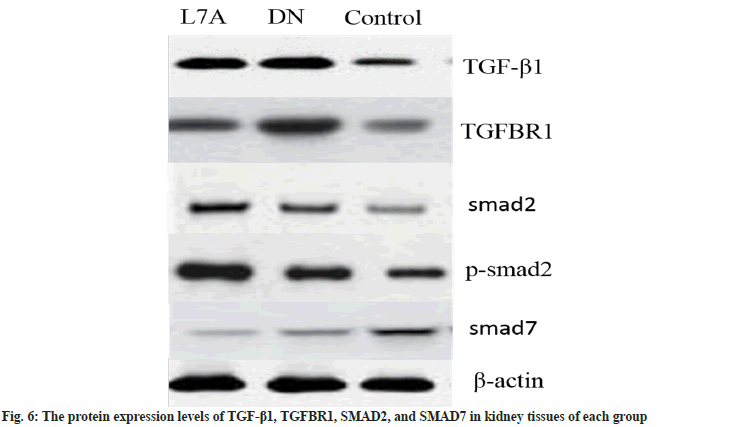
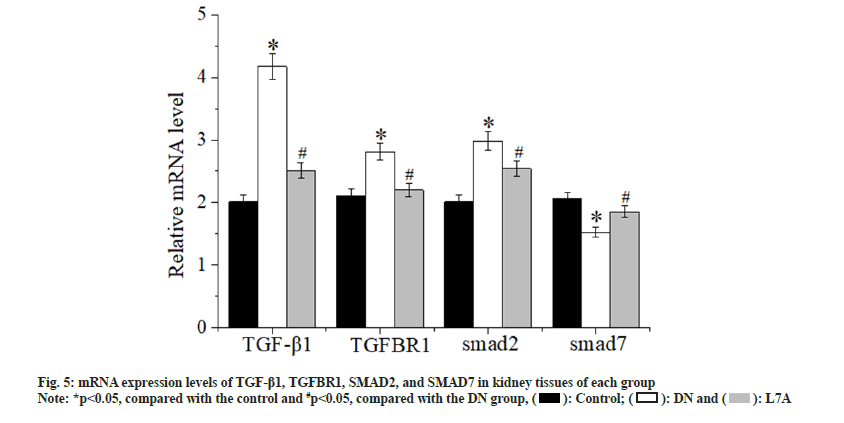
Fig. 5 showed the mRNA expression level of TGF-β1/SMAD signaling pathway. Compared with the control, the expression of TGF-β1, TGFBR1, and SMAD2 in the DN group was evidently increased (p<0.05), and the expression of SMAD7 was significantly decreased (p<0.05). Compared with the DN group, the expression of TGF-β1, TGFBR1, and SMAD2 in the L7A group was significantly decreased (p<0.05), and the expression of SMAD7 was evidently increased (p<0.05). However, there was no significant difference between the control and the L7A group in terms of mRNA expressions. Fig. 6 showed the protein expression level of each gene, which was consistent with the mRNA expression results.
DN is a common cause of end-stage renal disease. The excessive reproduction of mesangial cells and the accumulation of extracellular matrix are the pathogenic factors of early DN[16]. Glomerular mesangial cells are extremely active cells in the glomerulus, which have functions similar to the contraction of smooth muscle cells. It can secrete cell matrix, produce cytokines, and swallow and clean up macromolecular substances. Studies revealed that among the three intrinsic cells of the glomerulus, glomerular mesangial cells are the cells with the strongest extracellular matrix synthesis function[17]. Col4 is the basic structure that constitutes the reticular structure of the glomerular basement membrane, which plays a key role in maintaining the normal glomerular structure. FN is an important kind of glycoproteins, connected to each other in a fibrous structure. If these two substances accumulate too much, it will lead to the appearance of glomerular fibrosis and damage the kidney function[18,19]. Therefore, Col4 and FN were taken as indicators to measure the changes of extracellular matrix, to explore whether the protective effect of let-7a on the kidney was related to its expression. Studies suggested that the mRNA and protein expressions of Col4 and FN in the kidney tissue of DN rats had increased, while the mRNA and protein expression of Col4 and FN protein in DN rats treated with let-7a analogs were reduced. The above results indicated that let-7a may exert renal protection by inhibiting the synthesis of extracellular matrix.
DN rat model was established through a highquality and high-sugar diet and a small dose of STZ, after which the effect of let-7a analogs on the kidney function of DN rats was observed. Studies suggested that DN rats exhibited symptoms such as increased dietary frequency, weight loss, proteinuria, and decreased creatinine clearance. After let-7a treatment, the symptoms of proteinuria in rats were significantly improved, and the creatinine clearance rate increased. Kidney index and glomerular area can reflect the condition of kidney hypertrophy. Compared with the control, DN rats showed symptoms of renal hypertrophy and glomerular hypertrophy. This phenomenon had been improved by treatment of let-7a analogs. Existing studies revealed that let-7a-2 promoter region polymorphism and let-7a-3 promoter region hypermethylation were closely related to DN[20], which also indicated that let-7a may be associated with symptom changes in DN rats.
As the target gene of let-7a, the TGFBR1 signaling pathway is an important for it regulates the occurrence and progression of DN. The results showed that TGF-β1, TGFBR1, and SMAD2 were up-regulated in the kidney tissue of DN rats, while SMAD7 was down-regulated, indicating that the TGF-β1/SMAD signaling pathway was activated. The expression of TGF-β1, TGFBR1, and SMAD2 decreased, while the expression of SMAD7 increased after let-7a analog treatment, suggesting that the TGF-β1/SMAD signal pathway was inhibited. These results showed that let-7a can slow down the synthesis of extra-glomerular matrix by targeting TGFBR1 and inhibiting the TGF-β1/ SMAD signaling pathway, thereby improving renal function.
DN seriously threatens the survival and prognosis of diabetic patients, and is a serious chronic disease. miRNA is a kind of microRNA molecules with various physiological activities, which play an important regulatory role in the physiological and pathological processes of the body. By creating the mouse model of DN, the renal protective mechanism of let-7a analogues on DN was studied. The results indicated that let-7a analogs inhibited the synthesis of extracellular matrix by targeting the TGFBR1 signaling pathway and regulating the activity of Col4 and FN proteins, thereby protecting the kidneys. This study provided a solid and reliable experimental basis for small RNA as clinical drugs. However, since it is not a clinical experiment, it limits the clinical adoption of the research results.
Conflict of interests:
The authors declared no conflict of interests.
References
- Peng R, Liu H, Peng H, Zhou J, Zha H, Chen X, et al. Promoter hypermethylation of let-7a-3 is relevant to its down-expression in diabetic nephropathy by targeting UHRF1. Gene 2015;570(1):57-63.
[Crossref] [Google Scholar] [PubMed]
- Toh WS, Lai RC, Zhang B, Lim SK. MSC exosome works through a protein-based mechanism of action. Biochem Soc Trans 2018;46(4):843-53.
[Crossref] [Google Scholar] [PubMed]
- Rao V, Rao LV, Tan SH, Candasamy M, Bhattamisra SK. Diabetic nephropathy: An update on pathogenesis and drug development. Diabetes Metab Syndr 2019;13(1):754-62.
[Crossref] [Google Scholar] [PubMed]
- Wang T, Zhu H, Yang S, Fei X. Let-7a-5p may participate in the pathogenesis of diabetic nephropathy through targeting HMGA2. Mol Med Rep 2019;19(5):4229-37.
[Crossref] [Google Scholar] [PubMed]
- Zhang J, Zhou D, Zhang Z, Qu X, Bao K, Lu G, et al. miR-let-7a suppresses α-Synuclein-induced microglia inflammation through targeting STAT3 in Parkinson's disease. Biochem Biophys Res Commun 2019;519(4):740-6.
[Crossref] [Google Scholar] [PubMed]
- Yang ZY, Wang Y, Liu Q, Wu M. microRNA cluster MC-let-7a-1~let-7d promotes autophagy and apoptosis of glioma cells by down-regulating STAT3. CNS Neurosci Ther 2020;26(3):319-31.
[Crossref] [Google Scholar] [PubMed]
- Duan S, Li J, Tian J, Yin H, Zhai Q, Wu Y, et al. Crosstalk between let-7a-5p and BCL-xL in the initiation of toxic autophagy in lung cancer. Mol Ther Oncol 2019;15:69-78.
[Crossref] [Google Scholar] [PubMed]
- Zhang W, Liu X, Liu S, Qin Y, Tian X, Niu F, et al. Androgen receptor/let-7a signaling regulates breast tumor-initiating cells. Oncotarget 2018;9(3):3690-703.
- Singh A, Manjunath LE, Kundu P, Sahoo S, Das A, Suma HR, et al. Let-7a-regulated translational readthrough of mammalian AGO 1 generates a micro RNA pathway inhibitor. EMBO J 2019;38(16):e100727.
[Crossref] [Google Scholar] [PubMed]
- Yao A, Xiang Y, Si YR, Fan LJ, Li JP, Li H, et al. PKM2 promotes glucose metabolism through a let-7a-5p/Stat3/hnRNP-A1 regulatory feedback loop in breast cancer cells. J Cell Biochem 2019;120(4):6542-54.
[Crossref] [Google Scholar] [PubMed]
- Bai T, Liu Y, Li B. LncRNA LOXL1-AS1/miR-let-7a-5p/EGFR-related pathway regulates the doxorubicin resistance of prostate cancer DU-145 cells. IUBMB Life 2019;71(10):1537-51.
[Crossref] [Google Scholar] [PubMed]
- Ma W, Dou Q, Ha X. Let-7a-5p inhibits BMSCs osteogenesis in postmenopausal osteoporosis mice. Biochem Biophys Res Commun 2019;510(1):53-8.
[Crossref] [Google Scholar] [PubMed]
- Nuo M, Meng QT, Xia ZY. The pathway of Let-7a-1/2-3p and HMGB1 mediated dexmedetomidine inhibiting microglia activation in spinal cord ischemia-reperfusion injury mice. J Mol Neurosc 2019;69(1):106-14.
[Crossref] [Google Scholar] [PubMed]
- Wang S, Zhou H, Wu D, Ni H, Chen Z, Chen C, et al. Micro RNA let-7a regulates angiogenesis by targeting TGFBR 3 mRNA. J Cell Mol Med 2019;23(1):556-67.
[Crossref] [Google Scholar] [PubMed]
- Pan JH, Kim H, Tang J, Beane KE, Park JW, Kong S, et al. Acute alcohol consumption-induced let-7a inhibition exacerbates hepatic apoptosis by regulating Rb1 in mice. Alcohol 2020;85:13-20.
[Crossref] [Google Scholar] [PubMed]
- Chen CY, Choong OK, Liu LW, Cheng YC, Li SC, Yen CY, et al. MicroRNA let-7-TGFBR3 signalling regulates cardiomyocyte apoptosis after infarction. EBioMedicine 2019;46:236-47.
[Crossref] [Google Scholar] [PubMed]
- Fan H, Jiang M, Li B, He Y, Huang C, Luo D, et al. MicroRNA-let-7a regulates cell autophagy by targeting Rictor in gastric cancer cell lines MGC-803 and SGC-7901. Oncol Rep 2018;39(3):1207-14.
[Crossref] [Google Scholar] [PubMed]
- Huang J, Lin H, Zhong M, Huang J, Sun S, Lin L, et al. Role of Lin28A/let-7a/c-Myc pathway in growth and malignant behavior of papillary thyroid carcinoma. Med Sci Monit 2018;24:8899.
[Crossref] [Google Scholar] [PubMed]
- Chen Y, Qiao L, Zhang Z, Hu G, Zhang J, Li H. Let-7a inhibits proliferation and promotes apoptosis of human asthmatic airway smooth muscle cells. Exp Ther Med 2019;17(5):3327-34.
[Crossref] [Google Scholar] [PubMed]
- Anene C, Graham AM, Boyne J, Roberts W. Platelet microparticle delivered microRNA-Let-7a promotes the angiogenic switch. Biochim Biophy Acta Mol Basis Dis 2018;1864(8):2633-43.
[Crossref] [Google Scholar] [PubMed]

 ): Control; (
 ): DN and (
 ): L7A
 ): Control; (
 ): DN and (
  ): L7A