- Corresponding Author:
- G. Madhavi
Department of Chemistry, Sri Venkateswara University, Tirupati-517 502, India
E-mail: gmchem01@gmail.com
| Date of Submission | 02 February 2013 |
| Date of Revision | 05 June 2013 |
| Date of Acceptance | 15 June 2013 |
| Indian J Pharm Sci 2013;75(5):501-506 |
Abstract
2-N-butyl-4-spirocyclopentane-2-imidazoline-5-one has been highlighted as a potential genotoxic impurity in irbesartan. A sensitive LC-MS/MS method was developed and validated for the determination of 2-N-butyl-4-spirocyclopentane-2-imidazoline-5-one in irbesartan. Good separation between 2-N-butyl-4-spirocyclopentane-2-imidazoline-5-one and irbesartan was achieved with Symmetry C18 (100×4.6 mm, 3.5 μm) column using 65:35 v/v mixture of 0.1% formic acid and acetonitrile as mobile phase with a flow rate of 0.7 ml/min. The proposed method was specific, linear, accurate, and precise. The calibration curve shows good linearity over the concentration range of 0.1-2.0 μg/ml, which matches the range of limit of quantitation-20×limit of quantitation of estimated permitted level (1.0 μg/ml) of 2-N-butyl-4-spirocyclopentane-2-imidazoline-5-one. The method was validated as per International Conference on Harmonization guidelines and was able to quantitate 2-N-butyl-4-spirocyclopentane-2-imidazoline-5-one impurity at 1.0 μg/ml with respect to 2 mg/ml of irbesartan. 2-N-butyl-4-spirocyclopentane-2-imidazoline-5-one was not present in the three studied pure and formulation batches of irbesartan and the developed method was a good quality control tool for quantitation of 2-N-butyl-4-spirocyclopentane-2-imidazole-5-one at very low levels in irbesartan.
Keywords
Linearity, irbesartan, method validation, genotoxicity, ICH guidelines
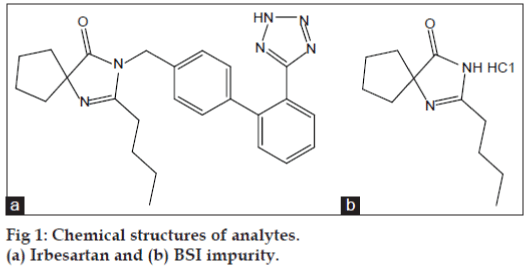
Compounds that can induce genetic mutations, chromosomal rearrangements are considered as genotoxic impurities (GTIs). According to current regulatory practices, GTIs have the potential to damage DNA at any level of exposure and such damage may lead/contribute to tumor development. Thus, for genotoxic carcinogens it is prudent to assume that there is no discernible threshold and that any level of exposure carries a risk [1-3]. International Conference on Harmonization (ICH) and The European Medicines Agency (EMA) guidelines provided the limits for impurities in drug substances and drug products, these limits are not acceptable for GTIs due to their adverse affect and hence it is necessary to set up limits based on daily dose of the drug substance [4-6]. To overcome this, scientists have to develop analytical methods and demonstrate the synthetic process controls. However, the relevant strategies are not readily available to all the drug substances or active pharmaceutical ingredient (API) manufacturers. As stated in the Q3A guidelines, potential genotoxic impurities most likely to arise during synthesis, purification and storage of the new drug substance [7-9]. Irbesartan is an angiotensin-receptor blocker (ARB) used mainly for the treatment of hypertension and 2-N-butyl-4-spirocyclopentane-2-imidazoline-5-one (BSI) is the most important intermediate used in the synthesis of irbesartan, which is identified as potential GTI in irbesartan [10,11]. The chemical structures of both irbesartan and BSI impurity are shown in fig. 1.
Thresholds for toxicological concern (TTC) value of 1.5 μg/day intake of a genotoxic impurity is considered to be associated with an acceptable risk (excess cancer risk of <1 in 100 000 over a lifetime) for most pharmaceuticals. From this threshold value, a permitted level in the active substance can be calculated based on the expected daily dose. Based on the maximum daily dosage (300 mg) of irbesartan, its GTIs are required to be controlled at a limit of 5 μg/g. Higher limits may be justified under certain conditions such as short-term exposure periods. Determination of these impurities at μg/ml levels requires highly sensitive analytical methodologies, which poses tremendous challenges on analytical communities in pharmaceutical research and development. Several high-performance liquid chromatography (HPLC) methods have been described previously for the determination of irbesartan in pharmaceuticals and biological samples [12-14]. But the combined technique of high-performance liquid chromatography-mass spectroscopy (HPLC-MS) provides the efficient separation capability, good selectivity as well as sensitivity. In recent years, much effort has been put in the development of novel LC-MS methods that are committed to either qualitative or quantitative analysis of analytes and GTIs. To the best of our knowledge no method was reported using LC-MS/MS for the quantitation of BSI in irbesartan, hence an attempt was made to overcome the shortcomings of the existing methods and in developing a highly sensitive, cost-effective, specific, direct, and accurate LC-MS/ MS method.
Materials and Methods
HPLC grade acetonitrile and ammonium acetate were purchased from Merck Ltd., Mumbai, India. Formic acid, trifluoroacetic acid and methanol were obtained analytical grade reagent from S. D. Fine-Chem Ltd., Mumbai, India. Purified water was collected through Milli-Q-Plus water purification system (Millipore, Milford, MA, USA). Reference substances, 2-N-butyl-4-spirocyclopentane-2- imidazoline-5-one (BSI) and irbesartan were obtained from Sigma-Aldrich, St. Louis, MA, USA.
Preparation of standard and sample solutions
Stock solutions of BSI (20 mg/ml) were prepared by dissolving the compound in methanol and further was suitably diluted with methanol to give final dilution of 0.5 μg/ml. The working standard solution was prepared by accurately weighing about 50 mg of irbesartan into a 25 ml volumetric flask, to this 100 μl of 0.5 μg/ml diluted stock solution of BSI was added and volume was made upto the mark. This affords 2.0 μg/ml and 2.0 mg/ml of BSI and irbesartan absolute concentrations, respectively, which correspond to 1.0 μg/ml BSI contamination relative to the drug substance. The BSI samples for validation at 0.1, 0.5, 0.75, 1.0, 1.5, and 2.0 μg/ml concentrations relative to the API were prepared in the same manner using 0.5 μg/ml diluted stock solution. The concentration of the standard solutions and samples were optimized to achieve a desired signal-to-noise ratio (S/N) and good peak shape.
Instrumentation
The MS/MS system used is an Applied Biosystems Sciex API 4000 model (Switzerland) and is coupled with HPLC system consisting of LC-20AD binary gradient pump, a SPD-10AVP UV detector, SIL-10HTC auto sampler and a column oven CTO-10ASVP (Shimadzu Corporation, Kyoto, Japan). Data acquisition and processing were conducted using the Analyst 1.5.2 software on a Dell computer (Digital equipment Co).
Operating conditions of LC-MS/MS
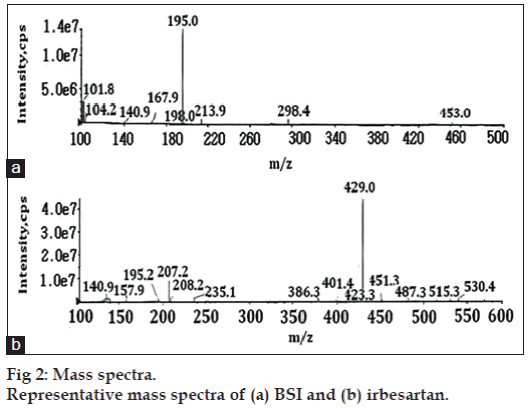
Symmetry C18 (100×4.6 mm, 3.5 μm) column (Waters Co, USA) was used with a flow rate of 0.7 ml/min, which split down to 0.2 ml/min into the MS source. The mobile phase used was a mixture of 0.1% formic acid:acetonitrile in the ratio of 65:35 (v/v). The column temperature was 40º and injection volume was 10 μl. Positive electrospray ionization (ESI) probe operated with selective ion monitoring (SIM) mode was used for quantification of BSI. In this method BSI was monitored with its extracted ion m/z 195.2 [(M+H)+] and irbesartan was monitored with its extracted ion m/z 429.2 [(M+H)+] (fig. 2). The ion spray voltage (V), declustering potential (DP), and entrance potential (EP) were optimized as 5000, 50 and 10 V, respectively. The curtain gas flow, ion source gas1 and ion source gas2 nebulization pressure (psi) were maintained as 25, 25 and 30 psi, respectively. All the parameters of LC and MS are controlled by Analyst software version 1.5.2.
Validation study
Validation study was performed for the quantification of the potentially genotoxic BSI impurity in irbesartan as follows. The assessed parameters during validation were limit of detection (LOD), limit of quantitation (LOQ), linearity, system precision and BSI recovery of spiked samples. The method validation was started by injecting 1.0 μg/ml of individual solution of BSI with respect to 2.0 mg/ml of irbesartan and determining their S/N (signal to noise) ratios. Now, to determine the LOD and LOQ values, BSI concentration is reduced sequentially to yield S/N ratio as 3:1 and 10:1, respectively. Linearity was performed by determining the correlation coefficient for a six point calibration curve, ranging between LOQ and 20×LOQ concentrations. The precision was evaluated at two levels viz., repeatability and intermediate precision. Repeatability was checked by calculating the relative standard deviation (%RSD) of six replicate determinations by injecting six freshly prepared solutions containing 1.0 μg/ml of BSI on the same day. The same experiments were done on six different days for evaluating intermediate precision. A recovery study by the standard addition method was performed to evaluate accuracy and specificity. Accordingly, the accuracy of the method was determined by spiking 0.1, 1.0, and 1.5 μg/ml of BSI separately to three batches of pure irbesartan (2.0 mg/ml). Each determination was carried out six times. The specificity of the method was determined by analyzing the tablets of irbesartan. The robustness of the method was studied with deliberate modifications in flow rate of the mobile phase and column temperature. The flow rate of the mobile phase was 0.7 ml/min, which was altered by 0.2 units i.e., from 0.5 ml/min to 0.9 ml/min. The effect of column temperature on resolution was studied at 38° and 42° instead of room temperature (28°). However, the mobile phase components were held constant as described above. Stability of BSI in methanol was checked by keeping them in an auto sampler and observing the variations in their peak areas at different time intervals.
Results and Discussion
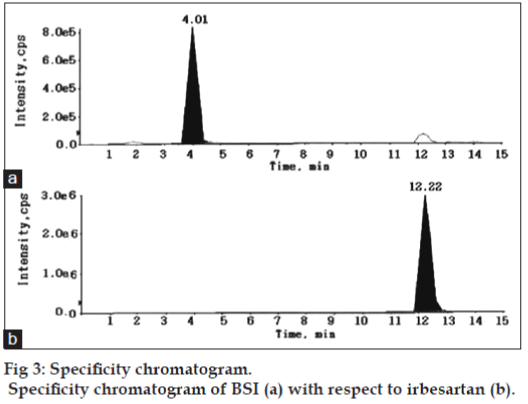
The aim of the present study was to separate and quantify BSI impurity in irbesartan drug substance using LC-MS/MS. The signal intensity obtained for BSI in positive mode was much higher than that in negative mode. Then, the possibility of using electrospray ionization (ESI) or atmospheric pressure chemical ionization (APCI) sources under positive ion detection mode was evaluated during the early stage of method development. ESI spectra revealed higher signals for the molecule compared to APCI source. Further the method development was therefore limited to ESI source. Chromatographic resolution of BSI and irbesartan was initiated under isocratic conditions to obtain adequate response, sharp peak shape, and a short analysis time. Thus, separation was tried using various combinations of ammonium acetate, formic acid/acetonitrile, and additives like tetrafluoroacetic acid on different reversed-phase columns to find the optimal column that produces the best sensitivity, efficiency, and peak shape. The analyte shows poor separation and reproducibility for proposed linear range, except for C18 Symmetry (100×4.6 mm, 3.5 μm) column that offers superior peak shape, baseline separation, desired linearity, and reproducibility. The mobile phase consisting of 0.1% formic acid:acetonitrile (65:35, v/v) ratio was found as most suitable for eluting BSI and irbesartan peaks at 4.01 and 12.22 min, respectively. Also the reproducibility of retention times for the analytes are expressed as % CV which is less than 1.0% for 100 injections on the same column. The optimized flow rate was 0.7 ml/min, which split down to 0.2 ml/min into the MS source.
The established method for the estimation of BSI in irbesartan was completely validated as per US-FDA and ICH guidelines. In order to prove that the method is capable of its intended use, the validation study covered in terms of sensitivity, specificity, accuracy, linearity and precision, and solution stability.
For demonstrating the specificity of the method irbesartan and BSI solutions were prepared individually at specification levels in the methanol and the solution of irbesartan spiked with BSI was also prepared and subjected to LC-MS/MS study for the evaluation of specificity. No chromatographic interference from any of the excipients was found at the retention times of BSI and irbesartan. These results confirms the specificity of the method without any excipients interference. The specificity chromatogram was shown in fig. 3.
By selective ion monitoring (SIM) mode, the linearity of BSI was satisfactorily demonstrated with a six point calibration graph between LOQ to 20×LOQ of analyte concentrations (LOQ, 5×LOQ, 7.5×LOQ, 10×LOQ, 15×LOQ and 20×LOQ). The peak area versus concentration data was done by linearity plot slope, intercept and residual sum of squares analysis. The calibration curve was given based on response over the concentration range for BSI. The correlation coefficient for BSI was >0.9999. The results impart that an excellent correlation existed between the peak areas and the concentration of BSI.
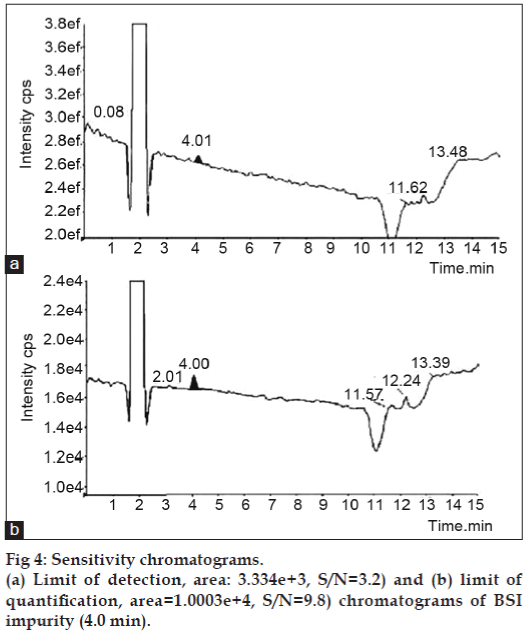
The LOD and LOQ was determined by obtaining the S/N ratio, comparing the test results from samples with known concentrations of analyte with those of blank samples and establishing the minimum level at which the analyte can be reliably detected. The LOD and LOQ of BSI were 0.03 μg/ml and 0.1 μg/ml, respectively. The predicted LOD and LOQ concentrations were verified for precision by injecting each solution six times for LC-MS/ MS at predicted concentration. The chromatograms are shown in fig. 4 and further results are given in Table 1.
| Parameter | BSI |
|---|---|
| LOD (μg/ml)a | 0.033 |
| LOQ (μg/ml)a | 0.1 |
| Linear range (μg/ml)a | 0.1-2.0 |
| Slope | 100373.3 |
| Intercept | 220.6 |
| Correlation coefficient | 0.999 |
| Precision (%RSD)b | 0.39 |
| Intermediate precision (%RSD)b | 0.92 |
aLOD, LOQ and linear ranges are given in μg/ml with respect to 2 mg/ml of irbesartan. bSix determinations using 1.0 μg/ml of BSI with respect to 2 mg/ml of irbesartan
Table 1: Lod, loq and linear regression analysis and precision data.
The precision of the method was verified at two levels viz., repeatability and intermediate precision. Repeatability was checked by calculating the relative standard deviation (%RSD) of six replicate determinations by injecting six freshly prepared solutions containing 1.0 μg/ml of BSI on the same day. The same experiments were done on six different days for evaluating intermediate precision. The developed method was found to be precise as the %RSD value for repeatability studies was less than 1.0%, whereas the %RSD for interday precision was slightly higher than that of repeatability study.
The recovery studies were performed to evaluate accuracy and specificity of the method, accordingly the accuracy of the method was determined in triplicate at LOQ, 10×LOQ and 15×LOQ spiked concentrations in formulation sample as well as in irbesartan tablet. The percentage recoveries of BSI exhibited an excellent recovery within the range of 97.6-103.5%. The recoveries at such lower levels were satisfactory with %RSD <1.0. The relative standard deviation was calculated from the average of triplicate analysis, the results are shown in Table 2. The obtained data indicated that no extra amount of BSI than spiked was found in formulation and pure tablet powder of irbesartan samples.
| Sample | % recovery of BSI ( mean ± %RSD) | ||
|---|---|---|---|
| 0.1 ppm | 1.0 ppm | 1.5 ppm | |
| Formulation sample 1 | 98.2 ± 0.65 | 102.4 ± 0.58 | 100.8 ± 0.21 |
| Formulation sample 2 | 96.5 ± 0.28 | 103.5 ± 0.25 | 101.5 ± 0.54 |
| Formulation sample 3 | 101.4 ± 0.48 | 100.2 ± 0.61 | 98.4 ± 0.29 |
| Pure tablet 1 | 99.6 ± 0.49 | 98.9 ± 0.31 | 100.2 ± 0.53 |
| Pure tablet 2 | 98.3 ± 0.24 | 99.1 ± 0.25 | 97.6 ± 0.41 |
| Pure tablet 3 | 97.9 ± 0.44 | 98.5 ± 0.66 | 99.3 ± 0.21 |
Table 2: Evaluation of accuracy and specificity of developed method
Robustness of the method was determined by making slight and deliberate changes in experimental conditions. The flow rate of the mobile phase was altered by 0.2 units i.e., 0.5-0.9 ml/min and the effect of temperature on resolution was also studied at 38º and 42º (altered by 2 units). For the above deliberately varied experimental conditions, there was no significant change in the chromatographic performance, which indicated the robustness of the method parameters.
The stability experiments were performed thoroughly to evaluate the stability of BSI stock solution at room temperature. The results demonstrated that the stock solution of BSI was stable at room temperature atleast for 36 h. The recovery values of BSI at different time intervals were compiled in Table 3. From the results we found that the recoveries at different time intervals were within 98.4-101.2% of their nominal values. The results obtained were then compared with the method precision results. The difference between recoveries at 0th and 36th h were not more than 10%, which indicates that the sample prepared in methanol is stable for at least 36 h.
| Time (h) | Theoretical | Measured | % recovery |
|---|---|---|---|
| conc (μg/ml) | conc (μg/ml) | (mean ± %RSD) | |
| 0 | 0.1 | 0.0997 | 99.7 ± 0.78 |
| 12 | 0.1 | 0.0984 | 98.4 ± 0.69 |
| 24 | 0.1 | 0.1004 | 100.4 ± 0.84 |
| 36 | 0.1 | 0.1012 | 101.2 ± 0.87 |
Table 3: Solution stability data of bsi at loq concentration.
The aim of the present study was to develop a simple analytical method that is capable of quantifying BSI impurity in irbesartan. Hence, a simple LC-MS/ MS method, which was able to quantify the BSI impurity at permitted levels was developed and validated. The developed method was found to be more specific. LOQ and LOD for BSI have been established and they are found to be within the range. The developed method was found to be linear over a specific concentration range and also found to be precise and accurate. The sample prepared in analytical solution was found to be stable for at least 36 h. The method has been completely evaluated for its linearity, precision, accuracy, robustness, limit of quantification, limit of detection, and stability in the solution. The developed method could be very useful for monitoring of BSI impurity in irbesartan synthesis.
Acknowledgements
Mr. A. Vijaya Bhaskar Reddy is highly grateful to the UGC (BSR), Government of India, New Delhi for financial assistance in the form of an award of Meritorious Research Fellowship. The authors are also thank to the Sipra Labs Limited, Hyderabad, for supporting this work.
References
- Bolt HM, Foth H, Hengstler JG, Degen GH. Carcinogenicity categorization of chemicals-new aspects to be considered in a European perspective. ToxicolLett 2004;151:29-41.
- McGovern T, Kram DJ. Regulation of genotoxic and carcinogenic impurities in drug substances and products. Trends Anal Chem 2006;25:790-5.
- Cheeseman MA, Machuga EJ, Bailey AB. A tiered approach to threshold of regulation. Food ChemToxicol 1999;37:387-412.
- International Conferences on Harmonisation Guideline on Impurities in New Drug Products, Q3B (R2), 25 October 2006.
- Guidelines on the Specification Limits for Residues of Metal Catalysts or Metal Reagents, European Medicines Agency, 21 February 2008.
- European Medicines Agency, Evaluation of Medicines for Human Use, Guideline on the Limits of Genotoxic Impurities, 1 January 2007.
- Kroes R, Renwick AG, Cheeseman M, Kleiner J, Mangelsdorf I, Piersma A, et al. Structure-based thresholds of toxicological concern (TTC): Guidance for application to substances present at low levels in the diet. Food ChemToxicol 2004;42:65-83.
- Ramakrishna K, Raman KN, NarayanaRao KM, Prasad AV, Subhaschander Reddy K. Development and validation of GC–MS method for the determination of methyl methanesulfonate and ethyl methanesulfonate in imatinibmesylate. J Pharm Biomed Anal 2008;46:780-3.
- Venugopal N, VijayaBhaskar Reddy A, Gangadhar Reddy K, Madhavi V, Madhavi G. Method development and validation study for quantitative determination of 2-chloromethyl-3,4-dimethoxy pyridine hydrochloride a genotoxic impurity in pantoprazole active pharmaceutical ingredient (API) by LC/MS/MS. J Pharm Biomed Anal 2012;70:592-7.
- Ashby J, Tennant RW. Chemical structure, Salmonella mutagenicity and extent of carcinogenicity as indicators of genotoxic carcinogenesis among 222 chemicals tested in rodents by the U.S. NCI/NTP. Mutat Res 1988;204:17-115.
- Muller L, Mauthe RJ, Riley CM, Andino MM, De antonis D, Beels C, et al. A rationale for determining, testing and controlling specificimpurities in pharmaceuticals that possess potential for genotoxicity.RegulToxicolPharmacol 2006;44:198-211.
- Ramzia IB, Hanaa MH, Waleed A. Septrofluorometric, Spectrophotometric and LC Determination of Irbesartan. J Chem Pharm Res 2011;3:722-33.
- Bae SK, Kim MJ, Shim EJ, Cho DY, Shon JH, Liu KH, et al. HPLC determination of irbesartan in human plasma: Its application to pharmacokinetic studies. Biomed Chromatogr 2009;23:568-72.
- Ram Reddy GV, Praveen Kumar A, Venkateswara Reddy B, Sreeramulu J, Park JH. Separation and quantification of key starting materials of irbesartan using liquid chromatography-mass spectrometry as a separation and identification tool. Anal Lett 2009;42:2087-95.


