- *Corresponding Author:
- S. K. Jain
SLT Institute of Pharmaceutical Sciences, Guru Ghasidas Vishwavidyalaya (A Central University), Bilaspur-495 009, India
E-mail: ks17jain03@gmail.com
| Date of Submission | 26 October 2016 |
| Date of Revision | 03 April 2017 |
| Date of Acceptance | 10 October 2017 |
| Indian J Pharm Sci 2017;79(6): 974-986 |
This is an open access article distributed under the terms of the Creative Commons Attribution-NonCommercial-ShareAlike 3.0 License, which allows others to remix, tweak, and build upon the work non-commercially, as long as the author is credited and the new creations are licensed under the identical terms
Abstract
Dipeptidyl peptidase-IV is well thought out as one of the key targets for treatment of type 2 diabetes mellitus and diverse scaffolds have proven effective in designing novel dipeptidyl peptidase-IV inhibitors. To this end, three dimensional quantitative structure activity relationship analysis and molecular docking studies were performed on a set of 3-amino-N-substituted- 4-(substituted phenyl) butanamides to explore the structural requirements for dipeptidyl peptidase-IV inhibitory activity using k-nearest neighbour molecular field analysis and AutoDock Vina, respectively. The compounds were arbitrarily assigned to active, moderately active and less active classes according to their biological activities. The most significant k-nearest neighbour model exhibited internal cross validation coefficient (q2) and external cross validation coefficient (pred_r2) as 0.67 and 0.82, respectively while the best partial least squares regression model showed 70% internal and 77% external predictability. Subsequent rigorous external validation through q2(F2), q2(F3), concordance correlation coefficient and mean absolute error provided further confidence in the predictability of both the models. Apropos the docking results, the compounds from active, moderately active and less active classes exhibited different binding patterns. Whereas the active compounds such as 12x and 12v occupied a similar space in the active site cavity as the crystallographic ligand (sitagliptin) (PDBID:1X70); the binding modes of compounds from moderately active and inactive classes were distinct from the latter. The findings of this study can provide an impetus for design of prospective potent dipeptidyl peptidase-IV inhibitors.
Keywords
Dipeptidyl peptidase-IV, k-nearest neighbour, validation, QSAR, docking
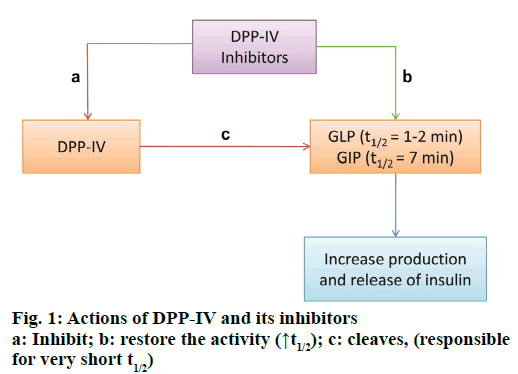
Diabetes is one of the major non-communicable and life-threatening diseases with an estimated affected population of 415 million worldwide in 2015 and expected increase to 642 million by 2040 [1]. Type-2 diabetes mellitus (T2DM), mainly characterized by insulin resistance and insulin deficiency, is prevalent among the two general forms of diabetes mellitus and accounts for almost 90 % of diabetic population worldwide. T2DM treatment is basically focused towards lowering and maintaining the level of glycosylated haemoglobin (HbA1c) below 7 %, thereby preventing the risk of micro and macro-vascular complications associated with the disease. The classical pharmacotherapy for T2DM includes sulfonylureas, meglitinides, thiazolidinediones, biguanides, and α-glucosidase inhibitors. The concerns with their long term use are major side effects such as weight gain and incidences of unpredictable hypoglycaemia. Therefore, newer approaches towards T2DM therapy are being developed based on better understanding of the insulin signalling pathway as well as other regulators of insulin release and insulin action [2]. Among these newer agents, dipeptidyl peptidase-IV (DPP4, DPP-IV, DPIV, CD26, EC 3.4.14.5) inhibitors have been widely investigated and were first introduced in 2006 with the approval of sitagliptin. Some of the other drugs being used as DPP-IV inhibitors are linagliptin, vildagliptin, saxagliptin and alogliptin [3]. Inhibition of DPP-IV results in increased levels of glucagon like peptide-1 (GLP-1), which is one of the two incretin hormones, the other hormone being glucose dependent insulinotropic polypeptide (GIP). Produced in the gut in response to nutrient intake, these hormones exert their action on pancreatic β-cells improving their function and efficiency, thus having an indirect positive effect on insulin secretion. Approximately 60 % of postprandial insulin release is promoted by these two hormones [4]. GLP-1 also increases β cells responsiveness towards glucose, inhibits gastric emptying and reduces appetite, hence contributes towards improved glycaemic control [5]. DPP-IV, a serine protease, specifically cleaves N-terminal dipeptides from substrates containing proline and to some extent alanine, at the penultimate position as in GLP-1 is responsible for very short half-life of the latter (only 1-2 min) and GIP (7 min) [6,7]. A schematic diagram of action of DPP-IV and its inhibitors is shown in Figure 1.
DPP-IV inhibitors belonging to diverse chemical classes can be broadly classified into peptidomimetics (agents mimicking the penultimate dipeptide structure of DPP-IV substrates) and non-peptidomimetics. Peptidomimetic inhibitors can be sub-classified into glycine based (α series) and β-alanine based (β series). In α series, substituted pyrrolidines or thiazolidines are linked to α-amino acid while in β series, β-amino amide moiety is linked to the proline nitrogen.
The quantitative structure activity relationship (QSAR) study correlates structural features of compounds with their biological activity/toxicity/other physicochemical properties through the utilization of several descriptors [8]. Descriptors are numerical representations of molecular properties defining electronic, topological, physicochemical and special features of the molecules. Similar molecules can exhibit large differences in their biological activities due to minute differences in their structures. QSAR focuses on these variations in biological activity with changes in molecular structure in a quantitative fashion [9]. The 3D descriptors include steric, electrostatic and hydrophobic features of molecules and their correlation with biological activity is established for derivation of 3D-QSAR. Among various 3D-QSAR methods are comparative molecular field analysis (CoMFA), comparative molecular similarity indices analysis (CoMSIA), k-nearest neighbour molecular field analysis (kNN-MFA), selforganizing molecular field analysis (SoMFA) [10].
In contrast to QSAR, which requires the biological activity of a series of ligands, molecular docking can be utilized provided the structure of the receptor is known. The reported ligands as well as newly designed compounds can be docked into the active site of the receptor to find out the structural requirements for their biological activity. Both ligand based and structure based approaches can be utilized for DPP-IV inhibitor design as high resolution X-ray crystal structures of the enzyme are available. In the present investigation an attempt has been made to apply both ligand and structure based approaches for identification of structural requirements for compounds with better DPP-IV inhibitory potential.
Materials and Methods
Biological activity data
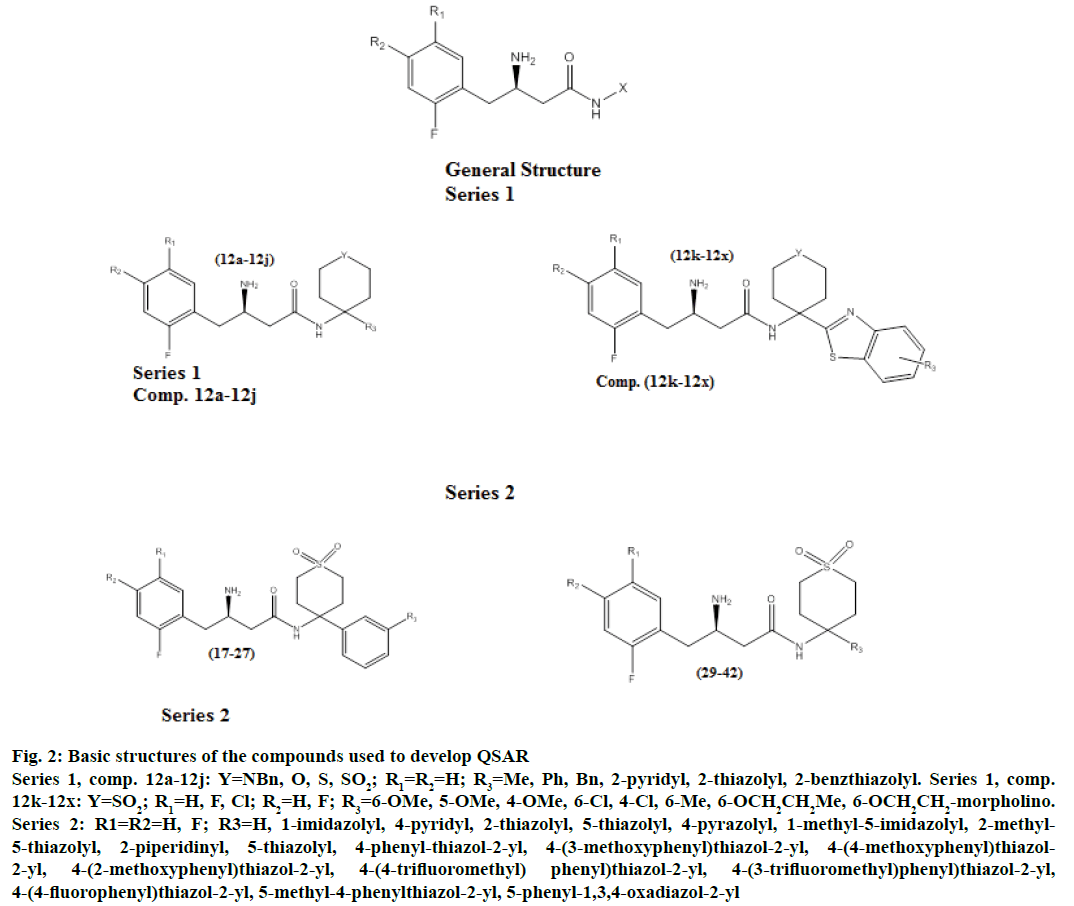
Nitta et al. reported the DPP-IV inhibitory activity of 3-amino-N-substituted-4-(substituted phenyl) butanamides in two communications [11,12] calculated as concentration required to inhibit 50 % (IC50) of DPP-IV derived from human colonic carcinoma cells (Caco-2). After removing two duplicates (17, 28) from the series, a dataset of 48 molecules was used in the present work (Table 1, Figure 2). The IC50 of all the compounds was converted to its negative logarithm spanning a range of ~4 log units.
| Compound | Y | R1 | R2 | R3 | IC50(nM) | pIC50 (moles)# |
|---|---|---|---|---|---|---|
| 12a | NBn | H | H | Me | 7800 | 5.11 |
| 12b | NBn | H | H | Ph | 1000 | 6.00 |
| 12c | NBn | H | H | Bn | 2200 | 5.66 |
| 12d | NMe | H | H | Ph | 870 | 6.06 |
| 12e | O | H | H | Ph | 2500 | 5.60 |
| 12f | S | H | H | Ph | 3300 | 5.48 |
| 12g | SO2 | H | H | Ph | 570 | 6.24 |
| 12h | SO2 | H | H | 2-pyridyl | 470 | 6.33 |
| 12i | SO2 | H | H | 2-thiazolyl | 190 | 6.72 |
| 12j | SO2 | H | H | 2- benzthiazolyl | 64 | 7.19 |
| 12k | SO2 | F | F | H | 13 | 7.89 |
| 12l | SO2 | H | H | 6-OMe | 12 | 7.92 |
| 12m | SO2 | F | F | 6-OMe | 2.7 | 8.57 |
| 12n | SO2 | F | F | 5-OMe | 3.3 | 8.48 |
| 12o | SO2 | H | H | 4-OMe | 270 | 6.57 |
| 12p | SO2 | H | H | 6-Cl | 35 | 7.46 |
| 12q | SO2 | H | H | 4-Cl | 130 | 6.89 |
| 12r | SO2 | H | H | 6-Me | 70 | 7.15 |
| 12s | SO2 | H | H | 4-Me | 350 | 6.46 |
| 12t | SO2 | F | F | 6-OCH2CH2OMe | 1.0 | 9.00 |
| 12u | O | F | F | 6-OCH2CH2OMe | 3.6 | 8.44 |
| 12v | SO2 | Cl | H | 6-OCH2CH2OMe | 0.64 | 9.19 |
| 12w | O | Cl | H | 6-OCH2CH2OMe | 1.9 | 8.72 |
| 12x | SO2 | F | F | 6-OCH2CH2-morpholino | 0.79 | 9.10 |
| 18 | SO2 | F | F | H | 0.083 | 7.08 |
| 19 | SO2 | F | F | 1-imidazolyl | 0.012 | 7.92 |
| 20 | SO2 | H | H | 4-pyridyl | 0.49 | 6.31 |
| 21 | SO2 | H | H | 2-thiazolyl | 0.39 | 6.41 |
| 22 | SO2 | H | H | 5-thiazolyl | 0.041 | 7.39 |
| 23 | SO2 | F | F | 5-thiazolyl | 0.0078 | 8.11 |
| 24 | SO2 | H | H | 4-pyrazolyl | 0.33 | 6.48 |
| 25 | SO2 | H | H | 1-methyl-5-imidazolyl | 0.084 | 7.08 |
| 26 | SO2 | H | H | 2-methyl-5-thiazolyl | 0.28 | 6.55 |
| 27 | SO2 | H | H | 2-piperidinyl-5-thiazolyl | 0.25 | 6.6 |
| 29 | SO2 | H | H | 4-phenylthiazol-2-yl | 0.06 | 7.22 |
| 30 | SO2 | F | F | 4-phenylthiazol-2-yl | 0.016 | 7.8 |
| 31 | SO2 | H | H | 4-(3-methoxyphenyl)thiazol-2-yl | 0.024 | 7.62 |
| 32 | SO2 | H | H | 4-(4-methoxyphenyl)thiazol-2-yl | 0.67 | 6.17 |
| 33 | SO2 | F | F | 4-(2-methoxyphenyl)thiazol-2-yl | 0.059 | 7.23 |
| 34 | SO2 | F | F | 4-(4-chlorophenyl)thiazol-2-yl | 1.1 | 5.96 |
| 35 | SO2 | F | F | 4-(4-(trifluoromethyl) phenyl)thiazol-2-yl | 0.11 | 6.96 |
| 36 | SO2 | F | F | 4-(3-(trifluoromethyl) phenyl)thiazol-2-yl | 0.19 | 6.72 |
| 37 | SO2 | H | H | 4-(4-fluorophenyl)thiazol-2-yl | 0.1 | 7 |
| 38 | SO2 | H | H | 5-methyl-4-phenylthiazol-2-yl | 0.072 | 7.14 |
| 39 | SO2 | F | F | 5-phenyl-1,3,4-oxadiazol-2-yl | 0.094 | 7.03 |
| 40 | SO2 | F | F | 5-(3-fluorophenyl)-1,3,4-oxadiazol-2-yl | 0.055 | 7.26 |
| 41 | SO2 | F | F | 5-(3-methoxyphenyl)-1,3,4-oxadiazol-2-yl | 0.05 | 7.3 |
| 42 | SO2 | F | F | 1-methyl-4-phenyl-1H-imidazol-2-yl | 0.16 | 6.8 |
Table1: Structures and Biological Activities of 3-Amino-N-Substituted-4-(Substituted Phenyl) Butanamides.
Figure 2: Basic structures of the compounds used to develop QSAR
Series 1, comp. 12a-12j: Y=NBn, O, S, SO2; R1=R2=H; R3=Me, Ph, Bn, 2-pyridyl, 2-thiazolyl, 2-benzthiazolyl. Series 1, comp. 12k-12x: Y=SO2; R1=H, F, Cl; R2=H, F; R3=6-OMe, 5-OMe, 4-OMe, 6-Cl, 4-Cl, 6-Me, 6-OCH2CH2Me, 6-OCH2CH2-morpholino. Series 2: R1=R2=H, F; R3=H, 1-imidazolyl, 4-pyridyl, 2-thiazolyl, 5-thiazolyl, 4-pyrazolyl, 1-methyl-5-imidazolyl, 2-methyl-5-thiazolyl, 2-piperidinyl, 5-thiazolyl, 4-phenyl-thiazol-2-yl, 4-(3-methoxyphenyl)thiazol-2-yl, 4-(4-methoxyphenyl)thiazol-2-yl, 4-(2-methoxyphenyl)thiazol-2-yl, 4-(4-trifluoromethyl) phenyl)thiazol-2-yl, 4-(3-trifluoromethyl)phenyl)thiazol-2-yl, 4-(4-fluorophenyl)thiazol-2-yl, 5-methyl-4-phenylthiazol-2-yl, 5-phenyl-1,3,4-oxadiazol-2-yl
Molecular modelling
All the studies were performed on HCL computer with genuine Intel Pentium Dual Core Processor and Windows XP operating system. All the molecules were drawn using ChemSketch (version 12.01) [13] and converted to 3D structures using VLife Molecular Design Suite (MDS) [14] for further analysis. Geometry optimization of molecular structures was performed using Merck Molecular Force Field (MMFF) using Gasteiger charge with maximum number of cycles as 10 000, convergence criteria (root mean square gradient) as 0.01 and constant in dielectric properties (medium’s dielectric constant is 1 for in vacuo) as 1.0. For QSAR study electrostatic and steric energy cutoffs were set to default values of 30.0 and 10.0 kcal/ mol, respectively.
3D-QSAR study
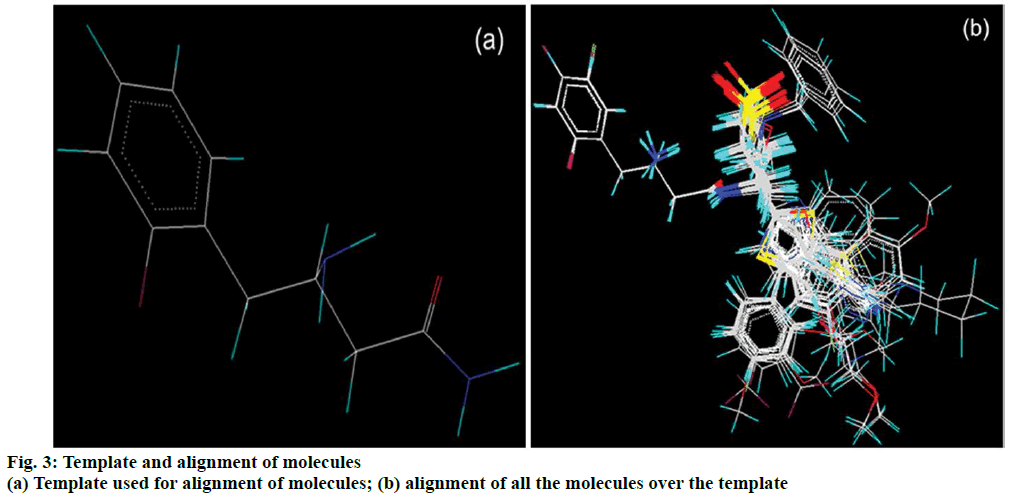
The kNN and partial least squares regression (PLSR) methodologies were employed for 3D-QSAR study. The dataset was aligned by template based alignment method using most common feature present in all molecules as the template (Figure 3). Following molecular alignment, the molecular fields were computed on a grid of points in space around each molecule. This field provides a description of how each molecule will tend to bind in the active site. Descriptors representing steric, electrostatic and hydrophobic interaction energies were computed at lattice points using a methyl probe of charge +1. Descriptor non-redundancy was assured by removing variables having constant values. Genetic algorithm (GA) and simulated annealing (SA) were deployed for selection of appropriate descriptors from a pool of 6000 3D descriptors (2000 each for electrostatic, steric and hydrophobic fields).
Validation of 3D-QSAR models
According to the guidelines laid by Organization for Economic Cooperation and Development (OECD) in 2004, the validity of any QSAR model should be tested according to the following principles (1) a defined end point (2) an unambiguous algorithm (3) a defined domain of applicability (4) appropriate measures of goodness-of-fit, robustness and predictivity and (5) a mechanistic interpretation, if possible. Validation of QSAR models is thus of utmost importance since merely fitting the data does not substantiate good predictive ability as the former parameterizes the statistical quality of the model. Therefore a reliable QSAR model should be able to withstand both internal and external validation. Internal validation ensures the predictability of the models for the compounds employed in model generation but the bigger challenge lies in the predictive ability of the model towards new compounds. For this purpose external validation must be applied. Nevertheless, internal validation is a good foundation for external validation of QSAR models.
Metrics that can serve the above purpose can broadly be classified as r2 based metrics and error based metrics. Some examples of r2 based metrics for internal validation are leave-one-out (LOO) cross validation (LOO-q2), leave-many-out (LMO) cross validation (LMO-q2), bootstrapping (Boot-q2) [15], Trueq2 [16], and the rm2 metric for internal validation [17]. while for external validation predicted r2 (or q(F1) 2), q(F2) 2 [18], q(F3) 2 [19] Golbraikh and Tropsha’s criteria [20], rm(test)2 and concordance correlation coefficient (CCC) [21]. The results of r2 based metrics are not only dependent on model based predictions but also on other factors like range as well as distribution of the response data around mean, thus making them insufficient for reliable validation. Further some models may be found predictive according to one criterion, but may not be acceptably predictive for other criteria. Thus the models were validated on the basis of more than one criterion and only those models considered predictive by all the used criteria are reported. On the other hand error based metrics may provide more direct information about the prediction errors since they do not compare the prediction errors with other aspects like performance of the mean. The two most commonly used error based metrics in QSAR literature are root mean square error (RMSE) and a similar criterion mean absolute error (MAE) that measure the discrepancies among the experimental values vs. the ones predicted by the model.
In the present communication we have emphasized on external validation of models developed from both kNN and PLSR approaches. The internal validation of present QSAR models was performed by calculation of LOO-q2. For internal and external validation of QSAR models, cross validated correlation coefficient (r2cv or q2) and predictive correlation coefficient (pred_r2) parameters were used respectively. Both can be represented by Eqn. 1.: q2/pred_r2=1–Σ(yi– ŷi)2/Σ(yi–ȳi)2, where, yi=observed activity, ŷi=predicted activity and ȳi=average activity. In Eqn. 1, in case of q2, all the variables belong to training set molecules while in the calculation of pred_r2, yi and ŷi belong to test set. The numerator is the residual sum of squares and the denominator is the total sum of squares.
External validation of QSAR models is a critical tool to appraise their predictive ability for compounds not employed during model development. For external validation the dataset was divided in training and test sets. Based on Y-response the compounds were arbitrarily divided into bins containing active (PIC50>8.00), moderately active (8<PIC50>6) and less active molecules (PIC50<6) and were assigned randomly to training and test set from all the groups. Both r2 based and error based metrics were employed for external validation of developed models. Pred_r2 reflects the degree of correlation of observed and predicted activities. Different formulae for calculation of pred_r2 have been suggested by different research groups.
In Eqn. 1, pred_r2 is also known as q2(F1). Another formula for calculating predictive correlation coefficient is given by Schuurmann et al. (q2(F2)) [18]. The only difference in the formulae for q2(F1) and q2(F2) is that whereas in q2(F1) the ȳ term is the training set mean, in q2(F2) it is the test set mean. A parameter that accounts for the number of training and test set compounds was proposed and termed q2(F3). Although like pred_r2, it is also sensitive to training set selection. For calculation of q2(F3) the residual sum of squares in Eqn. 1 is divided by number of test set compounds while the total sum of squares is divided by training set compounds.
Another simpler criterion that can correlate with the error measures such as RMSE, CCC (ρ ̅c) was used to ascertain the model reliability Eqn. 2., ρ ̅c=2Σni=1(xobs(test)–x ̅obs(test))(ypred(test)–ȳpred(test))/Σni=1(xobs(test)– x ̅obs(test))2+aΣni=1(ypred(test)–ȳpred(test))2 +n(x̅obs(test))–(ȳpred(test)).
In the above equation, xobs(test) and ypred(test) correspond to the observed and predicted values of the test compounds, n is the number of compounds, and x ̅obs(test) and ȳpred(test) correspond to the averages of the observed and predicted values, respectively, for the test compounds. It was demonstrated that as data scattering increases the CCC trend decreases, while RMSEP increases.
Among the two error based metrics, MAE is able to determine the central tendency i.e. average prediction error along with the error dispersion in a more straightforward manner as it does not penalize the difference between observed and predicted activities as in RMSE Eqn. 3., MAE=1/n×Σ|yobs–ypred|.
Therefore, Roy et al. [22] have considered MAE to be a better index of errors in the context of predictive modelling studies. Thus according to the method proposed by Roy et al. [22] the models were analysed for their predictive ability based on MAE based criteria. The robustness of the models was confirmed by Y-randomization. For this purpose response variables in the data set were scrambled and random models were generated with this data. Probability (α) and z score of significance of randomization were calculated to ascertain that there is no chance correlation.
Even after successful external validation of the QSAR models, they cannot be employed to just any of the compounds in the chemical universe. Therefore reliability for confident prediction of new compounds is based on the model’s applicability domain (AD). The AD is a theoretical region in chemical space, defined by the model descriptors and modelled response and thus by the nature of the chemicals in the training set, as represented in each model by specific molecular descriptors [23]. Only the compounds that fall within the AD of the models can be confidently predicted. AD of a model can be determined by various methods, which may vary among datasets and thus none of them can be considered universal. Considering the need of sophisticated software and calculation of different parameters required for above methods, a simple method for determination of AD through standardization approach was reported recently [24]. According to this approach all the descriptors of the model are standardized using Eqn. 4., Ski=|Xki –X ̅i|/ σXi, where, k=1, 2, 3…nComp (nComp = total number of compounds), i=1, 2, 3…nDes (nDes=total number of descriptors), Ski=standardized descriptor i for compound k (from the training or test set), Xki=original descriptor i for compound k (from the training or test set) Xi=mean value of the descriptor Xi for the training set compounds only, σXi=standard deviation of the descriptor Xi for the training set compounds only. This is followed by computing the maximum Si(k) value ([Si]max(k)) for the compound k. If [Si]max(k) is lower than or equal to 3, then the compound is not an X-outlier (if in the training set) or is within AD (if in the test set). If [Si]max(k) is above 3, then one should compute [Si] min(k). If [Si]min(k)>3, then the compound is an X-outlier (if in the training set) or is not within AD (if in the test set). If [Si]max(k)>3 and [Si]min(k)<3, then one should compute Snew(k) from Eqn. 5: Snew(k)=Sk̅+1.28×σSk , where, Snew(k)=Snew value for the compound k, Sk̅=mean of Si(k) values of the compound k, σSk =standard deviation of Si(k) values of the compound k. If the calculated Snew(k) is lower than or equal to 3, then the compound is not an X-outlier (if in the training set) or is within AD (if in the test set).
Molecular docking study
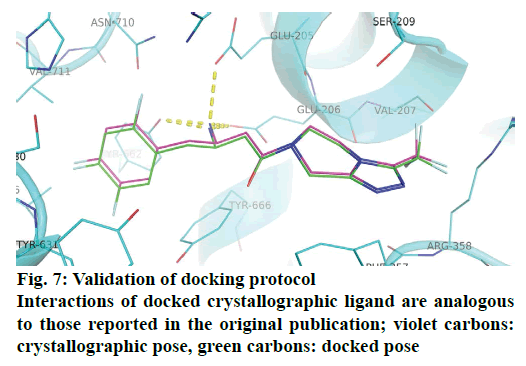
Molecular docking studies were carried out using python prescription (PyRx) [25] which uses AutoDock Vina [26] as docking tool. The results of docking were visualized using PyMol [27]. The crystal structure of DPP-IV in complex with a peptidomimetic inhibitor sitagliptin was retrieved from protein data bank (PDBID:1X70). Protein preparation steps prior to docking involved removal of crystallographic water molecules, addition of polar hydrogens, inspection for any missing atoms, assigning kollman charges and removal of all crystallographic ligands. Nine docked poses were generated for each ligand within the grid of 31×32×32Å around the active site (covering residues within 4 Å of the crystallographic ligand). The docking protocol was validated by reproducing the binding interactions of crystallographic ligand.
Results and Discussion
A series of 3-amino-N-substituted-4-(substituted phenyl) butanamides was subjected to kNN and PLSR based 3D-QSAR approaches and molecular docking for exploration of structural requirements in order to achieve better DPP-IV inhibitory activity. The predictor variables for 3D-QSAR were selected using GA and SA. Several models were developed by various combinations of training and test sets and the corresponding most significant kNN and PLSR models are discussed. The models were thoroughly checked for their internal and external predictivity through both regression and error based methods. Molecular docking was performed using a grid covering residues within 4Å of the bound ligand. A discussion of results of both 3D-QSAR and docking study is as follows: The results of kNN-QSAR model are kNN=2, Ntraining=36, Ntest=12, q2=0.6723, q2_se=0.5454, pred_r2=0.8254, pred_r2se=0.4489.
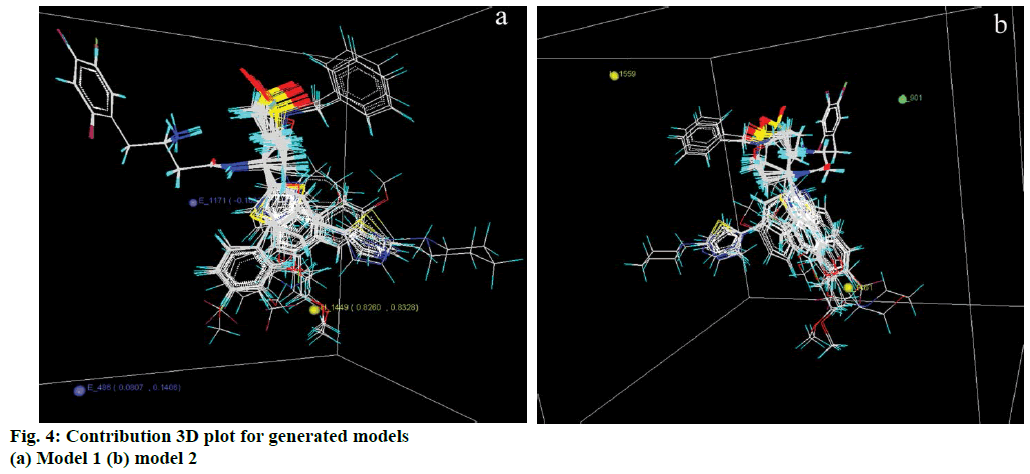
The variable selection method applied for generation of this model was SA. It encompasses contribution from two electrostatic and one hydrophobic field points (Figure 4a). According to this model the positive range of hydrophobicity at 1449 shows that increase in hydrophobicity around this point will favour the DPPIV inhibitory activity. This is evident from compounds 12t-12x, which show their activities on the higher side of the dataset. Electrostatic field at lattice point 486 has a positive range, which indicates the need of less electronegative group around this point (c.f. compounds 29-38) whereas at 1171 it has a negative range, which indicates the need of more electronegative functional group at or around this point. E 1171 is situated in the vicinity of substituted butanamide group and is common for all the compounds. It can thus be presumed as a necessary structural feature for the biological activity of the dataset.
The results of PLSR-QSAR model were pIC50=1.55806–6.7719H_1559+3.6231H_1461– 58.1791S_901, Ntraining=36, Ntest=12, r2=0.7597, r2_ se=0.4732, q2=0.6929, q2_se=0.5349, Pred_r2=0.7776, pred_r2se =0.5057.
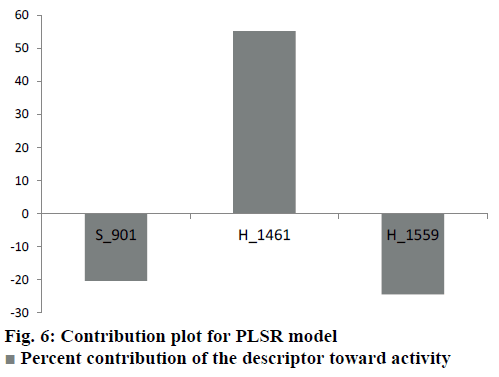
Generated through GA variable selection this model involves contribution of two hydrophobic and one steric field points (Figure 4b). The negative coefficient of hydrophobic field at 1559 implies that less hydrophobic group will be favourable for better biological activity. This effect is apparent in compounds 12a, 12b and 12c, which have N-benzyl ring around this point. On the other side positive value of hydrophobic field at 1461 is favourable for biological activity as in compounds 12u, 12v, 12w and 12x. Steric field at S_901 has a negative coefficient value indicating the negative contribution of steric bulk towards the biological activity. It follows that less bulky groups are favourable around this point. The descriptors and their ranges (for kNN-MFA) and coefficients (for PLSR) are provided in Table 2.
| Parameters | kNN-MFA | PLSR | ||
|---|---|---|---|---|
| Training set size (n) | 36 | 36 | ||
| Test set size | 12 | 12 | ||
| K nearest neighbourk | 2 | - | ||
| Degree of freedom | 32 | 34 | ||
| Descriptor rangek/coefficientP | E_486 H_1449 E_1171 |
0.0806610.140629 0.826020.832793 -0.103295-0.063776 |
H_1559 H_1461 S_901 |
-6.7719 3.6231 -58.1791 |
Table 2: The Most Optimized Statistically Significant Models
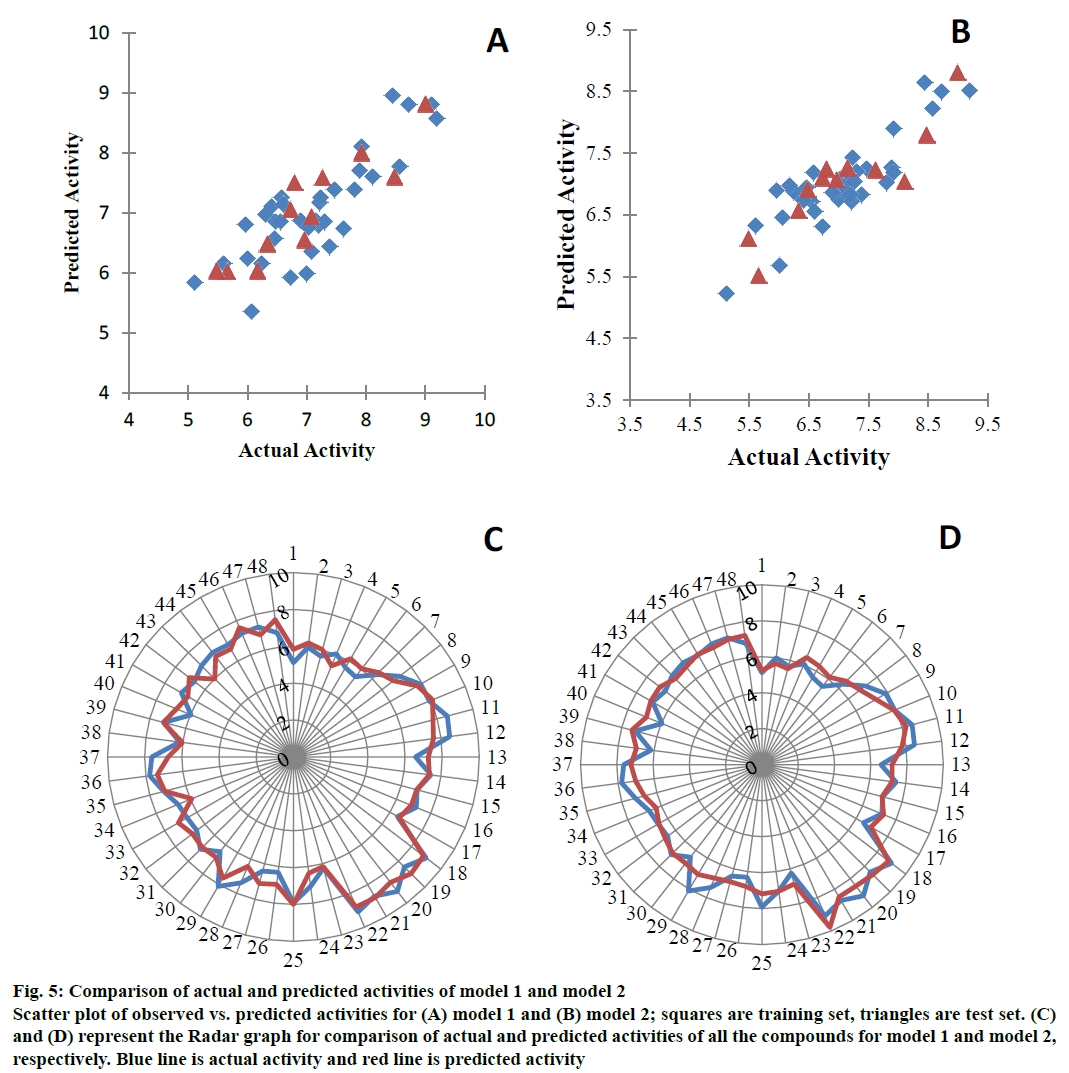
Different parameters on which the models were evaluated internally and externally along with their acceptable values are presented in Table 3. The kNNMFA model has an internal (q2) and external (pred_r2) predictive ability of ~67 % and ~82 %, respectively while the best PLSR model shows ~70 % of internal and ~78 % of external predictivity. Figure 5 represents a graph between the actual and predicted activities and Table 4 lists the actual and predicted values of the dataset compounds along with residuals. The contribution of the descriptors of PLSR model towards the activity is shown in Figure 6.
| Parameters | kNN-MFA | PLSR | ||||
|---|---|---|---|---|---|---|
| r2P | - | 0.7597 | ||||
| q2 | 0.6723 | 0.6929 | ||||
| F-testP | - | 107.5078 | ||||
| r2_seP | - | 0.4732 | ||||
| q2_se | 0.5454 | 0.5349 | ||||
| Pred_r2 | 0.8254 | 0.7776 | ||||
| Pred_ r2se | 0.4489 | 0.5075 | ||||
| Z-Zcore | r2 q2 Pred_r2 |
- 3.2817 1.18 |
r2 q2 Pred_r2 |
8.63915 7.38326 2.95 |
||
| Best rand r2P | - | 0.5347 | ||||
| Best rand q2 | - | 0.4362 | ||||
| Best rand pred_r2 | - | 0.4901 | ||||
| Alpha rand r2P | - | 0.00 | ||||
| Alpha rand q2 | - | 0.00 | ||||
| Alpha rand pred_r2 | - | 0.01 | ||||
| Q2F2 | 0.8252 | 0.7773 | ||||
| Q2F3 | 0.7907 | 0.64692 | ||||
| CCC | 0.8948 | 0.8579 | ||||
| 100% data | 95% data# | 100% data | 95% data# | |||
| MAE | 0.3580 | 0.3105 | 0.4025 | 0.3192 | ||
| MAE+3×SD (95% data) |
0.8967 | 0.9505 | ||||
Table 3: Validation Parameters for Models
| Compound | PIC50 | ||||
|---|---|---|---|---|---|
| Actual | kNN-MFA | PLSR | |||
| Predicted | Residual | Predicted | Residual | ||
| 12a | 5.11 | 5.84 | -0.73 | 5.23 | -0.12 |
| 12b | 6.00 | 6.24 | -0.24 | 5.68 | 0.32 |
| 12c | 5.66 | 6.03T | -0.37T | 5.52T | 0.14T |
| 12d | 6.06 | 5.35 | 0.71 | 6.46 | -0.40 |
| 12e | 5.60 | 6.15 | -0.55 | 6.32 | -0.72 |
| 12f | 5.48 | 6.03T | -0.55T | 6.12T | -0.64T |
| 12g | 6.24 | 6.15 | 0.09 | 6.87 | -0.63 |
| 12h | 6.33 | 6.48T | -0.15T | 6.57T | -0.24T |
| 12i | 6.72 | 5.92 | 0.80 | 6.31 | 0.41 |
| 12j | 7.19 | 6.79 | 0.40 | 6.82 | 0.37 |
| 12k | 7.89 | 7.71 | 0.18 | 7.26 | 0.63 |
| 12l | 7.92 | 8.10 | -0.18 | 7.89 | 0.03 |
| 12m | 8.57 | 7.77 | 0.80 | 8.22 | 0.35 |
| 12n | 8.48 | 7.60T | 0.88T | 7.80T | 0.68T |
| 12o | 6.57 | 7.26 | -0.69 | 7.18 | -0.61 |
| 12p | 7.46 | 7.38 | 0.08 | 7.24 | 0.22 |
| 12q | 6.89 | 6.87 | 0.02 | 6.85 | 0.04 |
| 12r | 7.15 | 6.87 | 0.28 | 7.26T | -0.11T |
| 12s | 6.46 | 6.58 | -0.12 | 6.93 | -0.47 |
| 12t | 9.00 | 8.82T | 0.18T | 8.81T | 0.19T |
| 12u | 8.44 | 8.95 | -0.51 | 8.64 | -0.20 |
| 12v | 9.19 | 8.58 | 0.61 | 8.51 | 0.68 |
| 12w | 8.72 | 8.81 | -0.09 | 8.49 | 0.23 |
| 12x | 9.10 | 8.81 | 0.29 | 9.78 | -0.68 |
| 18 | 7.08 | 6.36 | 0.72 | 7.10 | -0.02 |
| 19 | 7.92 | 8.00T | -0.08T | 7.19 | 0.73 |
| 20 | 6.31 | 6.97 | -0.66 | 6.83 | -0.52 |
| 21 | 6.41 | 7.11 | -0.70 | 6.74 | -0.33 |
| 22 | 7.39 | 6.43 | 0.96 | 6.82 | 0.57 |
| 23 | 8.11 | 7.60 | 0.51 | 7.05T | 1.06T |
| 24 | 6.48 | 6.85 | -0.37 | 6.91T | -0.43T |
| 25 | 7.08 | 6.94T | 0.14T | 6.96 | 0.12 |
| 26 | 6.55 | 6.85 | -0.30 | 6.72 | -0.17 |
| 27 | 6.60 | 7.14 | -0.54 | 6.56 | 0.04 |
| 29 | 7.22 | 7.16 | 0.06 | 6.71 | 0.51 |
| 30 | 7.80 | 7.39 | 0.41 | 7.02 | 0.78 |
| 31 | 7.62 | 6.73 | 0.89 | 7.23T | 0.39T |
| 32 | 6.17 | 6.03T | 0.14T | 6.98 | -0.81 |
| 33 | 7.23 | 7.25 | -0.02 | 7.42 | -0.19 |
| 34 | 5.96 | 6.81 | -0.85 | 6.90 | -0.94 |
| 35 | 6.96 | 6.55T | 0.41T | 7.07 | -0.11 |
| 36 | 6.72 | 7.06T | -0.34T | 7.10T | -0.38T |
| 37 | 7.00 | 5.98 | 1.02 | 6.75 | 0.25 |
| 38 | 7.14 | 6.87 | 0.27 | 6.86 | 0.28 |
| 39 | 7.03 | 6.76 | 0.27 | 7.08 | -0.05 |
| 40 | 7.26 | 7.59T | -0.33T | 7.04 | 0.22 |
| 41 | 7.30 | 6.85 | 0.45 | 7.20 | 0.10 |
| 42 | 6.80 | 7.51T | -0.71T | 7.25T | -0.45T |
Table 4: Observed and Predicted Activities of Statistically Significant 3d-Qsar Models
Figure 5: Comparison of actual and predicted activities of model 1 and model 2
Scatter plot of observed vs. predicted activities for (A) model 1 and (B) model 2; squares are training set, triangles are test set. (C) and (D) represent the Radar graph for comparison of actual and predicted activities of all the compounds for model 1 and model 2, respectively. Blue line is actual activity and red line is predicted activity
The values of r2 based coefficients for the models suggest that both survive the more stringent criteria for external validation. Therefore they can be expected to provide reliable predictions for unknown compounds. Robustness of both the models for experimental training and test sets was examined by comparing the model to those derived for random data sets (z scores) and the models were found to have better validation statistics than their random counterparts. The models were also evaluated on the basis of MAE based criteria. The MAE based criteria proposed by Roy et al. [22] implies that an error of 10 % of the training set range should be acceptable while an error value more than 20 % of the training set range should be a very high error. Although no suitable threshold can be determined for error based metrics unlike r2 based criteria, mean ±3σ covers 99.7 % an area where most of the observations belong. Here σ is the standard deviation of the absolute error values for the test set data. Thus, for good predictions MAE≤0.1×training set range and MAE+3×σ≤0.2×training set range (Eqn. 6) and for bad predictability MAE>0.15×training set range or MAE+3×σ≤0.2×training set range (Eqn. 7). This implies that an MAE between 0.1 and 0.15 and MAE±3σ between 0.2 and 0.25 may represent moderate predictivity of the models. This connotation provides a good criterion for model selection. Further, according to the proposed guideline for determination of quality of MAE based predictions, MAE was calculated for 95 % data points after omitting 5 % high residual data points in order to obviate the influence of any high prediction errors that may significantly obscure the quality of predictions for the whole data set. On the basis of the above MAE based norms; both the models are expected to perform moderately for new compounds.
The AD determined by standardization approach predicted 37 as outlier (training set) for kNN-MFA as its Snew(k) value is greater than the stipulated value of 3. Similarly 12b is an outlier (training set) and 12c is outside AD of PLSR model (test set) on the basis of their Snew(k) values.
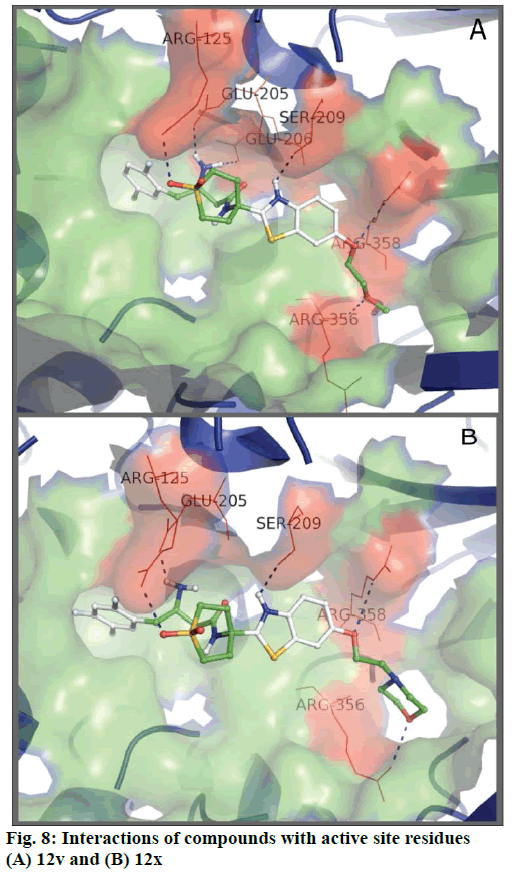
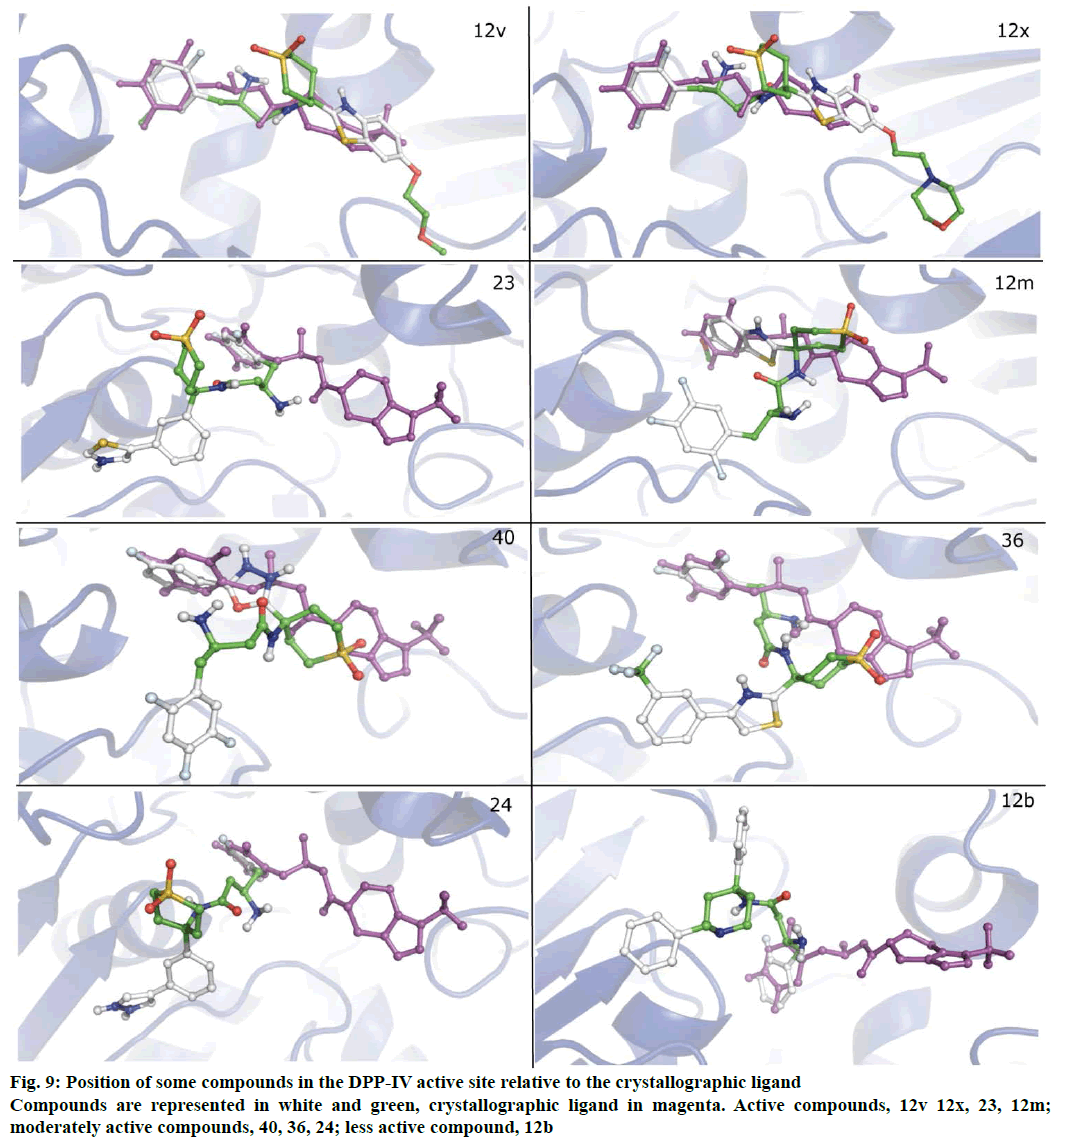
Molecular docking studies were performed to explore binding orientation of compounds in the DPPIV active site. This was expected to allow for the deduction of prospective interactions of compounds with the active site amino acid residues and their correlation with biological activity. The active site of DPP-IV is composed of three major sub-sites S1, S2 and S2 extensive. The S1 pocket is very small and can accommodate only small substitutions or rings. Interactions with S2 involve formation of salt bridge with GLU205 and GLU206 while interactions with residues lining S2 extensive impart stability to the complex [28]. The compounds from active, moderately active and less active classes exhibited different binding patterns. Whereas the active compounds such as 12x and 12v occupied similar space as the crystallographic ligand (sitagliptin); the binding modes of compounds from moderately active and inactive classes were distinct from the latter. The superimposition of the docked crystallographic ligand with its experimental orientation is depicted in Figure 7.
Compound 12x exhibited the best value of binding energy amongst actives whereas compound 40 was at the top among moderately actives (binding energy lowest amongst the whole dataset), while 12b with value of –9.4 exhibited good binding affinity. However 12v did not show a binding affinity as good as others amongst actives, it exhibited favourable interactions over other less active compounds. Thus the values of binding affinity vaguely correlated themselves with activity but binding poses of active molecules may advocate their discrimination from moderately active or inactive compounds. As evident from kNN-MFA the electrostatic field point at 1171 holds a negative range and is near the 3-amino butanamide moiety. Thus it may be involved in important interactions forming the salt bridge with side chain carboxyl oxygen of GLU205 and GLU206. The electrostatic field at 486 is positive and the substituted phenyl rings of compounds 29-38 flank around this point (R3) thus interactions between the side chains and polar amino acids of the active site may be probable. The binding energies of the representatives of active, moderately active and less active classes are shown in Table 5 and the interactions of compounds 12x and 12v with DPP-IV active site are presented in Figure 8.
| Compound | Binding affinity (kcal/mol) | Polar Interactions |
|---|---|---|
| 12v | -8.7 | ARG125, GLU205, GLU206, SER209, ARG356, ARG358 |
| 12x | -9.8 | ARG125, GLU205, SER209, ARG356, ARG358 |
| 40 | -10.3 | ARG125, GLU205, TYR547, SER630 |
| 12b | -9.5 | ARG125, TYR547 |
| Crystallographic ligand (sitagliptin) | -9.9 | GLU205, GLU206, TYR662 |
Table 5: Molecular Docking Studies of Some Dataset Compounds
The PLSR model portrays the involvement of one steric and two hydrophobic descriptors. The hydrophobic field point at 1317 has a negative coefficient and is located near R3 of 12a-12d which possess N-benzyl or N-methyl group which flank around this point. As can be seen in Figure 9, N-benzyl ring of 12b is occupying the S1 pocket making it difficult for the 3-amino group to form interactions in the S2 subsite. This may elucidate the low biological activity of related compounds. On the other hand H_1461 with its positive coefficient is in the vicinity of side chains of some of the highly active compounds (12t-12x), thus indicating the favour of hydrophobicity towards the biological activity. These side chains extend towards the farther end of the active site having fewer interactions. Thus the higher activity may be attributed to their ability to effectively penetrate the cell membrane. S_901 is located near the substituted phenyl ring proving the importance of steric contribution over its electrostatic and hydrophobic counterparts in the S1 pocket. With regard to the above discussion results of 3D-QSAR and molecular docking appear to be in agreement with each other.
DPP-IV plays a major role in the onset of T2DM. The DPP-IV inhibitory activities of diverse scaffolds have encouraged researchers around the globe to find new possibilities in the quest for effective diabetes management. The present study is an effort to establish 3D-QSAR on a series of substituted 3-aminobutanamide derivatives for their DPP-IV inhibitory activity. Binding patterns of the dataset compounds were determined through molecular docking studies. The most significant kNN-MFA and PLSR models exhibited ~82 % and ~78 % external predictability, respectively. Both the models withstand more stringent criteria for external validation such as q2(F2), q2(F3), CCC and MAE based criteria and are robust according to z score. Accordingly, both the models can predict the activities of hitherto untested compounds with 95 % confidence within their AD. The molecular docking studies show that active compounds occupied a similar space in the active site as the crystallographic ligand (sitagliptin) while the binding modes of compounds from moderately active and inactive classes were different, thus providing confidence in the prediction of binding pattern. It follows that kNN-MFA (and PLSR) models in combination with molecular docking may be applied for further exploration of active compounds.
Conflict of interest
The authors declare that they have no conflict of interest.
Financial support and sponsorship
Nil.
References
- http://www.diabetesatlas.org.
- Moller DE. New drug targets for type 2 diabetes and the metabolic syndrome. Nature 2001;414:821-7.
- Deacon CF. Dipeptidyl peptidase-IV inhibitors in the treatment of type 2 diabetes: A comparative review. Diabetes ObesMetab 2011;13:7-18.
- Patel BD, Ghate MD. Recent approaches to medicinal chemistry and therapeutic potential of dipeptidyl peptidase-IV (DPP-IV) inhibitors. Eur J Med Chem 2014;74:574-605.
- Kjems LL, Holst JJ, Vølund A, Madsbad S. The influence of GLP-1 on glucose-stimulated insulin secretion: Effects on β-Cell sensitivity in type 2 and nondiabetic subjects. Diabetes 2003;52:380-6.
- Ehses JA, Casilla VR, Doty T, Pospisilik JA, Winter KD, Demuth HU, et al. Glucose-dependent insulinotropic polypeptide promotes β-(INS-1) cell survival via cyclic adenosine monophosphate-mediated caspase-3 inhibition and regulation of p38 mitogen-activated protein kinase. Endocrinology 2003;144:4433-45.
- Farilla L, Bulotta A, Hirshberg B, Li Calzi S, Khoury N, Noushmehr H, et al. Glucagon-like peptide 1 inhibits cell apoptosis and improves glucose responsiveness of freshly isolated human islets. Endocrinology 2003;144:5149-58.
- Helguera AM, Combes RD, Gonzalez MP, Cordeiro MN.Applications of 2D descriptors in drug design: a DRAGON tale. Curr Top Med Chem 2008;8:1628-55.
- Mitra I, Saha A, Roy K. Development of multiple QSAR models for consensus predictions and unified mechanistic interpretations of the free-radical scavenging activities of chromone derivatives. J Mol Model 2012;18:1819-40.
- Verma J, Khedkar VM, Coutinho EC. 3D-QSAR in drug design - a review. Curr Top Med Chem 2010;10:95-115.
- Nitta A, Fujii H, Sakami S, Nishimura Y, Ohyama T, Satoh M, et al. (3R)-3-amino-4-(2,4,5-trifluorophenyl)-N-{4-[6-(2 methoxyethoxy)benzothiazol-2-yl] tetrahydropyran-4-yl}butanamide as a potent dipeptidyl peptidase IV inhibitor for the treatment of type 2 diabetes.Bioorg Med ChemLett 2008;18:5435-8.
- Nitta A, Fujii H, Sakami S, Satoh M, Nakaki J, Satoh S, et al. Novel series of 3-amino-N-(4-aryl-1,1-dioxothian-4-yl)butanamides as potent and selective dipeptidyl peptidase IV inhibitors. Bioorg Med ChemLett 2012;22:7036-40.
- http://www.acdlabs.com/products/com_iden/elucidation/struc_eluc/.
- www.vlifesciences.com.
- Wehrens R, Putter H, Buydens LMC. The bootstrap: a tutorial. ChemomInt Lab Syst 2000;54:35-52.
- Hawkins DM, Basak SC, Mills D. Assessing model fit by cross-validation. J ChemInfComputSci 2003;43:579-86.
- Roy K, Mitra I, Kar S, Ojha PK, Das RN, Kabir H. Comparative studies on some metrics for external validation of QSPR models. J ChemInf Model 2012;52:396-408.
- Schuurmann G, Ebert RU, Chen J, Wang B, Kühne R. External validation and prediction employing the predictive squared correlation coefficient-Test-set activity mean vs training set activity mean. J ChemInf Model 2008;48:2140-5.
- Consonni V, Ballabio D, Todeschini R. Evaluation of model predictive ability by external validation techniques. J Chemometrics 2010;24:194-201.
- GolbraikhA, TropshaA. Beware of q2! J Mol Graph Model 2002;20:269-76.
- Chirico N, Gramatica P. Real External predictivity of QSAR models: How to evaluate it? Comparison of different validation criteria and proposal of using the concordance correlation coefficient. J ChemInf Model 2011;51:2320-35.
- Roy K, Das RN, Ambure P. Be aware of error measures: Further studies on validation of predictive QSAR models. ChemometrIntell Lab 2016;152:18-33.
- Gramatica P. Principles of QSAR models validation: internal and external. QSAR Comb Sci 2007; 26:694-701.
- Roy K, Kar S, Ambure P. On a simple approach for determining applicability domain of QSAR models. ChemometrIntell Lab 2015;145:22-9.
- Dallakyan S, Olson AJ. Small-molecule library screening by docking with PyRx. Methods MolBiol 2015;1263:243-50.
- Trott O, Olson AJ. AutoDockVina: improving the speed and accuracy of docking with a new scoring function, efficient optimization and multithreading. J ComputChem 2010;31:455-61.
- http://pymol.sourceforge.net/overview/index.htm.
- Nabeno M, Akahoshi F, Kishida H. A comparative study of the binding modes of recently launched dipeptidyl peptidase IV inhibitors in the active site. BiochemBiophys Res Commun2013;434:191-6.
