- *Corresponding Author:
- N. Mallikarjuna Rao
Department of Pharmaceutical Sciences, Jawaharlal Nehru Technological University, Kakinada-533 003, India
E-mail: mallimpharmmba@gmail.com
| Date of Submission | 06 Dec 2015 |
| Date of Revision | 29 Feb 2016 |
| Date of Acceptance | 04 Apr 2016 |
| Indian J Pharm Sci, 2016;78(2):217-223 |
Abstract
A Simple, accurate, specific and rugged reverse phase liquid chromatographic method was developed for the simultaneous estimation of atenolol, lisinopril, aspirin and simvastatin in bulk and tablet dosage form. A reverse phase gradient program has been developed to separate all the four active ingredients. A gradient programming has been done using 0.05M Phosphate buffer pH 2.5 adjusted with dilute phosphoric acid, acetonitrile in the ratio 70:30 from 0 min to 10 min, further increase the acetonitrile ratio from 30 to 70 from 10 min to 20 min, on a reverse phase C8 column (250×4.6 mm, 5 µ) with a flow rate 1 ml/min, monitored at 232 nm. The mean retention times of atenolol, lisinopril, aspirin and simvastatin were found to be 3.9, 5.8, 9.5 and 18.3min, respectively. The linearity was established for atenolol 12.5 to 75 µg/ml, lisinopril 2.5 to 15 µg/ml, aspirin 18.75 to 112.5 µg/ml, simvastatin 5 to 30 µg/ml. The proposed method was validated in terms of linearity, range, accuracy, precision, specificity, robustness and ruggedness and the method was successfully applied to the estimation of atenolol, lisinopril, aspirin and simvastatin in combined tablet dosage form.
Keywords
Atenolol, lisinopril, aspirin, simvastatin, HPLC-DAD, tablet
Atenolol (Tenormin) belongs to a group of drugs called β-blockers. β-blockers have an effect on the heart and circulation of blood flow through arteries and veins. It is used to treat angina (chest pain) and hypertension (high blood pressure). It is also used to treat or prevent heart attack. Lisinopril belongs to a group of drugs called angiotensin-converting- enzyme (ACE) inhibitors. ACE stands for angiotensin converting enzyme. Lisinopril is used to treat high blood pressure (hypertension), congestive heart failure, and to improve survival after a heart attack. Aspirin is a salicylate. It works by reducing substances in the body that cause pain, fever, and inflammation. Aspirin is used to treat pain, and reduce fever or inflammation. It is sometimes used to treat or prevent heart attacks, strokes, and chest pain (angina).
Simvastatin belongs to a group of drugs called HMG CoA reductase inhibitors, or "statins." It reduces levels of "bad" cholesterol (low-density lipoprotein, or LDL) and triglycerides in the blood, while increasing levels of "good" cholesterol (high-density lipoprotein, or HDL). Simvastatin is used to lower cholesterol and triglycerides (types of fat) in the blood. Simvastatin is also used to lower the risk of stroke, heart attack, and other heart complications in people with diabetes, coronary heart disease, or other risk factors.
Atenolol, lisinopril, aspirin and simvastatin are now among the most frequently prescribed agents for reducing morbidity and mortality related to cardiovascular diseases and analysis of these drugs is a current problem. The major therapeutic action of statin drugs is reduction of circulating atherogenic lipoproteins as a result of inhibition of 3-hydroxy- 3-methylglutaryl coenzyme A (HMG-CoA) reductase [1]. The key enzyme catalyzes the conversion of HMG-CoA to mevalonate, a critical intermediary in the cholesterol biosynthesis. This mechanism was discovered in 1976, when Endo and co-workers isolated a compound mevastatin from Penicillium citrinum that exhibited cholesterol-lowering effects [2]. Clinical studies have shown that these drugs significantly reduce the risk of heart attack and death in patients with proven coronary artery disease, and can also reduce cardiac events in patients with high cholesterol levels [3]. Beside lipid-lowering activity, statins improve endothelial function, maintain plaque stability and prevent thrombus formation. There is also an increased interest in statins nonlipid activities such as an anti-inflammatory action [3-8].
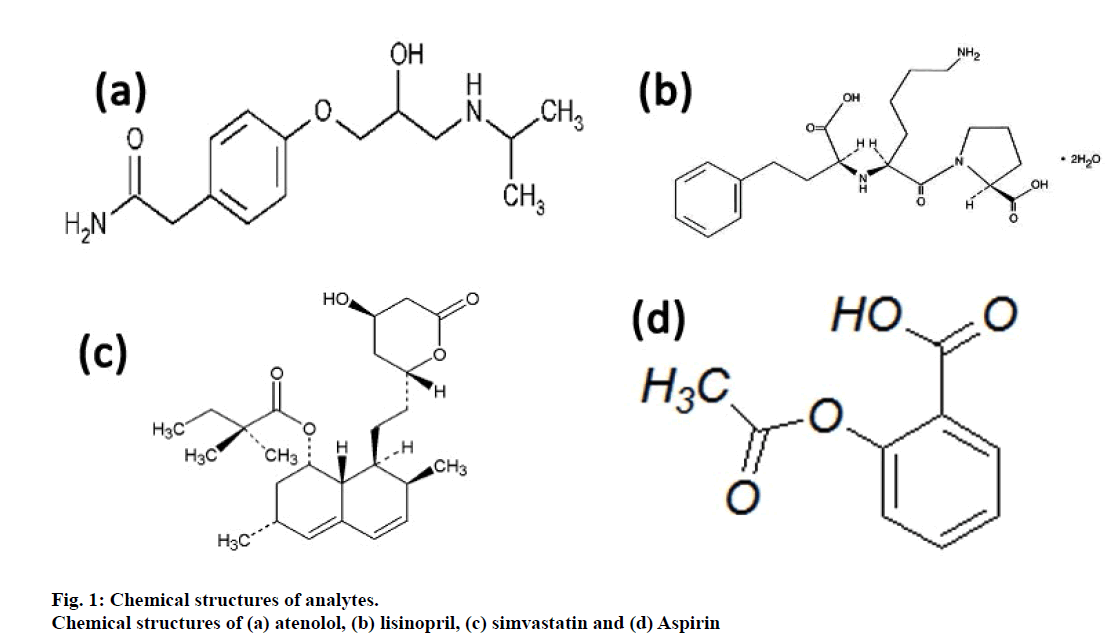
A variety of chromatographic methods were developed to resolve drugs and their related impurities in the bulk drug forms and pharmaceutical formulations. About all methods used for the severance of drugs are based on high performance liquid chromatography. In drug industry UV detection was most commonly used. This approach to the analysis was chosen most probably because drugs are not used in combination with other molecules during therapy (rationale for the development of new method in comparison to existing methods is not included). The chemical structures of the atenolol, lisinopril, aspirin and simvastatin are shown in fig 1.
Materials and Methods
Pharmacopoeia grade working standards of atenolol, lisinopril, aspirin and simvastatin were obtained as a gift from Mylan laboratories, Hyderabad, India. Fixed dosage combination tablet containing 50 mg atenolol, 10 mg lisinopril, 75 mg aspirin and 20 mg simvastatin was purchased from local market Hyderabad, India. All the chemicals were HPLC grade purchased from S. D. Fine-Chem Ltd., Mumbai. MilliQ water was used.
Waters e 2695 series HPLC consisting pump, Auto sampler, Auto injector, VWD and photodiode array detector, thermostatic column compartment connected with Empower 2 software connected with a Hypersil BDS C8 250×4.6 mm, 5 μ, 100 A.
Mobile phase
Potassium dihydrogen orthophosphate (6.8 g) was weighed and dissolved in 1000 ml of water. The pH was adjusted to 2.5 using dilute phosphoric acid. The solution is filtered through 0.22 μ nylon filter and sonicated to degas it. The buffer is considered as mobile phase A and acetonitrile was considered as mobile phase B. A gradient program represented in Table 1 was used to elute the analytes maintained at 30º and detection was carried out at 232 nm with an injection volume of 20 μl.
| Time (min) | Mobile Phase A | Mobile Phase B | |
|---|---|---|---|
| 0 | 70 | 30 | Isocratic |
| 10 | 30 | 70 | Linear gradient |
| 20 | 30 | 70 | Linear gradient |
| 30 | 30 | 70 | Isocratic |
| 35 | 70 | 30 | Isocratic |
Table 1: Gradient Table
Standard solution preparation
An equivalent of 50 mg of atenolol, 10 mg lisinopril, 75 mg aspirin and 20 mg simvastatin were weighed and dissolved in 100 ml volumetric flask, 60 ml of mobile phase was added and dissolved, further made the volume with mobile phase. Further dilutions were made from this stock solution.
Sample preparation
Twenty tablets were weighed and crushed and transferred the 100 mg tablet powder in to 100 ml volumetric flask. 60 ml of mobile phase, sonicated for 10 min to dissolve. Further volume was made with mobile phase. The resulting solution was filtered through 0.22 μ filter. Working standard of the analytes was prepared from the above solution.
Results and Discussion
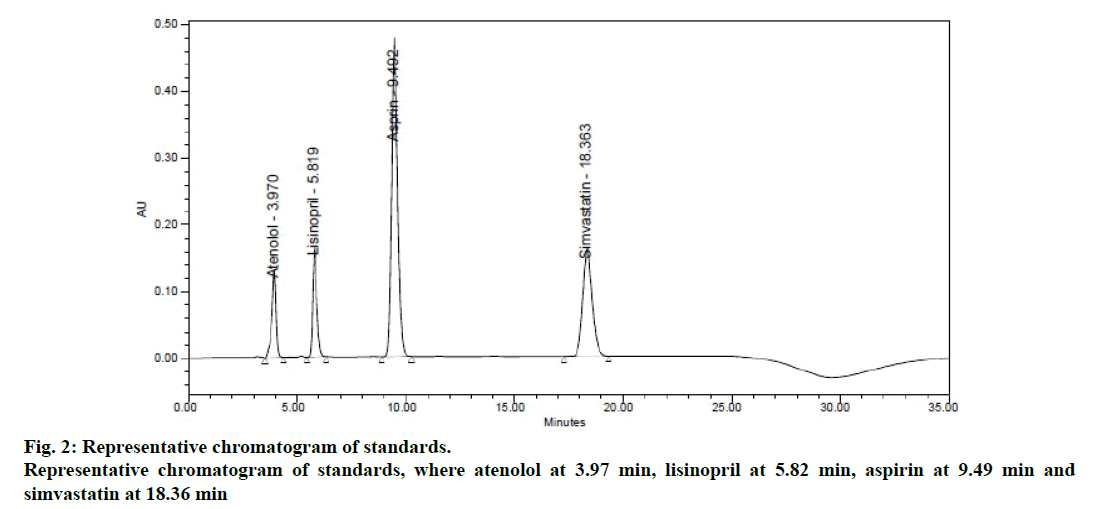
In order to achieve good separation between all the four components, different buffer pH conditions and different proportions of solvents like methanol, acetonitrile and water containing binary and tertiary eluents. However, in 0.05 M phosphate buffer pH 2.5, pH adjusted with dilute phosphoric acid and acetonitrile achieved good satisfactory results at a flow rate of 1.0 ml/min measured at 232 nm as detection wavelength. The chromatogram of optimized standard mixture are shown in Figure 2.
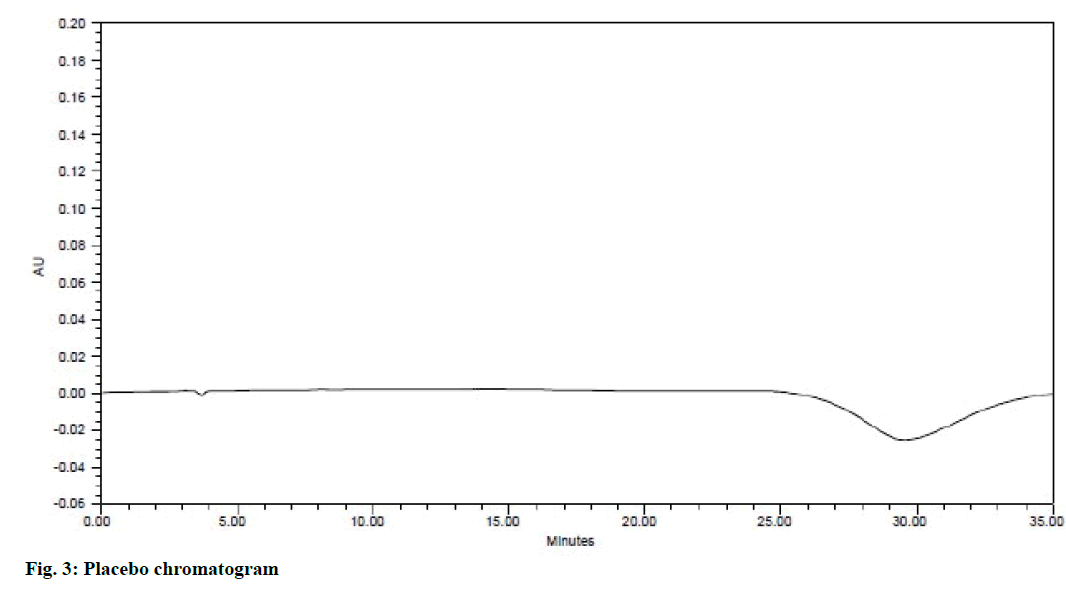
System suitability is an integral part of the method validation to evaluate the parameters like tailing factor, theoretical plates, resolution and % RSD for replicate injections. The results were within the limits and were presented in Table 2 and Figure 2 shows the system suitability chromatogram. In the placebo chromatogram (Figure 3) there were no peaks observed at the retention times of atenolol, aspirin, lisinopril and simvastatin and also the degradation studies showed that there was no interference with degradants, peak purities were found to be >0.99 for the sample solution indicating that the method is specific.
| Parameter | Results | Required limits | |||
|---|---|---|---|---|---|
| Atenolol | Lisinopril | Aspirin | Simvastatin | ||
| RSD of peak area | 0.17 | 0.21 | 0.93 | 0.49 | <1.0 for n≥6 |
| RSD of retention time | 0.06 | 0.03 | 0.02 | 0.01 | <1.0 for n≥6 |
| USP Tailing factor (T) | 0.99 | 1.28 | 1.20 | 1.15 | T < 2 |
| USP Plate Count (N) | 2196 | 4138 | 5168 | 8221 | >2000 |
| USP Resolution (R) | 5.04 | 8.08 | 12.95 | R > 2 | |
Table 2: System Suitability Results
To determine the accuracy of the proposed method, recovery studies were conducted. Known amount of pure drug concentrations was spiked in placebo at three different levels, i.e. 50, 100 and 150% and was calculated. Accuracy was calculated as the percentage of recovery. The results were tabulated in Table 3.
| Parameter | Amount Added (µg) | Amount Recovered (µg) | % of recovery |
|---|---|---|---|
| Atenolol | |||
| 50% level | 25 | 25.16 | 100.64 |
| 100%level | 50 | 49.76 | 99.51 |
| 150%level | 75 | 73.95 | 98.6 |
| Lisinopril | |||
| 50% level | 5 | 4.99 | 99.88 |
| 100%level | 10 | 9.962 | 99.62 |
| 150%level | 15 | 15.12 | 100.8 |
| Aspirin | |||
| 50% level | 37.5 | 37.55 | 100.13 |
| 100% level | 75 | 74.93 | 99.9 |
| 150% level | 112.5 | 112.41 | 99.92 |
| Simvastatin | |||
| 50% level | 10 | 9.975 | 99.75 |
| 100% level | 20 | 19.97 | 99.83 |
| 150% level | 30 | 30.01 | 100.03 |
Table 3: Accuracy Data
Precision was evaluated at three levels, repeatability, reproducibility and intermediate precision. Each level of precision was investigated by six replicate injections of concentrations 50, 10, 75 and 20 μg/ ml atenolol, lisinopril, aspirin and simvastatin, respectively. The result of precision was expressed as % of RSD and was tabulated in Table 4.
| Parameter | RESULTS | |||
|---|---|---|---|---|
| Atenolol | Lisinopril | Aspirin | Simvastatin | |
| Repeatability | ||||
| RSD of Retention time | 0.06 | 0.03 | 0.02 | 0.01 |
| RSD of Peak Area | 0.45 | 0.43 | 0.46 | 0.45 |
| Reproducibility | ||||
| RSD of Retention time | 0.05 | 0.03 | 0.02 | 0.01 |
| RSD of Peak Area | 0.45 | 0.43 | 0.46 | 0.45 |
| Intermediate Precision | ||||
| RSD of Retention time | 0.07 | 0.02 | 0.03 | 0.02 |
| RSD of Peak Area | 0.48 | 0.43 | 0.47 | 0.46 |
Table 4: Precision Studies
Linearity was evaluated by measuring different concentrations (25 to 150%) of the standard solutions to atenolol, lisinopril, aspirin and simvastatin. The calibration curve was constructed by plotting concentration of standard solutions against mean peak areas and the regression equation was computed. The summary of the parameters is shown in Table 5.
| Parameter | Atenolol | Lisinopril | Aspirin | Simvastatin |
|---|---|---|---|---|
| Linearity range (µg/ml) | 12.5 to 75 | 2.5 to 15 | 18.75 to 112.5 | 5 to 30 |
| Correlation co-efficient | 0.999 | 0.999 | 0.999 | 0.999 |
| Slope | 33757 | 22110 | 12637 | 24803 |
| Y-intercept | -21686 | -35913 | -10006 | -65938 |
Table 5: Regression Equation Parameters
Estimation of detection limit (DL) and quantitation limit (QL) considered the acceptable signal-to-noise ratios 3:1 and 10:1, respectively. The limit of detection and quantitation were determined as 0.7546 and 2.2869 μg/ml for atenolol, 1.4089 and 4.2695 μg/ml for lisinopril, 11.2096 and 33.9685 μg/ml for aspirin and 2.9398 and 8.9086 μg/ml for simvastatin, respectively.
The robustness of the method was unaffected when small, deliberate changes like, flow change, mobile phase composition, column temperature were performed at 100% test concentration. The results were shown in Tables 6 and 7.
| Parameter | Variation | Chromatographic Conditions | |||||||
|---|---|---|---|---|---|---|---|---|---|
| Retention time | Area | ||||||||
| ATN | LSP | ASN | SVN | ATN | LSP | ASN | SVN | ||
| Flow Change | 0.9 ml/min | 3.969 | 5.827 | 9.518 | 18.393 | 1731399 | 2184824 | 9461021 | 4943624 |
| 1 ml/min | 3.341 | 5.402 | 8.511 | 17.344 | 1631535 | 2082343 | 8876544 | 3834252 | |
| 1.1 ml/min | 3.005 | 5.058 | 7.908 | 17.533 | 1531342 | 2084323 | 8434534 | 3832344 | |
| Temp. Change | 25° | 3.357 | 5.512 | 7.344 | 18.545 | 1423255 | 2084212 | 8765434 | 3846767 |
| 30° | 3.341 | 5.402 | 8.632 | 18.345 | 1535443 | 2112344 | 8423456 | 3834356 | |
| 35° | 3.339 | 5.499 | 9.435 | 18.453 | 1556877 | 2141445 | 8654332 | 3835345 | |
| Wavelength Change | 230 nm | 3.337 | 5.496 | 8.345 | 17.435 | 1233453 | 2034533 | 8423454 | 3235353 |
| 232 nm | 3.341 | 5.402 | 8.545 | 17.546 | 1238676 | 2084424 | 8476544 | 3563633 | |
| 234 nm | 3.323 | 5.495 | 8.425 | 17.324 | 1223457 | 2083521 | 8465433 | 3345333 | |
Table 6: Robustness Study
| Parameter | Variation | Chromatographic Conditions | |||||||
|---|---|---|---|---|---|---|---|---|---|
| Theoretical Plates | Tailing Factor | ||||||||
| ATN | LSP | ASN | SVN | ATN | LSP | ASN | SVN | ||
| Flow Change | 0.9 ml/min | 2257 | 4303 | 5333 | 8501 | 0.98 | 1.30 | 1.21 | 1.15 |
| 1 ml/min | 2123 | 4243 | 5213 | 7467 | 0.64 | 1.28 | 1.12 | 1.12 | |
| 1.1 ml/min | 2132 | 4212 | 5212 | 7643 | 0.65 | 1.22 | 1.18 | 1.12 | |
| Temp. Change | 25° | 2187 | 4223 | 5243 | 7533 | 0.75 | 1.23 | 1.17 | 1.13 |
| 30° | 2185 | 4223 | 5233 | 7655 | 0.67 | 1.23 | 1.18 | 1.12 | |
| 35° | 2153 | 4243 | 5254 | 7543 | 0.75 | 1.24 | 1.19 | 1.11 | |
| Wavelength Change | 230 nm | 2132 | 4221 | 5224 | 7543 | 0.76 | 1.27 | 1.16 | 1.12 |
| 232 nm | 2143 | 4243 | 5235 | 7554 | 0.78 | 1.28 | 1.20 | 1.14 | |
| 234 nm | 2113 | 4233 | 5243 | 7548 | 0.75 | 1.26 | 1.18 | 1.13 | |
Table 7: Robustness Study
The stability of the standard solution was to test for an interval 24 and 48 h at room temperature. There were no significant changes observed in the system suitable parameters like theoretical plates, tailing factors, retention time and resolution. Hence the standard solution was stable up to 48 h at room temperature.
The stability of the mobile phase was to test for intervals 24 and 48 h at room temperature. There were no significant changes observed in peak areas, theoretical plates, tailing factors, retention time and resolution. Hence the mobile phase was stable up to 48 h at room temperature. The proposed method was applied for the analysis of atenolol, lisinopril, aspirin and simvastatin in tablet dosage forms, the results were found to be between 98 and 100%, and the results were summarized in Table 8.
| Drug | Labeled Amount (mg/tab) |
Amount found (mg/tab) |
% of Assay |
|---|---|---|---|
| Atenolol | 50 | 49.41 | 98.83 |
| Lisinopril | 10 | 9.96 | 99.67 |
| Aspirin | 75 | 74.79 | 99.73 |
| Simvastatin | 20 | 19.92 | 99.61 |
Table 8: Assay Results
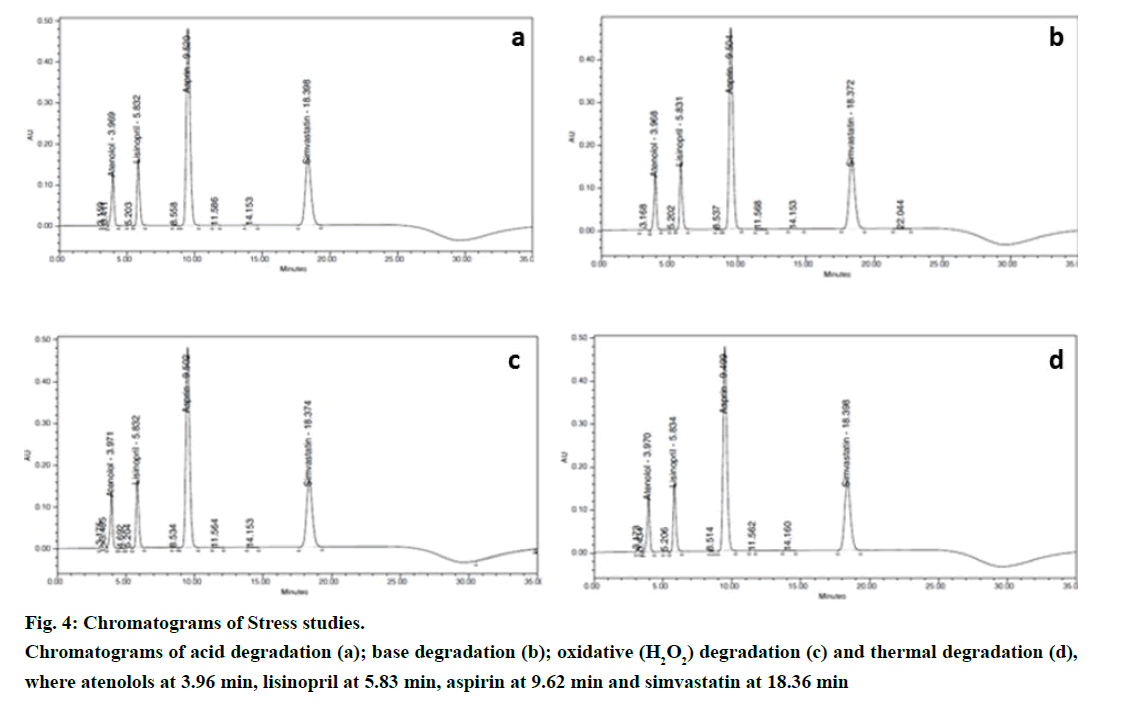
Stress studies were performed at concentrations 500 μg/ml atenolol, 100 μg/ml lisinopril, 750 μg/ml aspirin and 200 μg/ml simvastatin drug substances to provide an indication of the stability indicating property and specificity of the proposed method. Degradation was attempted under stress condition of heat (60º), acid (5.0 N HCl at 27º), base (5.0 N NaOH at 27º) and oxidation (2% H2O2 at 27º) to evaluate the ability of the proposed method to separate analytes from their degradation products. For heat studies, study period was 10 days whereas for acid hydrolysis approximately 40 h; base hydrolysis 30 h and oxidation 2 h. Peak purities of the stressed samples were checked by using PDA detector and the purity angle was found to be within the purity threshold limit in all stressed samples which demonstrates the homogeneity of analyte peak. Assay was calculated for spiked samples of analytes with respect to test concentration. Representative chromatograms of stress studies of various conditions were shown in Figure 4 and Table 9 shows the results of the experiments.
| Atenolol | %Rec | Lisinopril | %Rec | Aspirin | %Rec | Simvastatin | %Rec | |
|---|---|---|---|---|---|---|---|---|
| Acid | 1656065 | 96.42 | 2114192 | 96.98 | 9192434 | 97.7 | 4688306 | 95.31 |
| Base | 1662314 | 96.91 | 2085714 | 96.12 | 8949969 | 95.4 | 4717757 | 96.21 |
| Peroxide | 1662919 | 97.01 | 2106821 | 97.09 | 9008315 | 96.02 | 4747175 | 97.03 |
| Heat | 1596322 | 93.12 | 2072012 | 95.48 | 8866665 | 94.48 | 4660845 | 95.13 |
Table 9: Forced Degradation And Stability
A simple, specific and reliable isocratic HPLC-DAD method was developed for the estimation of atenolol, lisinopril, aspirin and simvastatin in their pharmaceutical formulation. The four compounds were subjected to forced degradation applying several stress conditions. The proposed method was successfully separated all the three compounds with degradants, estimate the active contents. The proposed method is specific and stability-indicating power. Hence the developed method can be adapted to regular quality control analysis.
Acknowledgements
The authors are thankful to Mylan laboratories, Hyderabad for providing standards and lab facilities. The authors are also thankful to Department of Pharmaceutical Analysis, J.N.T. University, Kakinada, Department of Pharmaceutical Analysis and Quality Assurance, Andhra University, Vishakhapatnam, India for encouragement.
Financial Assistance
None.
Conflict of Interests
None declared.
References
- Mc Taggart F, Jones P. Effects of statins on high-density lipoproteins: a potential contribution to cardiovascular benefit. Cardiovascular Drugs Ther 2008;22:321-38.
- Endo A, Kuroda M, Tsujita Y. ML-236A, ML-236B, and ML-236C, New inhibitors of cholesterogenesis produced by Penicillium citrinium. J Antibiot 1976;29:1346-8
- Balk EM, Karas RH, Jordan HS, Kupelnick B, Chew P, Lau J. Effects of statins on vascular structure and function; a systemic review. Am J Med 2004;117:775-90.
- Alberts AW, Chen J, Kuron G, Hunt V, Huff J, Hoffman C, et al. Mevinolin: a highly potent competitive inhibitor of hydroxymethylglutaryl-coenzyme A reductase and a cholesterol-lowering agent. Proc Natl Acad Sci USA 1980;77:3957-61.
- Endo A, Monacolin K. A new hypocholesterolemic agent produced by a Monascus species. J Antibiot 1979;32:852-4.
- Schachter M; Chemical, pharmacokinetic and pharmacodynamic properties of statins: an update. Fund Clin Pharmacol 2005;19:117-25.
- Corsini A, Maggi FM, Catapano AL. Pharmacology of competitive inhibitors of HMG-CoA reductase. Pharmacol Res 1995;34:9-27.
- Murthy RS, Ravi Kumar M, Mallu UR, Bapatu HR. A Simple RP-HPLC method for simultaneous analysis of aspirin, atenolol, hydrochlorothiazide, ramipril and simvastatin in pharmaceutical solid dosage forms. Int J Sci Innov Discov 2012;2:137-51.


