- *Corresponding Author:
- Shital M. Patel
Department of Quality Assurance, Shri Sarvajanik Pharmacy College, Mehsana‑384 001, India
E‑mail: smpatel903@gmail.com
| Date of Submission | 19 April 12 |
| Date of Decision | 06 April 2013 |
| Date of Acceptance | 23 April 13 |
| Indian J Pharm Sci 2013;75(4):413-419 |
Abstract
Keywords
Aspirin, degradation products, HPLC, prasugrel, stability‑indicating method, stress testing
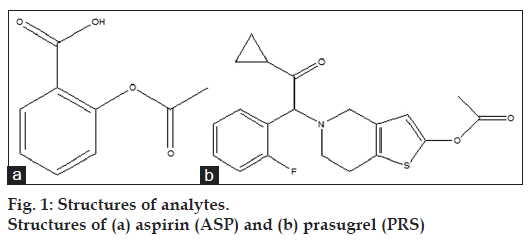
Aspirin (ASP), acetylsalicylic acid (fig. 1), is an antiinflammatory and antiplatelet drug, which is official in many pharmacopoeia which recommends a titrimetric method [1,2] and HPLC [3] for its analysis. Prasugrel (PRS), [(RS)-5‑ [2‑cyclopropyl- 1‑(2‑fluorophenyl)-2‑oxoethyl]‑4,5,6,7‑tetrahydrothieno [ 3,2‑c]pyridin-2‑yl acetate] (fig. 1), is an thienopyridine which inhibits ADP receptors by irreversibly acting on the P2Y12 receptor on platelets and is not official in any pharmacopoeia. The combination formulation is used for the treatment of the reduction of thrombotic cardiovascular events (including stent thrombosis) in patients with acute coronary syndrome. Literature survey reveals that many analytical methods are reported for the determination of PRS [4‑16] and ASP [17,18] individually and aspirin with other antiplatelet drug [19,20]. However, no method is reported for simultaneous estimation of these two drugs by reverse phase HPLC. The International Conference on Harmonization (ICH) guideline entitled “Stability testing of new drug substances and products” requires that stress testing be carried out to elucidate the inherent stability characteristics of the active substance [21]. An ideal stability‑indicating method is one that resolves the drug and its degradation products efficiently. Consequently, the implementation of an analytical methodology to determine PRS and ASP simultaneously, in the presence of its degradation products is rather a challenge for pharmaceutical analyst. Therefore, it was thought necessary to study the stability of ASP and PRS under acidic, alkaline, neutral, oxidative, and UV conditions. This paper reports validated stability‑indicating HPLC method for simultaneous determination of ASP and PRS in the presence of their degradation products. The proposed method is simple, sensitive, accurate, reproducible, stability‑indicating and suitable for routine determination of ASP and PRS in combined dosage form. The method was validated in compliance with ICH guidelines [22,23].
Materials and Methods
ASP and PRS of pharmaceutical grade were kindly supplied as gift samples by Zydus Cadila Health Care Pvt. Ltd., Ahmedabad, India. Acetonitrile (ACN), methanol, and water used were of HPLC grade and were purchased from Finar Chemicals Pvt. Ltd, Ahmedabad, India. The liquid chromatographic system was of Shimadzu (LC‑2010CHT) system and was manufactured by Shimadzu, Kyoto, Japan, equipped with autosampler, UV and photodiode array (PDA) detector. The chromatographic analysis was performed using LC Solution software on a Kromasil 100 C18, 5 μ (150×4.6 mm2) column. In addition, Digital Micro Balance an Acculab ALC 210.4 analytical balance, pH analyser Chemiline CL 180 μc based pH meter, fast clean ultrasonic cleaner (Enertech Electronics Pvt. Ltd., Mumbai), hot air oven (Thermolab, Mumbai), humidity cum photostability chamber (Thermolab, Mumbai) were used in this study.
Preparation of standard stock solutions
Standard stock solutions were prepared by dissolving 75 mg ASP and 10 mg PRS in 20 ml of methanol and make up to 50 ml with methanol to get a concentration of 1500 μg/ml ASP and 200 μg/ml PRS.
Calibration curves for prasugrel and aspirin
Tablet contains ASP and PRS in a ratio of 75:10. Taking aliquots ranging from 0.1 to 1.0 ml of standard stock solution and make up to 10 ml with diluent (water:ACN:methanol in the ratio of 60:30:10) to get 15 to 150 μg/ml ASP and 2 to 20 μg/ml for PRS. The solutions were injected using a 20 μl and chromatograms were recorded. Calibration curves were constructed by plotting average peak areas versus concentrations and regression equations were computed for both the drugs.
Analysis of marketed formulations
Twenty tablets for combined dosage form of ASP and PRS were weighed and grind to a fine powder, take label claim quantities of powder equivalent to 75 mg ASP and 10 mg PRS were weighed, mixed, and transferred to a 50 ml volumetric flask. The solution was sonicated to dissolve the powder in 30 ml methanol and diluted up to mark with methanol. The solution was filtered through a Whatmann filter paper no. 41. Take 0.5 ml of the above solution and make up to 10 ml with diluent (water:ACN:methanol in ratio of 60:30:10) to get 75 μg/ml ASP and 10 μg/ml PRS. A total of 20 μl volume of the above sample solution was injected into HPLC and peak areas were measured under optimized chromatographic conditions.
Separation studies
Literature survey indicated that both drugs PRS and ASP are acidic in nature having pKa of 5.21 and 3.49, respectively. All methods for PRS and ASP whether individually or in combination with other drugs were developed at acidic mobile phase (pH around 3.0). Because at higher pH significant tailing of both drugs and more distance between two drugs were observed. In preliminary experiments, both drugs were subjected to the separation by reverse phase HPLC using water pH 3 adjusted by orthophosphoric acid, 0.025 mM KH2PO4 buffer with different pH, methanol, and acetonitrile as organic modifiers in different proportions.
Method validation
The method of analysis was validated as per the recommendations of ICH [24] and USP [25] for the parameters like specificity, accuracy, linearity, precision, detection limit, quantitation limit, and robustness. Specificity was determined by evaluating the ability of the proposed method to separate PRS and ASP from its potential degradation products. Forced degradation studies were performed for bulk drug and formulation to provide an indication of the stability‑indicating property and specificity of the proposed method. The accuracy of the method was determined by calculating the percentage recovery of ASP and PRS. For both the drugs, recovery studies were carried out by applying the method to drug sample to which known amount of ASP and PRS corresponding to 20, 40, and 60% of label claim had been added (standard addition method). Intraday and interday precision study of ASP and PRS was carried out as per guideline. The limit of detection (LOD) and limit of quantitation (LOQ) were calculated using the following formulae: LOD=3.3(SD)/S and LOQ=10(SD)/S, where SD is standard deviation of response (peak area) and S is average of the slope of the calibration curve. System suitability tests are an integral part of chromatographic method, which are used to verify reproducibility of the chromatographic system. To ascertain its effectiveness, certain system suitability test parameters were checked by repetitively injecting the drug solution at the concentration level 75 and 10 μg/ml of ASP and PRS, respectively, to check the reproducibility of the system. For robustness evaluation of HPLC method a few parameters like flow rate, percentage of methanol in the mobile phase and pH of mobile phase were deliberately changed. One factor was changed at one time to estimate the effect. Robustness of the method was done at the concentration level 75 μg/ml ASP and 10 μg/ml PRS, respectively.
Forced degradation studies
Forced degradation studies of both the drugs were carried out under conditions of hydrolysis, dry heat, oxidation, and photolysis. ASP and PRS were weighed (500 mg each) and transferred into two 50 ml volumetric flasks and diluted up to the mark with methanol to give 10000 μg/ml concentration of each drug. These stock solutions were used for forced degradation studies.
Forced degradation in basic media was performed by taking 5 ml of stock solution of ASP and PRS each in separate volumetric flasks. Then 5 ml of 0.01 N NaOH was added and these mixtures were heated for up to 1 h at 80° in dark, in order to exclude the possible degradative effect of light. Forced degradation in acidic media was performed by keeping the drug in contact with 0.01 N HCl for up to 1 h at 80° in dark. Degradation with hydrogen peroxide was performed by taking 5 ml of stock solution of ASP and PRS in two different flasks and adding 5 ml of 3% v/v hydrogen peroxide in each of the flasks. These mixtures were kept for 2 h in the dark. To study neutral degradation, 5 ml of stock solution of ASP and PRS were taken in two different flasks, and then 10 ml of HPLC grade water was added in each flask, these mixtures were heated for 1 h at 80° in the dark. For dry heat degradation, solid drugs and tablet powder were kept in Petri dish in oven at 80° for 32 h. Thereafter, 10 mg each of drug and tablet powder equivalent 10 mg PRS were weighed and transferred to two separate 10 ml volumetric flasks and diluted up to the mark with methanol. For UV degradation study, both drugs and tablet powder were exposed to UV radiation of 1.4 flux intensity for 48 h in UV chamber.
For HPLC analysis, all the degraded sample solutions were diluted with mobile phase to obtain final concentration of 750 μg/ml ASP and 100 μg/ml of PRS. Similarly, the mixture of both drugs in a concentration of 750 μg/ml ASP and 100 μg/ml of PRS each was prepared prior to analysis by HPLC. Besides, solutions containing 750 μg/ml ASP and 100 μg/ml of PRS were also prepared without being performing the degradation. Then 20 μl solution of the above solutions were injected into HPLC system and analyzed under the chromatographic condition described earlier.
Stability of analytical solution
Solution stability period for standard and sample preparation was determined by keeping the solution 24 h at room temperature. After 4, 8, and 24 h the solutions were analyzed. The insignificant changes (<2%) were observed for the chromatographic responses for the solution analyzed, relative to freshly prepared standard.
Results and Discussion
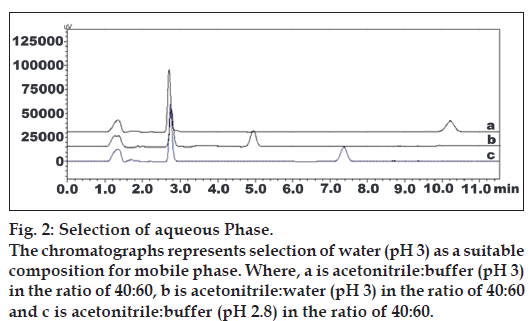
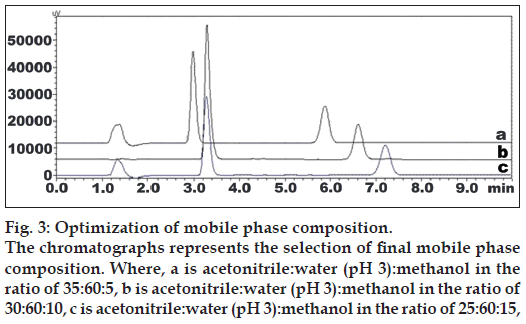
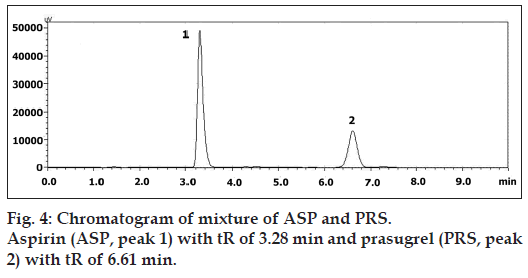
Initial method develop trials were shown in Table 1 and figs. 2 and 3. The mobile phase consisting of acetonitrile:methanol:water (30:10:60, v/v), pH 3.0 adjusted with o‑phosphoric acid, at 1 ml/min flow rate was optimized which gave two sharp, well resolved peaks with minimum tailing factor for ASP and PRS (fig. 4). The retention times for ASP and PRS were 3.28 min and 6.61 min, respectively. The calibration curve for ASP and PRS was found to be linear over the range of 15-150 and 2‑20 μg/ml, respectively. The data of regression analysis of the calibration curves are shown in Table 2. The proposed method was successfully applied to the determination of ASP and PRS in their combined tablet dosage form. The results for the combination were comparable with the corresponding labelled amounts.
Fig. 2: Selection of aqueous Phase. The chromatographs represents selection of water (pH 3) as a suitable composition for mobile phase. Where, a is acetonitrile:buffer (pH 3) in the ratio of 40:60, b is acetonitrile:water (pH 3) in the ratio of 40:60 and c is acetonitrile:buffer (pH 2.8) in the ratio of 40:60.
Fig. 3: Optimization of mobile phase composition. The chromatographs represents the selection of final mobile phase composition. Where, a is acetonitrile:water (pH 3):methanol in the ratio of 35:60:5, b is acetonitrile:water (pH 3):methanol in the ratio of 30:60:10, c is acetonitrile:water (pH 3):methanol in the ratio of 25:60:15,
| Mobile phase (low rate 1 mL/min) | Aspirin | Prasugrel | |||
|---|---|---|---|---|---|
| tR (min) | Peak shape | tR(min) | Peak shape | ||
| A:M | 50:50 | Both drugs merged at 1.55 | |||
| M: Water | 40:60 | 5 | Broad | Not elutedin20 min | |
| A:Water(pH3) | 60:40 | 1.95 | Tailing | 2.51 | Slighttailing |
| A:Water(pH3) | 40:60 | 2.72 | Sharp peak | 4.32 | Good peak |
| A:Buffer(pH 3) | 50:50 | 2.12 | Tailing | 6.48 | Broad |
| A:Buffer(pH 3) | 40:60 | 2.68 | Sharp peak | 10.22 | Slightbroadpeak |
| A:Buffer(pH 3.5) | 45:55 | 2.65 | Good peak | Not elutedin25 min | |
| A:Buffer(pH 2.8) | 40:60 | 2.72 | Sharp peak | 7.38 | Slightfronting |
| A:Water(pH3): M | 35:60:5 | 2.99 | Sharp peak | 5.87 | Sharp peak |
| A:Water(pH3): M | 30:60:10 | 3.28 | Sharp peak | 6.61 | Sharp peak |
| A:Water(pH3): M | 25:60:15 | 3.27 | Sharp peak | 7.20 | Sharp peak |
| A:Water(pH3): M | 40:55:5 | 2.55 | Broad peak | 4.39 | Sharp peak |
| A:Buffer (pH 3):M | 40:50:10 | 2.33 | Sharp peak | 8.94 | Broad peak |
| A:Buffer (pH 3):M | 30:60:10 | 3.87 | Sharp peak | 14.21 | Sharp peak |
| A=Acetonitrile, M=Methanol | |||||
A= Acetonitrile, M= Methanol
Table 1: Initial Trials for Method Development
| Parameters (units) | ASP | PRS |
|---|---|---|
| Linearity range (µg/ml) | 15–150 | 2–20 |
| r2 | 0.9998 | 0.9998 |
| Slope±SD | 5354±8.02 | 17383±6.66 |
| Intercept±SD | 8835±161 | 1753±79 |
ASP is Aspirin, PRS is Prasugrel, SD is standard deviation for n=3 observations
Table 2: Linear Regression Data for Calibration Curves
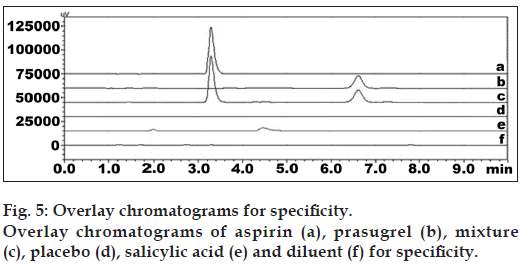
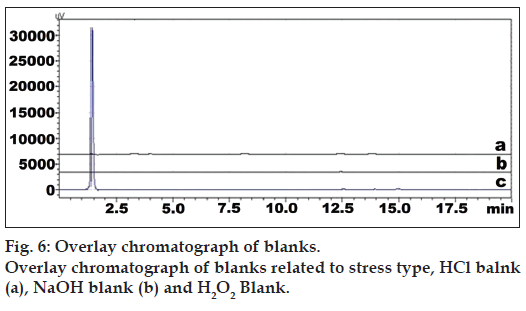
The developed method was also found to be specific since it was able to separate other excipients present in tablet from the two drugs. Representative chromatogram of PRS and ASP standard, mixture, placebo, diluent, and salicylic acid standard were shown in fig. 5. Overlay chromatograph of blanks related to stress type was shown in fig. 6. Specificity data of PRS and ASP was shown in Table 3. The drug and degradation products were separated in the stressed samples by the proposed method. Peak purity data suggested that there was no interference of other coeluting peaks from excipient and degradation products with the drug peak and drug peak was attributed by one component only but not by degradation products. So, the developed method has been found to be specific.
| Sample | Peak purity index | Single point threshold | ||
|---|---|---|---|---|
| PRS | ASP | PRS | ASP | |
| Standard | 1.000000 | 0.999998 | 0.999833 | 0.999981 |
| Test | 0.999998 | 0.999928 | 0.999799 | 0.999979 |
PRS=Prasugrel, ASP=Aspirin
TABLE 3: Specificity Data for PRS and ASP
The LOD for ASP and PRS were found to be 0.374 and 0.05 μg/ml, respectively, while LOQ were 1.13 μg/ml and 0.15 μg/ml, respectively. The results for validation and system suitability test parameters are summarized in Table 4. Results for robustness evaluation for both the drugs are presented in Table 5. Insignificant differences in peak areas and less variability in retention times were observed.
| Parameter (units) | ASP | PRS |
|---|---|---|
| Linearity range (µg/ml) | 15–150 | 2–15 |
| Correlationcoefficient | 0.9998 | 0.9998 |
| LOD (μg/ml) | 0.374 | 0.05 |
| LOQ (μg/ml) | 1.13 | 0.15 |
| Recovery (%) | 99.71 | 100.53 |
| Precision (% RSD) | ||
| Intra‑day (n=3) | 0.3 | 0.41 |
| Inter‑day (n=3) | 0.41 | 0.65 |
| Robustness | Robust | Robust |
| Retention time±SD (min) | 3.28±0.0036 | 6.61±0.0074 |
| Resolution±SD | 7.88±0.13 | 5.04±0.072 |
| Theoretical plates±SD | 3388±5.55 | 5200±9.59 |
| Tailing factor (asymmetry factor) ±SD | 1.41±0.0066 | 1.02±0.0040 |
SD=Standard deviation, PRS=Prasugrel, ASP=Aspirin, LOD=limit of detection, LOQ=limit of quantitation, SST=stands for system suitability test, RSD=relative standard deviation
Table 4: Summary of Validation and SST Parameters
| Conditions | PRS (%) | ASP(%) | ||
|---|---|---|---|---|
| Assay | RSD | Assay | RSD | |
| As such | 92.17 | 96.03 | ||
| Temp | ||||
| 25° | 92.77 | 96.4 | ||
| 35° | 92.24 | 96.56 | ||
| Flow rate | ||||
| 0.9 mL/min | 92.2 | 96.4 | ||
| 1.1 mL/min | 92.81 | 0.41 | 95.97 | 0.22 |
| Mobile phase | ||||
| (A:W:M) | ||||
| 32:60:8 | 93 | 96.11 | ||
| 30:62:8 | 91.94 | 96.11 | ||
| pH | ||||
| 2.8 | 92.31 | 96.18 | ||
| 3.2 | 92.84 | 95.98 | ||
PRS=Prasugrel, ASP=Aspirin, RSD=relative standard deviation, concentrations levels used for robustness evaluation was 75 μg/ml ASP and 10 μg/ml PRS, a Three factors were slightly changed at three levels (-1, 0, 1) and b retention time
Table 5: Results of Robustness Study of ASP and PRS
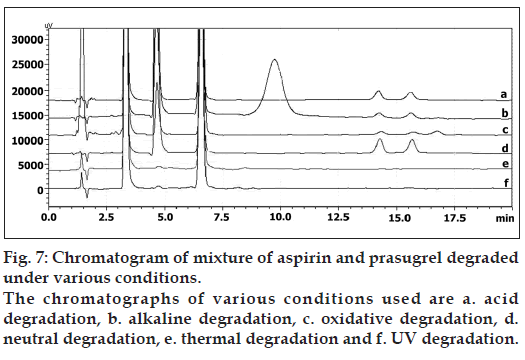
The degradation study indicated that ASP was susceptible to acid, alkali, neutral hydrolysis, oxidative, dry heat, and UV radiation, among them ASP was more susceptible to alkaline hydrolysis under experimental conditions. In all degradation conditions the drug degrades as observed by the decreased area in the peak of the drug when compared with peak area of the same concentration of the undegraded drug, with giving one additional degradation peak at 4.72 min (fig. 7). PRS was found to be susceptible to acid, alkali, neutral hydrolysis, oxidative, dry heat, and UV radiation with maximum degradation under neutral hydrolysis. PRS gets degraded into two or more degradation products in the stress conditions of acid, alkali, neutral hydrolysis as well as oxidative. The chromatogram of the acid, alkali, and neutral degraded sample of PRS showed two additional peaks at tR 14.28 and 15.56 min (fig. 7) and chromatogram of H2O2 induced degraded sample showed three additional peaks at tR 14.28, 15.56, and 16.83 min (fig. 7). In dry heat and UV degradation, the drug degrades as shown by the decreased areas in the peaks when compared with peak areas of the same concentration of the undegraded drug, without giving any additional degradation peaks.
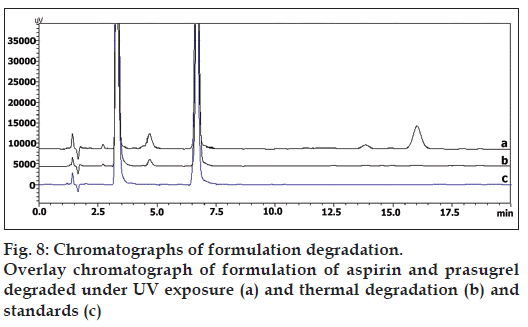
In dry heat, formulation showed two additional peaks at tR 13.72 and 16.21 min, and in UV radiation formulation showed, the drug degrades as shown by the decreased areas in the peaks without giving any additional degradation peaks (fig. 8). Percent degradation was calculated by comparing the areas of the degraded peaks in each degradation condition with the corresponding areas of the peaks of both the standard drugs condition. Summary of degradation studies of both the drugs and formulation is given in Table 6.
| Degradation conditions | Time | % degradation | tR (min) of degradation products | ||
|---|---|---|---|---|---|
| ASP | PRS | ASP | PRS | ||
| API | |||||
| Acid, 0.01N HCl (heated, at 80º) | 1 h | 12.24 | 23.95 | 4.72 | 14.28 |
| 15.56 | |||||
| Base, 0.01 N NaOH (heated, at 80º) | 1 h | 51.17 | 15.1 | 4.72 | 14.28 |
| 15.56 | |||||
| Oxidative, 3% v/v H2O2 (ambient, in dark) | 2 h | 5.62 | 26.56 | 4.72 | 14.28 |
| 15.56 | |||||
| 16.83 | |||||
| Neutral hydrolysis | 1 h | 45.62 | 36.06 | 4.72 | 14.28 |
| (heated, at 80º) | 15.56 | ||||
| Dry heat (80º) | 32 h | 4.96 | 6.12 | 4.72 | ** |
| UV radiation | 48 h | 3.38 | 4.9 | 4.72 | ** |
| Tablets | |||||
| Dry heat (80º) | 32 h | 10.88 | 30.44 | 4.72 | 13.72 |
| 16.21 | |||||
| UV radiation | 48 h | 4.46 | 11.82 | 4.72 | ** |
ASP is Aspirin, PRS is prasugrel, tR stands for retention time, ** Represents that no rise of additional degradation peak was observed. API=active pharmaceutical ingredient.
Table 6: Summary of Degradation Studies for ASP and PRS
In the proposed study, stability‑indicating HPLC method was developed for the simultaneous determination of ASP and PRS and validated as per ICH guidelines. Statistical analysis proved that method was accurate, precise, and repeatable. The developed method was found to be simple, sensitive, and selective for analysis of ASP and PRS in combination without any interference from the excipients. The method was successfully used for the determination of drugs in a pharmaceutical formulation. Assay results for combined dosage from using proposed method showed 97.56±0.095% of ASP and 93.35±0.525% of PRS. The results indicated the suitability of the method to study stability of ASP and PRS under various forced degradation conditions viz. acid, base, dry heat, neutral, oxidative, and UV degradation. Stability data for prasugrel and aspirin was shown in Table 7. It can be concluded that the method separates the drugs from their degradation products; it may be employed for the analysis of stability samples of ASP and PRS. However, the characterization of degradation products was not carried out.
| Time(hour) | Standard solution area | Sample solution area | ||
|---|---|---|---|---|
| PRS | ASP | PRS | ASP | |
| 0 | 178593 | 416679 | 162375 | 401010 |
| 4 | 178298 | 416120 | 162368 | 401002 |
| 8 | 178098 | 415012 | 162078 | 399792 |
| 24 | 176786 | 412045 | 159987 | 393124 |
| Average | 177944 | 414964 | 161702 | 398732 |
| SD | 798 | 2066 | 1152 | 3782 |
| % RSD | 0.45 | 0.5 | 0.71 | 0.95 |
SD=Standard deviation, PRS=prasugrel, ASP=Aspirin, RSD=relative standard deviation
Table 7: Summary of Solution Stability Data for ASP and PRS
Acknowledgements
The authors are thankful to Zydus Cadila Health Care Pvt. Ltd., Ahmedabad, India and Enaltec lab Pvt. Ltd., Mumbai, India for providing gift sample of PRS and ASP for research. The authors are highly thankful to Shri Sarvajanik Pharmacy College, Mehsana, Gujarat, India for providing all the facilities to carry out the work.
References
- The Indian Pharmacopoeia. Vol. 1. New Delhi: Government of India, Controller of Publication; Ministry of Health and Family Welfare; 2010. p. 842‑3.
- British Pharmacopoeia. Vol. 1. London: Her Majesty’s Stationary Ofice; 2009. p. 442‑5.
- The United States Pharmacopoeia. Vol. 30, Rockville: U.S. Pharmacopoeial Convention Inc; 2008. p. 1164
- Harshini B, Alekhya S, Manasa G, Prakash K. Extractive spectrophotometric estimation of prasugrel in pharmaceutical formulation. Res J Pharm Biol Chem Sci 2011;2:426‑30.
- Ashokkumar A, Anilokumar A, Gowrishankar D. Development, estimation and validation of prasugrel in bulk and in its pharmaceutical formulation by UV‑Vis spectroscopic method. Pharmanest Int J Adv Pharm Sci 2011;2:37‑9.
- Ashokkumar A, Laxmiram M, Bharatkumar B, Swamy G, Das R, Gowrishankar D. Spectrometric determination of prasugrel in bulk and in its pharmaceutical formulation by UV method. Pharmanest Int J Adv Pharm Sci 2011;2:55‑7.
- Jena F, Ravikumar BV, Viriyala R, Annapurna MM, Bisht SP. Validated new spectrophotometric methods for the estimation of prasugrel in bulk and pharmaceutical dosage forms. Int J Compr Pharm 2011;2:1‑3.
- Wickremsinhe ER, Tian Y, Ruterbories KJ, Verburg EM, Weerakkody GJ, Kurihara A, et al. Stereoselective metabolism of prasugrel in humans using a novel chiral liquid chromatography‑tandem mass spectrometry method. Drug Metab Dispos 2007;35:917‑21.
- Lukram O, Zarapkar M, Jha C, Parmar S, Tomar K, Hande A. Electrospray ionization LC‑MS/MS validated method for the determination of the active metabolite (R‑13 8727) of prasugrel in human plasma and its application to a bioequivalence study. Drug Test Anal 2012;4:158‑66.
- Rani U, Chandrasekhar B, Devanna N. Analytical method development and validation of prasugrel in bulk and its pharmaceutical formulation using HPLC. J Appl Pharm Sci 2011;1:172‑5.
- Ishaq B, Prakash K, Mohan G. Development and validation of HPLC method for determination of prasugrel in bulk and its pharmaceutical formulation. J Chem Pharm Res 2011;3:404‑9.
- Srikanth I, Sharmila P, Bharathi V, Raju M, Naik L, Nagarjuna K. A validated reverse phase HPLC method for the estimation of prasugrel hydrochloride in pharmaceutical dosage forms. J Inno Trends Pharm Sci 2011;2:140‑8.
- Prabahar AE, Rama Rao N, Sambasiva Rao KR, Vijayaraj Kumar P. Method development and validation for the HPLC potency assay of prasugrel tablets. J Pharm Res 2011;4:980‑2.
- Pulla R, Sastry B, Prasad Y, Appala N. Estimation of prasugrel in tablet dosage form by RPHPLC. Int J Chem Res 2011;2:34‑6.
- Borole T, Mehendre R, Damle M, Bothara K. Development and validation of Stability‑indicating HPTLC method for determination of prasugrel. J Chem Pharm Res 2010;2:907‑13.
- Sahu K, Karthikeyan C, Moorthy N, Trivedi P. Comparative study of forced degradation behavior of prasugrel by UPLC and HPLC and the Development of validated SIAM. J Liq Chromatogr Rel Tech 2011;34:1870‑84.
- Verstraeten A, Roets E, H‑Martens J. Quantitative determination by high‑performance liquid chromatography of acetylsalicylic acid and related substances in tablets. J Chromatogr 1987;388:201‑16
- Kumar S, Jamadar L, Bhat K, Musmade P, Vasantharaju G, Udupa N. Analytical method development and validation for aspirin. Int J Chem Tech Res 2010;2:389‑99.
- Kumar A, Ayyappan T, Raman R, Vetrichelvan T, Sankar K, Nagavalli D. RP‑HPLC Analysis of aspirin and clopidogrel bisulphate in combination. Indian J Pharm Sci 2007;69:597‑9.
- Panda S. Ion‑Pairing RP‑HPLC Method for Simultaneous determination of aspirin and clopidogrel bisulphate in tablet and capsule dosage form. Int J Pharm Tech Res 2010;2:269‑73.
- ICH, Q1A, Stability Testing of New Drug Substances and Products. In: Proceedings of the International Conference on Harmonisation, Geneva, October, 1993.
- ICH, Q2A, Hamonised Tripartite Guideline, Test On Validation of Analytical Procedures, IFPMA. In: Proceedings of the International Conference on Harmonization, Geneva, March, 1994.
- ICH, Q2B, Hamonised Tripartite Guideline, Validation of Analytical Procedure: Methodology, IFPMA, In: Proceedings of the International Conference on Harmonization, Geneva, March, 1996.
- ICH Guidance on Analytical Method Validation, In: Proceedings of the International Convention on Quality for the Pharmaceutical Industry, Toronto, Canada, September, 2002.
- United States Pharmacopoeia/National Formulary. 24th ed. Rockville: U.S. Pharmacopeial Convention; 2000. p. 2149.
