- *Corresponding Author:
- N. Mahindroo
School of Pharmaceutical Sciences, Shoolini University, Post Box-9, Solan-173 212, India
E-mail: Neeraj.Mahindroo@yahoo.com
| Date of Submission | 19 December 2015 |
| Date of Revision | 18 October 2016 |
| Date of Acceptance | 18 November 2016 |
| Indian J Pharm Sci 2016;78(6):769-774 |
This is an open access article distributed under the terms of the Creative Commons Attribution-NonCommercial-ShareAlike 3.0 License, which allows others to remix, tweak, and build upon the work non-commercially, as long as the author is credited and the new creations are licensed under the identical terms
Abstract
7,8,9,10-Tetrahydroazepino[2,1b]quinazolin-12(6H)-one (TAZQ), a synthetic analogue of vasicine, has been reported as anticancer, bronchodilator, antiinflammatory, antitussive, antiarthritic and antiasthamatic compound. This drug candidate is presently in pre-clinical studies for anticancer activity. The development of a validated reverse phase-HPLC (RP-HPLC) method is herein reported for its analysis and stability assessment. The analytical method was optimized using a C-18 column (at ambient temperature) and methanol:water (80:20 v/v) as mobile phase at flow rate of 0.9 ml/min. The eluents were monitored at 254 nm. The retention time of 7,8,9,10-Tetrahydroazepino[2,1b]quinazolin-12(6H)-one was observed to be 3.9 min. It degraded significantly under alkaline conditions whereas negligible degradation was observed under acidic, oxidative, thermal and photolytic stress conditions. The peak of major degradation product, resulting from alkaline degradation, was well resolved from the peak of 7,8,9,10-Tetrahydroazepino[2,1b]quinazolin-12(6H)-one. This method has been found to be linear, accurate, precise, robust, sensitive, specific, suitable and stability indicating.
Keywords
Quinazolines, cancer, HPLC, stability-indicating method
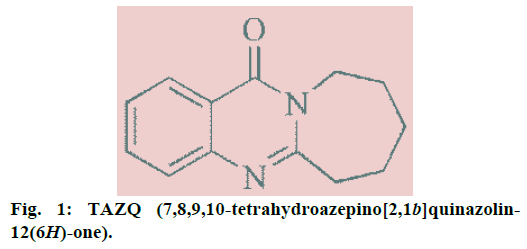
7,8,9,10-tetrahydroazepino[2,1b]quinazolin-12(6H)- one (TAZQ) (Figure 1), a synthetic analog of vasicine, is currently under preclinical studies for anticancer activity. Vasicine is a major alkaloid obtained from the leaves of Adhatoda vasica Nees, a wellknown medicinal plant used in Ayurvedic and Unani medicine [1]. TAZQ has been extensively studied as bronchodilator [2-7]. It inhibited lung phosphodiesterase activity, lipooxygenase activity, histamine release and antigen-induced mast cell degranulation [8]. It showed synergistic antiasthamatic activity in combination with ambroxol in ovalbumin sensitized guinea pigs [5]. It showed antitussive activity in citric acid cough model in guinea pigs [9]. It’s in vivo metabolic studies were performed in rhesus monkeys and Charles Foster rats. Various metabolites that were detected did not show any bronchodilatory activity [10,11]. TAZQ showed doserelated reduction in developing adjuvant arthritis in rats. It’s LD50 was lower than 1000 mg/kg p.o, thus was safe at pharmacologically active doses [12]. Structure activity relationship of TAZQ as bronchodilator has been studied extensively [7]. It induced nuclear factor kappa-light-chain-enhancer of activated B cell (NF- κB)-mediated apoptosis in human colon carcinoma HCT-116 cell lines [13]. A recent study, showed that its antiproliferative activity is through inhibition of PI3k/ Akt/FoxO3a pathway [14].
Although TAZQ has been studied extensively for its biological activities and is currently in pre-clinical studies as anticancer agent (with reference to personal communication with PK-PD Division, IIIM-CSIR, Jammu, India), its stability indicating assay method has not been reported yet. A validated stability indicating assay method must be employed to study the influence of storage on quality, safety and/or efficacy of a drug substance. Stress studies must be performed early in development phase to assess inherent stability of a drug. Validation of stability indicating assay method is essential to prove that it distinguishes active ingredients from degradation products and can measure their content without interference [15]. We report here the development of a validated reversed phase high performance liquid chromatography (RPHPLC) method for analysis of TAZQ and its successful application as a stability indicating assay.
Materials and Methods
Water and methanol of HPLC grade, hydrochloric acid and sodium hydroxide were procured from Loba Chemi Pvt. Ltd., Mumbai, India. Hydrogen peroxide was from Finar, anthranilic acid was from Sigma- Aldrich, caprolactam was from Himedia and thionyl chloride was from Thomas Baker. All chemicals were of analytical grade and were used as received. The proton nuclear magnetic resonance (1H-NMR) and liquid chromatography-mass spectrometry (LC-MS) were carried out at Sophisticated Analytical Instrumentation Facility, Panjab University, Chandigarh, India.
Synthesis of TAZQ
TAZQ was synthesised according to a reported method [2]. Anthranilic acid (5 g, 23 mmol, 1 equivalent) was dissolved in dry toluene. Thionyl chloride (14 ml, in excess) was added to it and refluxed for three hours. The solvent was removed in vacuo to give corresponding sulphonamide anhydride. Caprolactam (4 g, 35 mmol, 1.5 equivalent), dissolved in toluene, was added to reaction mixture drop wise and stirred overnight at ambient temperature. The solvent was removed in vacuo, the residue was re-dissolved in chloroform and washed with 1 N HCl, organic layer was separated to remove any unreacted part. Aqueous layer was basified and extracted with chloroform. Organic layer was collected and solvent was removed in vacuo and residue was chromatographed over silica gel 60-120 mesh, with hexane-ethyl acetate gradient. TAZQ was obtained as pale yellow solid in 70% yield (mp 97-98°, lit mp 98-99°) [22]. Analytical purity was determined by RP-HPLC using Agilent Technologies 1200 HPLC system consisting of photo diode array (PDA) detector. Percent purity was found to be 98.6% and 97.4% using mobile phases methanol:water (80:20 v/v) and methanol:water (78:22 v/v), respectively. TAZQ was spectrally characterized through IR (Agilent Cary 630 Fourier transform infrared spectrometer), 1H-NMR (Bruker Avance II 400 NMR spectrometer, CDCl3) and LC-MS (Waters, Q-TOF Micromass spectrometer). IR cm-1: 3044, 2925, 1659, 1588, 1447, 1395, 1235. 1H-NMR (CDCl3) δ: 8.2500-8.2466 (1 H, d, J=8.04 Hz), 5.5366-5.2669 (3 H, m), 4.4099-4.3856 (2 H, m), 3.0908-3.0641 (2 H, m), 1.7-2.20 (6 H, m). LC-MS m/z: 215.53 (M+1), 216.54 (M+2).
HPLC instrumentation and conditions
The RP-HPLC method was developed on an Agilent Technologies 1200 HPLC system consisting of a binary pump, PDA detector, auto sampling injection system and C18 column (Agela technologies, Innoval, 4.6×250 mm, 5 μ). Data acquisition was done using EzChrome Elite software. Chromatographic parameters were optimized starting with methanol:water (50:50 v/v) as mobile phase. Flow rate, injection volume and run time were kept as 2 ml/min, 10 μl and 30 min, respectively. Chromatographic conditions were optimized to obtain sharp and symmetric peak. The finalized chromatographic parameters are summed up in Table 1. Solvents were filtered through nylon membrane filters (0.22 μ pore size) and sonicated for 15-20 min. Samples were filtered through syringe filter (0.45 μ pore size) prior to injection.
| Parameter | Condition |
|---|---|
| Stationary phase | Innoval C18 column (4.6×250 mm, 5 µ) |
| Mobile phase | Methanol:water (80:20 v/v) |
| Flow rate | 0.9 ml/min |
| Detector | Photo diode array |
| Injection volume | 5 µl |
| Detection wavelength | 254 nm |
| Retention time | 3.9 min |
Table 1: Optimised Chromatographic Conditions for Tazq
Preparation of stock solution and calibration curve
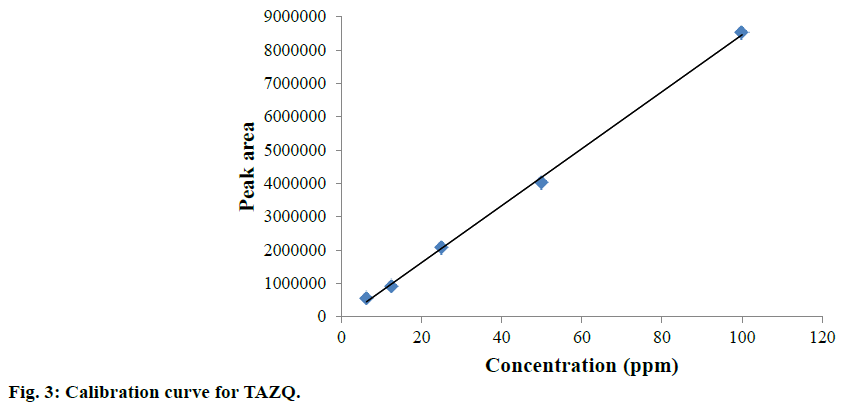
Accurately weighed TAZQ was transferred to volumetric flask and volume was made up with methanol:water (80:20 v/v) to obtain a 100 ppm stock solution. Further dilutions of TAZQ (6.25, 12.5, 25, 50, 100 ppm) were prepared and injected in triplicates to obtain the chromatograms. A calibration curve was constructed by plotting average peak area vs. concentration. Regression equation and correlation coefficient were computed.
Validation and system suitability testing
The method was validated and tested for system suitability according to International Conference on Harmonization (ICH), United States Food and Drug Administration (USFDA) and United States Pharmacopoeia guidelines (USP). Linearity was determined by computing regression equation and correlation coefficient from calibration curve. For inter-day precision studies, analysis was carried out for three consecutive days at three concentration levels (6.25, 12.5 and 25 ppm), each in triplicate. Analysis was carried out at three different times in a day at three concentration levels (6.25, 12.5 and 25 ppm), each in triplicate, to study intraday precision. Percent relative standard deviations (RSD) of peak areas were calculated. Standard addition method was employed for accuracy studies. Spiking was done at levels of 80, 100 and 120% in previously analysed sample of 25 ppm to measure percent recovery by the assay of known added amounts of analyte. Robustness was measured by making small but deliberate changes in detection wavelength (±5 nm), flow rate (±0.1 ml/ min) and organic content in mobile phase (±2 units). %RSD of peak areas was calculated. The specificity of the method was performed by determining resolution between the peak of analyte and closest eluting peak. Limit of detection (LOD) and limit of quantification (LOQ) were determined using the formulas, LOD=3.3×σ/S and LOD=10×σ/S, where, ‘σ’ is the standard deviation of the response and ‘S’ is the slope of calibration curve. System suitability was evaluated by analysing six replicates of 12.5 ppm TAZQ. Suitability for intended use was tested in terms of %RSD of retention time, %RSD of peak area, tailing factor and number of theoretical plates [16-20].
Forced degradation studies
The stability of TAZQ was studied under stress conditions. For hydrolytic degradation, different strengths of acid (0.1 N, 1 N, 2 N, 5 N HCl), base (0.1 N, 1 N NaOH) and hydrogen peroxide (H2O2) (3%, 6%) were employed. Accurately weighed 50 mg of TAZQ was dissolved in 1 ml of respective acid, base or H2O2 and kept for specified period of time at room temperature. For degradation with 0.1 N HCl, 0.1 N NaOH and 3% H2O2, solutions were refluxed at 80° for 30 min. The volume was made up to 50 ml with methanol:water (80:20 v/v) and 5 ml of this solution was again diluted to get a final concentration of 20 ppm. The stressed samples from acid or base hydrolysis were neutralized (with NaOH or HCl of appropriate strength) prior to injection. Thermal degradation was studied by exposing 10 mg dry powder of TAZQ at 80° in a temperature controlled oven for 4 h. Photolytic degradation was studied by exposing 10 mg dry powder of TAZQ to 365 nm UV light for 4 h in UV chamber. Using methanol:water (80:20 v/v) as solvent, 20 ppm solutions of these stressed samples were prepared, filtered and injected. Analysis was performed by the developed method.
Results and Discussion
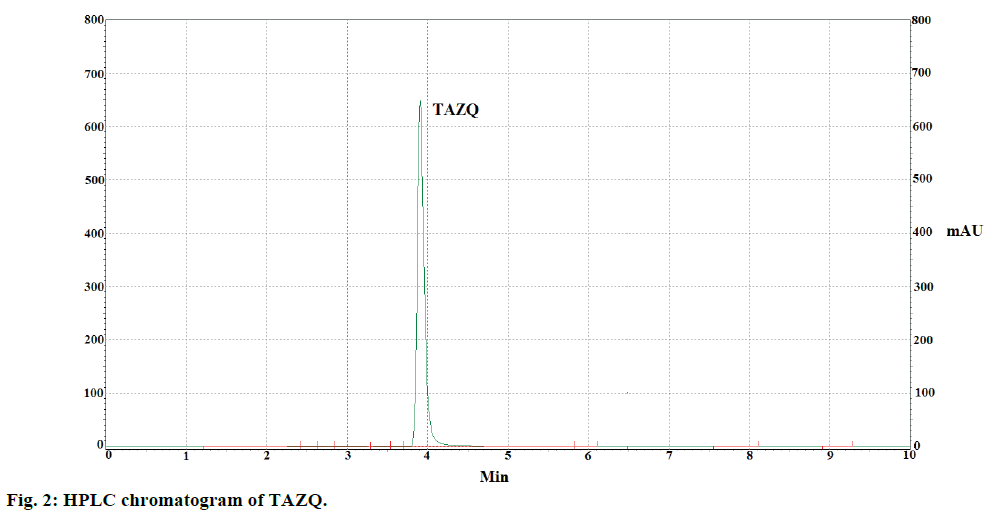
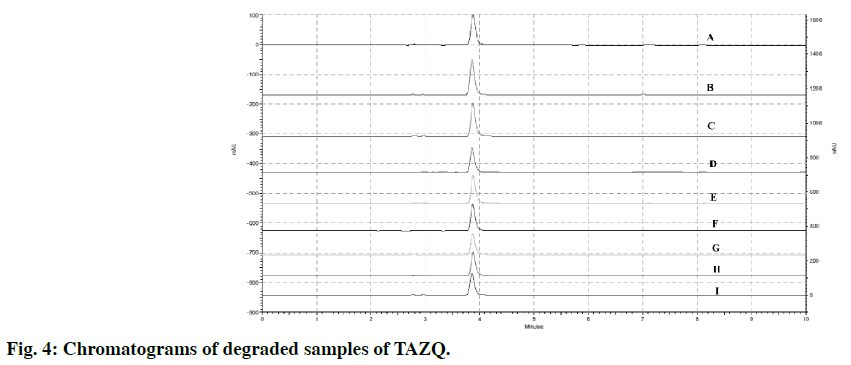
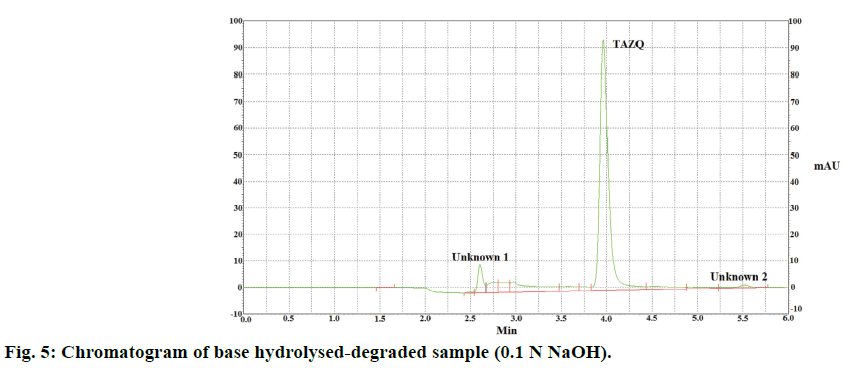
TAZQ was synthesized and the spectral data of synthesized compound matched the literature reports. Chromatographic conditions were optimized to obtain sharp and symmetric peak. The average retention time for TAZQ was 3.921±0.009 min (Figure 2). A calibration curve was plotted by taking 6.25, 12.5, 25, 50 and 100 ppm of TAZQ (Figure 3 and Table 2). Results of validation and system suitability are summed up in Tables 3 and 4, respectively. All the observations complied with the acceptance criteria laid down by regulatory guidelines [19,21-23]. Forced degradation of TAZQ was performed under various stress conditions and stressed samples were analysed by standardized method. TAZQ did not show any degradation under acidic, oxidative, thermolytic and photolytic stress, as is evident by the chromatograms that show only a single peak of TAZQ at 3.9 min (Figure 4). Significant degradation (19.85%) was observed in alkaline hydrolysis (Figure 5). Degradation level of 10-20% is considered acceptable for chromatographic assay validation [24,25]. Chromatogram of alkaline degraded sample showed peaks of TAZQ, major degradant and minor degradant at retention times of 3.9, 2.6 and 5.5 min, respectively. Resolution between the peaks of TAZQ and major degradant was found to be 2.27. Results of forced degradation studies are summed up in Table 5. The peak of TAZQ was distinguishable and quantifiable among the peaks of degradation products and thus the method is stability indicating. The present study is a first report on development and validation of an RP-HPLC method for determination of TAZQ and its successful application as stability indicating assay method. The developed RP-HPLC method was found to be simple, linear, accurate, precise, specific, robust, rapid and suitable. The method effectively separated peaks of TAZQ and degradation products, and was capable of measuring their content without interference. Even though no attempt was made to identify the degradation products, this method can be employed for determination of TAZQ and as a stability indicating assay.
| Concentration (ppm) | Mean peak area±SD (n=3) | %RSD |
|---|---|---|
| 6.25 | 562113±348 | 0.05 |
| 12.5 | 921846±8401 | 0.91 |
| 25 | 2071154±34351 | 1.60 |
| 50 | 4025925±22337 | 0.55 |
| 100 | 8533588±6306 | 0.73 |
Table 2: Linearity Data for Tazq
| Validation parameter | Observed value | Acceptance criteria[19,21] |
|---|---|---|
| Linearity | r2=0.998 Slope=85510 Intercept=-90598 |
r2≥0.99 |
| Intraday precision | %RSD=1.2 | %RSD≤2 |
| Interday precision | %RSD=0.9 | %RSD≤2 |
| Accuracy | % recovery=98±0.59 (n=3) | % recovery=100±2% |
| LOD |
|
- |
| LOQ | 0.04 ppm | - |
| Robustness | %RSD≤2 | |
| Flow rate=1.0 ml/min. Flow rate=0.8 ml/min. |
%RSD=0.13 %RSD=0.20 |
|
| Detection λ=259 nm Detection λ=249 nm |
%RSD=0.64 %RSD=1.67 |
|
| Mobile phase:methanol:water (82:18) Mobile phase:methanol:water (78:22) |
%RSD=0.40 %RSD=0.65 |
Table 3: Summary of Validation Parameters
| Parameter | Observation (n=6) | Acceptance criteria[19] |
|---|---|---|
| %RSD peak area | 1.0 | %RSD≤1 |
| %RSD retention time | 0.22 | %RSD≤1 |
| Tailing factor (Tf) | 1.283±0.11 | Tf≤2 |
| Number of theoretical plates (N) | 11459.5±1437.5 | N>2000 |
| Resolution (R) | 2.27±0.14 | R>2 |
Table 4: Summary of System Suitability Parameters
Financial support and sponsorship
Nil.
References
- Claeson UP, Malmfors T, Wikman G, Bruhn JG. Adhatodavasica: a critical review of ethanopharmacological and toxicological data. J Ethnopharmacol 2000;27:1-26.
- Malhotra S, Kaul SK, Sharma RL, Anand KK, Gupta OP, Dhar KL, et al.Studies on some biologically active azepinoquinazolines: part I an approach to potent bronchodilatory compounds. Indian J Chem 1988;27B:937-40.
- Jindal DP, Bhatti RS, Ahlawat S, Bansal R. Synthesis and bronchodilatory activity of some nitrogen bridgehead compounds. Eur J Med Chem 2002;37:419-25.
- Zabeer A, Bhagat A, Gupta OP, Singh GD, Youssouf MS, Dhar KL,et al. Synthesis and bronchodilator activity of new quinazolin derivative. Eur J Med Chem 2006;41:429-34.
- Bande M, Nepali K, Goyal R, Thakur V, Suri J, Budhiraja RD, et al. Evaluation of antiasthamatic activity of 7,8,9,10-tetrahydroazeoino[2,1-b]quinazolin-12(6H)-onein combination with ambroxol in guinea pigs. Med Chem Res 2012;21:4158-67.
- Spulak M, Pourova J, Voprsalove M, Mikusek J, Kunes J, Vacek J,et al. Novel bronchodilatoryquinazolines and quinoxalines: synthesis and biological evaluation. Eur J Med Chem 2014;74:65-72.
- Mahindroo N, Zabeer A, Bhagat A, Bedi KL, Khajuria RK, Kapoor VK,et al.Synthesis and structure-activity relationships of vasicineanalog as bronchodilatory agents. Med Chem Res 2005;14:347-68.
- Johri RK, Zutshi U. Mechanism of action of 6,7,8,9,10,12-hexahydro-azepino-[2,1-]quinazolin-12-one (RLX): a novel bronchodilator. Indian J PhysiolPharmacol 2000;44:75-81.
- Nepali K, Bande MS, Sapra S, Garg A, Kumar S, Sharma P, et al. Antitussive effects of azepino[2,1-b]quinazolones. Med Chem Res 2012;21:1271-7.
- Sharma SC, Zutshi U, Dhar KL. Structure elucidation of two more metabolites of 7,8,9,10-tetrahydroazepino[2,1-b]quinazolin-12(6H)-one,a potent bronchodilator: part II. Indian J Chem 1999;38B:814-7.
- Sharma SC, Zutshi U, Gupta OP, Dhar KL, Atal CK. Isolation, characterization and partial synthesis of a major metabolite of a potent bronchodilator 7,8,9,10-tetrahydroazepino[2,1B]-quinazolin-12(6H)one. Indian J Chem 1996;35B:345-8.
- Sharma ML, Khajuria A, Kaul A, Chand D. Immunopharmacological properties of azepino[2,1-b]quinazolin-12(6H)-one-7,8,9,10-tetrahydro(RLX). Int J Immunopharmacol 1992;14:979-6.
- Qazi AK, Hussain A, Aga MA, Ali S, Taneja SC, Sharma PR, et al. Cell specific apoptosis by RLX is mediated by NF-ҡB in human colon carcinoma HCT-116 cells. BMC Cell Biol 2014;15:36-44.
- Qazi AK, Hussain A, Khan S, Aga MA, Behl A, Ali S, et al.Quinazoline based small molecule exerts potent tumor suppressive properties by inhibiting pI3K/akt/FoxO3a signalling in experimental colon cancer. Cancer Lett 2015;359:47-56.
- http://www.ich.org/fileadmin/Public_Web_Site/ICH_Products/Guidelines/Quality/Q1A_R2/Step4/Q1A_R2_Guideline.pdf.
- http://www.ich.org/products/guidelines/quality/quality-single/article/validation-of-analytical-procedures-text-and-methodology.html.
- http://www.fda.gov/downloads/drugs//guidances/ucm073384.pdf.
- http://www.ich.org/fileadmin/Public_Web_Site/ICH_Products/Guidelines/Quality/Q2_R1/Step4/Q2_R1_Guideline.pd.
- http://www.fda.gov/downloads/drugs/guidances/ucm134409.pdf.
- https://hmc.usp.org/sites/default/files/documents/HMC/GCs-Pdfs/c1225.pdf.
- http://www.fda.gov/downloads/ScienceResearch/FieldScience/UCM092147.pdf.
- Ghulam AS. Validation of high-performance liquid chromatography methods for pharmaceutical analysis. J Chromatogr A 2003;987:57-66.
- Taverniers I, Loose MD, Backstaele EV. Trends in quality in the analytical laboratory. II. Analytical method validation and quality assurance. Trends Anal Chem 2004;23:535-52.
- Blessy M, Patel RD, Prajapati PN, Agrawal YK. Development of forced degradation and stability indicating studies of drugs-a review. J Pharm Anal 2014;4:159-65.
- Ngwa G. Forced degradation as an integral part of HPLC stability-indicating method development. Drug Delivery Technol2010;10:56-9.
