- *Corresponding Author:
- Evrim Yenilmz
Anadolu University, Graduate School of Health Sciences, Eskişehir, Turkey
E-mail: evrimakyil@anadolu.edu.tr
| Date of Submission | 03 December 2018 |
| Date of Revision | 16 February 2019 |
| Date of Acceptance | 27 May 2019 |
| Indian J Pharm Sci 2019;81(4):640-650 |
This is an open access article distributed under the terms of the Creative Commons Attribution-NonCommercial-ShareAlike 3.0 License, which allows others to remix, tweak, and build upon the work non-commercially, as long as the author is credited and the new creations are licensed under the identical terms
Abstract
Ketoprofen lysine because of a short half-life (1-2 h) multiple dosing regimens are required for oral administration. For this reason, this study is concerned with the preparation of poly lactic-co-glycolic acid-based spray-dried nanoparticles to extend the activity of the ketoprofen lysine. Nanoparticles were produced with a spray dryer (B-90, Büchi, Switzerland) and solid state properties of nanoparticles were analyzed using scanning electron microscopy, particle size, polydispersity index, zeta potential, nuclear magnetic resonance spectroscopy, X-ray and differential scanning calorimetry. Drug release from nanoparticles was studied using the dialysis bag method in simulated gastrointestinal environment (pH 7.4). Ketoprofen lysine-loaded particles demonstrated nanostructured and spherical shape while in vitro release studies showed extended release (~8 days) of ketoprofen lysine incorporated and also a fairly good entrapment efficiency (~59-78%) was detected. Peppas-Sahlin kinetic model was found to fit the best using DDSolver software program. This research may be useful for long-term and optimum use of oral non-steroidal antiinflammatory drug in chronic inflammatory diseases.
Keywords
Ketoprofen lysine, PLGA, extended release, spray-dried nanoparticles
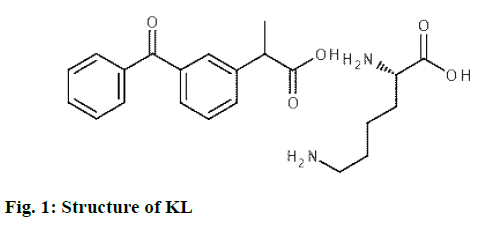
Ketoprofen lysine (KL; fig. 1) is one of the most commonly used non-steroidal antiinflammatory drugs for the treatment of various chronic inflammatory diseases such as osteoarthritis and rheumatoid arthritis for analgesic activity. It is the water-soluble lysine salt of ketoprofen[1,2]. Compared with ketoprofen, KL showed better pharmacokinetic profile and excellent tolerability, increased absorption rate and improved gastric tolerance[3]. Besides these good features, it has a short half-life of 1-2 h. In oral administration, multiple dose regimens are required, leading to fluctuations in drug blood levels and adverse effects due to toxicity, and sometimes inadequate treatment and poor patient compliance[2,4]. Because of these features; KL is a candidate drug for prolonged-release dosage forms.
Nowadays nanosized polymeric nanoparticle (PNPs) systems are one of the effective prolonged-release technologies. PNPs, which attracted the attention of many research teams can be prepared by several methods. Selection of the method depended on a number of factors such as particle size, particle size distribution, as desired[5]. Spray drying technique was used in this study for the preparation of nanoparticles. Spray drying technique enables the conversion of a feed from a fluid state into dried particulate form by spraying the feed into a hot drying medium. The feed can be a dispersion, suspension, emulsion or the solution, which is mostly used. Dried yield can be in the form of powder, granule or agglomerate devolving on the chemical and physical properties of the feed, the dryer design and final powder properties desired[6,7]. Many natural and synthetic polymers are used in the preparation of PNPs[6]. By providing controlled release and extended release of drug active substance into the polymer, the most commonly used biodegradable polymers in the production of PNPs are polyglycolic acid, polylactic acid, and their copolymers, poly lactic-co-glycolic acid (PLGA)[8,9]. Depending on the properties of PLGA used in PNP drug delivery systems, an advantageous situation can be achieved by prolonging drug release and providing controlled release[10]. The crystal structure of PLGA depends on the molar ratio of the monomers in the copolymer chain. Copolymers containing less than 70 % polyglycolic acid are amorphous and readily soluble in organic solvents such as dichloromethane, ethyl acetate. Polylactic acid is more hydrophobic because it carries an additional methyl group in the side chain than polyglycolic acid, and biodegradation takes place much longer than polyglycolic acid[11].
Even though preparation of KL sustained/extended release formulation presented a great challenge due to its very high aqueous solubility, PLGA-based PNPs could be formulated in this study with an aim to prolong release of KL for efficient treatment of pain potentially with low side effects.
Materials and Methods
KL was obtained as a gift from Berko İlaç (İstanbul/ Turkey). PLGA (Resomer® RG 504H) was purchased from Sigma-Aldrich (Germany). Acetone, acetonitrile, dimethyl sulfoxide and deuterated chloroform were purchased from Merck (Germany). All other chemicals used were of analytical grade.
Preparation of nanoparticles:
PLGA-based PNPs were prepared by the spray drying technique with some modifications[5]. Accurately weighed PLGA was dissolved in acetone for 30 min under 250 rpm stirring condition. KL was dissolved in distilled water then added, under mild agitation for 5 min. Final transparent solution was then spray dried using a B-90 instrument (Büchi, Switzerland) with an inlet temperature of 100° and an outlet temperature of 50°. Blank PNPs were also prepared as described above without the addition of KL. Spray drying conditions were given in Table 1 and the composition of PLGAbased PNPs was given in Table 2.
| Inlet temperature | Outlet temperature | Flow rate (ml/min) | Pump control level | Aspirator control level |
|---|---|---|---|---|
| 100° | 50° | 450 | 3 | 3 |
Table 1: Spray drying conditions
| Code | PLGA (mg) | KL (mg) | Acetone (ml) | Distilled water (ml) |
|---|---|---|---|---|
| S blank* | 500 | - | 99 | 1 |
| S1 | 500 | 25 | 99 | 1 |
| S2 | 500 | 50 | 99 | 1 |
*Blank is the formulation without KL
Table 2: Composition of PLGA-based PNPs
High performance liquid chromatography (HPLC) conditions:
HPLC (Shimadzu Corporation-20A, Kyoto, Japan) with reversed-phase InertSustaine® column (4.6× 150 mm, C18 Gravity, 5 μm; LiChrosper®100 RP) was used for the determination of KL using a modified method[12]. Mobile phase of the HPLC system was a mixture of acetonitrile:KH2PO4 buffer (0.03 M; 60∶40, v/v; pH 3.0) was adjusted with orthophosphoric acid) prepared daily, degassed by sonication and filtered through 0.45 μm membrane filter just before testing. Flow rate was set at 1 ml/min resulting in a run time of 15 min per sample and injection volume was 20 μl. 242 nm wavelength was used for detection and samples were analyzed at 20°. HPLC method used was validated for linearity, precision, accuracy and specificity[13].
Encapsulation efficiency (EE %):
KL-loaded to PLGA PNPs was determined by reversed phase-high performance liquid chromatography (RP-HPLC) method described in the previous section. KL, the active agent of PLGA PNPs was evaluated by coordinate extraction of KL from PNPs. Spray-dried PNPs (5 mg) were precisely measured, 1 ml acetone was added and vortexed to break up the particles in the natural stage. Complete solution was filtered through 0.22 μm polyamid filter and analyzed using HPLC. Encapsulation efficiency was expressed as EE (%) following Eqn. 1[14], EE % = (actual amount of KL loaded in PLGA PNPs/theoretical amount of KL loaded in PLGA PNPs)×100.
In vitro dissolution/release study:
In vitro dissolution/release study of KL from PLGA PNPs were carried out through a dialysis bag method[5]. In vitro release study was continued for 8 d. PLGA PNPs (S1 and S2) containing 5 mg of KL and pure KL (5 mg) was placed in a cellulose acetate dialysis bag (MW: 12-14 kDa, Sigma) where 1 ml of dissolution media was also added to the bag and the bag was then sealed at both ends. Dialysis bag was then placed into an amber glass beaker containing 100 ml phosphatebuffered saline (PBS, pH 7.4). Samples of 1000 μl were withdrawn at suitable time intervals for 8 d, and the same volume of freshly prepared medium was added. Stirring was continued at 37±0.5° at 100 rpm. Samples were then tested using the validated HPLC method. In vitro dissolution/release study was conducted on six different batches of PNPs; mean values and standard deviation were evaluated. Data obtained in the in vitro drug release studies was further investigated for release kinetics using DDSolver software program[5,15,16].
Particle size, size distribution, zeta potential and morphology:
Average particle size, size distribution and zeta potential values of formulations prepared were analyzed using Zetasizer Nanoseries (Malvern Instruments, England). Measurements were repeated in triplicate. The particle shape and surface properties of the freshly prepared nanoparticle formulation and KL were investigated by SEM (Zeiss Ultra Plus Fesem, Germany) after spreading the formulation and KL onto the doublesided carbon tape pre-affixed on a specimen stub and were then allowed to dry at room-temperature. Samples were coated with a thin layer of gold (100 Å) by a sputter coater under 50 mA for 2 min before observed under SEM. Images were taken at high vacuum mode with varying magnifications at an accelerating voltage of 3.0-5.0 kV.
Differential scanning calorimetry (DSC) analysis:
Physical state of KL incorporated was characterized by DSC (DSC-60, Shimadzu Scientific Instruments, Columbia, MI, USA). Aluminum crucibles with 5 mg samples were analyzed under nitrogen gas (50 ml/min) and heating rate of 10°/min at a temperature range of 30 and 300°. Pure KL, pure PLGA, physical mixture and blank formulation were also analyzed.
X-ray diffraction (XRD) analysis:
XRD analyses were performed (Rikagu Corporation (D/Max-3C, Japan) within the range of 5-55° at 2 θ with 2°/min scanning rate and using 40 kV voltage with 20 mA current intensity level. XRD spectra were also obtained for pure PLGA, pure KL, physical mixture and blank formulation and were used as references.
Fourier-transform infrared spectroscopy (FTIR) analysis:
FTIR spectra were recorded using Shimadzu IR Prestige-21 (Shimadzu Corporation, Kyoto, Japan) at the wavelength range of 4000-500 cm–1. Pure polymer (PLGA), pure active agent (KL), physical mixture and blank formulation were also analyzed and were used as references.
Nuclear magnetic resonance (1H-NMR) analysis:
1H-NMR analyses were performed using UltraShieldTM CPMAS NMR (Brucker, Rheinstetten, Germany). Samples were prepared by dissolving formulations in deuterated chloroform (CDCI3). Pure KL, pure PLGA, physical mixture and blank formulation were also analyzed.
Cytotoxicity of PNPs:
The colorimetric 3-(4,5-dimethylthiazol-2-yl)-2,5- diphenyltetrazolium bromide (MTT) method was used for the quantitative determination of cell cytotoxicity. MTT (Greiner, Sigma-Aldrich) was dissolved in PBS (pH 7.4) with a concentration of 5 mg/ml. NIH/3T3 mouse fibroblasts cell line was grown in Dulbecco`s modified Eagle media medium supplemented by 10 % fetal bovine serum, 4-(2-hydroxyethyl)-1- piperazineethanesulfonic acid (25 mM), NaHCO3 (3.7 g/l) and penicillin (100 units/ml) and then seeded onto 96-well plates (Greiner, Sigma-Aldrich) at a density of 2×10⁴ cells per well in growth medium (100 μl). Cells were incubated at 37° (under 5 % CO2 and 95 % air) for 24 h in a humidified atmosphere containing 5 % CO2. When the desired cell confluence was reached, the growth medium spent was removed from each well and replaced with growth medium, which contained different concentrations of KL and PNPs. KL was dissolved in culture medium while PNPs was dispersed in culture medium at the loaded KL quantities of them and incubated for 48 h. Each formulation was tested eight times. After the incubation period, 20 μl of MTT dye was added to each well and incubated for more 2 h for the transformation of MTT to formazan salt by the presence of the living cells. Spectrophotometry-grade dimethyl sulfoxide (200 μl) was then added to each well to dissolve formazan crystals. Following 30 min of incubation, absorbance of the plates was measured at 570 nm using a spectrometric microplate reader (Cytation 5 Cell Imaging Multi-Mode Reader, US). Results were expressed as percent absorbance of the control cells.
Results and Discussion
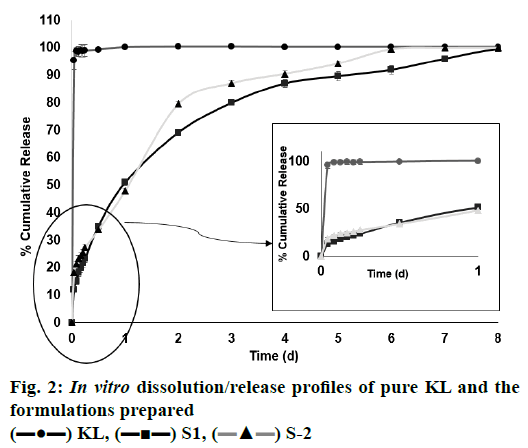
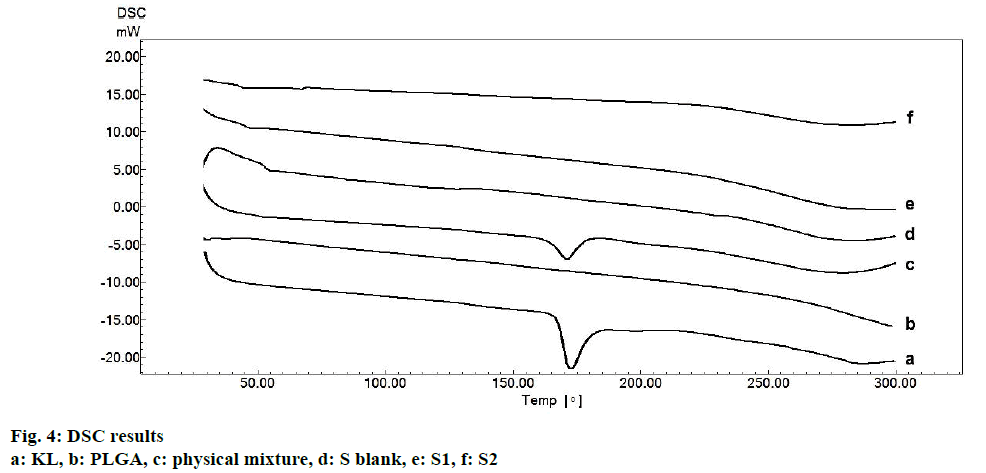
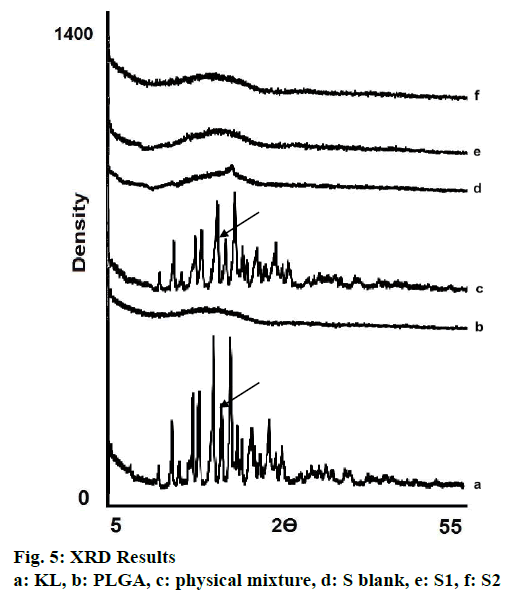
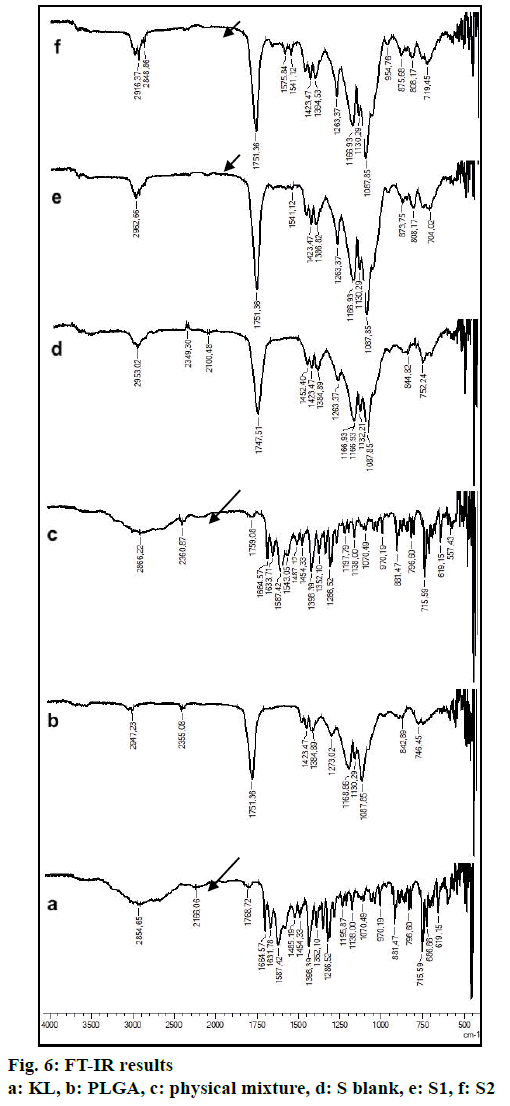
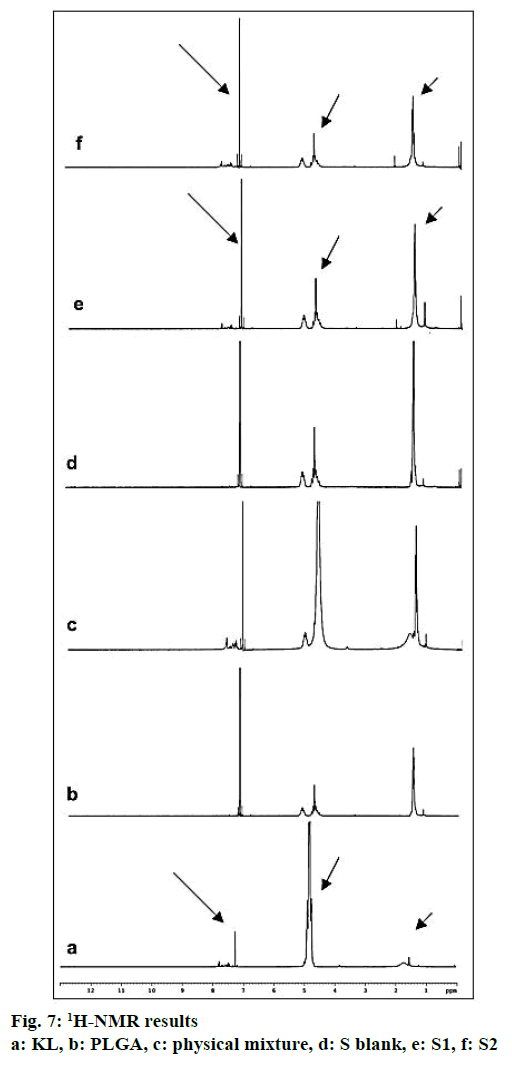
In the HPLC validation study, linearity was determined to be at a concentration range of 5-900 μg/ml with the linearity Eqn., y=51438x+70090 (r2=0.9999). The method was decided to be precise due to RSD values of <2 % for both repeatability and intermediate precision. HPLC method used showed an accuracy of 99.653±0.081, 100.092±0.143, and 100.324± 0.219 % for the concentrations of 100, 200, and 300 μg/ml, respectively (n=6). Recovery of the method was found to be satisfactory owing to <2 % RSD value. Limit of detection and limit of quantitation was determined to be 0.00002 and 0.00005 μg/ml, respectively. EE % values calculated according to Eqn. 1. In vitro dissolution/release profiles of pure KL and the formulations prepared are presented in fig. 2. Rate constant (k), coefficient of determination (Rsqr, R2, or COD), the adjusted coefficient of determination (Rsqr_adj or R2adjusted), the Akaike Information Criterion (AIC), the model selection criterion (MSC) and n for only Korsmeyer-Peppas model values are given in Table 3. PS, PDI, zeta potential and EE % values calculated according to Eqn. 1 are shown in Table 4. SEM images of KL, PLGA and formulations prepared are presented in fig. 3. DSC thermograms, XRD profiles, FTIR and 1H-NMR spectra of KL, PLGA, physical mixture and formulations prepared are presented in figs. 4, 5, 6 and 7, respectively.
| Code | Model and Equation | Evaluation criteria | |||
|---|---|---|---|---|---|
| R2adjusted | AIC | MSC | n/m* | ||
| S1 | Zero-order model | 0.971 | 148.260 | 3.446 | - |
| S2 | 0.957 | 155.518 | 3.066 | - | |
| S1 | First-order model | 0.234 | 220.224 | 0.175 | - |
| S2 | 0.023 | 224.476 | 0.068 | - | |
| S1 | Higuchi model | 0.827 | 187.538 | 1.661 | - |
| S2 | 0.738 | 195.500 | 1.249 | - | |
| S1 | Korsmeyer-Peppas | 0.891 | 178.318 | 2.080 | 0.396 |
| S2 | 0.740 | 196.249 | 1.215 | 0.372 | |
| S1 | Korsmeyer-Peppas with Tlag model | 0.924 | 171.083 | 2.409 | 0.368 |
| S2 | 0.913 | 173.120 | 2.266 | 0.317 | |
| S1 | Korsmeyer-Peppas with F0 model | 0.878 | 181.525 | 1.934 | 0.448 |
| S2 | 0.873 | 181.299 | 1.895 | 0.403 | |
| S1 | Hixson-Crowell model | 0.831 | 186.965 | 1.687 | - |
| S2 | 0.602 | 204.710 | 0.830 | - | |
| S1 | Hopfenberg model | 0,922 | 170,853 | 2,419 | - |
| S2 | 0,936 | 165,426 | 2,616 | - | |
| S1 | Peppas-Sahlin model | 0,996 | 103,913 | 5,462 | 0.542 |
| S2 | 0,982 | 137,977 | 3,864 | 0.450 | |
m*: Diffusional exponent and similar exponent like n, m use in Peppas-Shalin model equation only
Table 3: In vitro kinetic data for formulations
| Code | PS | PDI | ZP | EE % |
|---|---|---|---|---|
| S Blank | 490.30±2.20 | 0.27±0.02 | -28.00±0.21 | - |
| S1 | 512.60±5.20 | 0.43±0.03 | -27.00±1.13 | % 78.789±0.953 |
| S2 | 518.30±3.10 | 0.44±0.02 | -20.00±1.21 | % 59.634±1.624 |
PS: particle size, PDI: poly dispersity index, ZP: zeta potential, EE %: encapsulation efficiency(%), mean±SD, n=3
Table 4: Particle size, PDI, zeta potential values and EE %
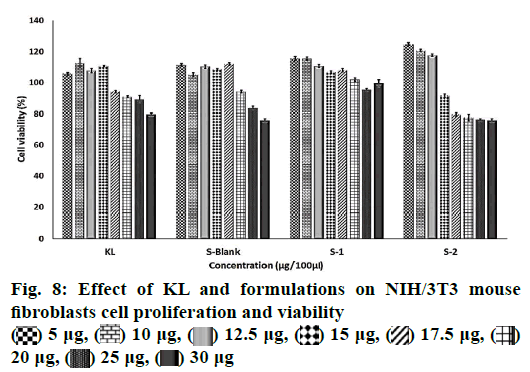
In order to establish whether the preparing of particle may modify the toxicity profile of the KL having any cytotoxic effect, PNPs were assayed using NIH/3T3 mouse healthy fibroblasts cells. NIH/3T3 cells were treated with increasing concentrations of KL as control, S Blank, formulations S1 and S2 in concentrations ranging from 5 to 30 μg (expressed as ketoprofen content). Cell viability was determined by absorbance values obtained in cell culture and results were demonstrated in fig. 8 together with their standard deviations. All data are shown as mean±SD of three independent experiments, each done in duplicate. Different proportions of acetonitrile and 0.03 M KH2PO4 buffer and flow rates were tested for method optimization and it was found that acetonitrile:0.03 M KH2PO4 buffer in the proportion of 60:40 v/v and a flow rate of 1 ml/min gave admissible retention time (Rt) and good resolution for the mobile phase, placebo formulations and KL.
Correlation coefficient (r2) of 0.9999 was highly significant in linearity study. RSD values for both intermediate precision and repeatability were <2 %. Perfect precision and accuracy was assessed through statistical analysis of linearity, precision, accuracy. Validation tests based on ICH Q2 (R1) guidelines indicated the potential use of the method developed for routine analysis of KL in pure and pharmaceutical preparations and formulations[13]. In conclusion, procedure proposed in this study could be used for routine, simultaneous and concurrent KL determination.
Drug loading capacity to PNPs is an important factor in formulations because higher loading requires smaller amounts of NPs for a given dose[17]. Higher values were obtained for all NPs prepared as a percentage of EE %. EE % varied from 59 to 78 %, depending upon the polymer:drug ratio. In the prepared PNPs formulations, it was observed that the amount of KL encapsulated in the polymer decreased as the amount of KL increased. With respect to the amount of KL initially used (5 and 10 % w/w), EE decreased as the KL concentration increased. This means that the presence of the drug in the maximum amount that can be trapped in the polymer matrix in the dispersed state; that is, the polymer has a limit of miscibility with the active drug substance[14].
The release properties of all formulations of the prepared KL nanoparticles were evaluated in vitro. Release studies were performed using the diffusion technique in pH 7.4 phosphate buffer on a magnetic stirrer. KL release profile from PLGA-based PNPs is shown in fig. 2. It has been observed that as the polymer concentration increased, drug release from the formulation decreased and all formulations showed a biphasic release pattern with an initial burst effect[18]. The mechanism of burst release is thought to depend on two factors. The first of these factors is caused by the KL that has absorbed on the surface of the nanoparticles. The second factor is thought to depend on the leakage of the KL from the nanoparticles[18]. To evaluate the release characteristics in a different way; careful examination of fig. 3 revealed an inverse relationship between release rate and nanoparticle size. It has been shown in the literature that larger microspheres are degraded faster than smaller microspheres. This is probably due to the accumulation of acidic products that increase in polymer hydrolysis in large microspheres. The hydrolysis that occurs in PLGA-based systems starts immediately in water. Hydrolysis produces acids that further catalyze hydrolysis. This autocatalytic process leads to faster degradation of the surface at the center of the matrix of the PLGA structure. This effect becomes more pronounced as the size of the nanoparticle system increases[14,19]. It is observed in fig. 2 that the formulation S2 has larger particle size and is relatively faster to degrade and has a higher release rate than the formulation S1. Regarding the release of KL from PNPs, a biphasic profile consisting of a rapid phase followed by a slow release phase was observed and release was observed over the 8 d period of dissolution whereas the pure KL exhibited a rapid release profile of 100.153±0.244 % (mean±SD) in last first day. The release rates from the formulations S1 and S2 were, 99.465±0.054 and 99.972± 0.143 % (mean±SD), respectively, after 8 d, fig. 3 clearly showed that sustained release was obtained relative to pure KL from the two formulations prepared.
When a new oral dosage form is developed, its dissolution behavior should be quantitatively analyzed. Dissolution analysis involves comparison of the dissolution profiles and the application of mathematical models to identify the drug release pattern. In this study, DDSolver named application, which is an Excel add-on software package designed to analyze the data obtained from dissolution experiments, was used[16] The selection of a suitable model for fitting dissolution data is essential, not only for quantitative evaluation of drug release characteristics but also for comparison of dissolution profiles using model-dependent approaches[15]. The DDSolver provides a number of statistical criteria for evaluating the conformance of a model, including the correlation coefficient (R_obs-pre), the coefficient of determination (Rsqr, R2, COD), the adjusted coefficient of determination corrected (Rsqr_adj, R2adjusted mean square error, AIC and MSC[5,15,16]. Among these criteria, R2adjusted, AIC and MSC were the most popular in the resolution model definition[15]. In this study, zero-order kinetics, firstorder kinetics, Higuchi, Korsmeyer-Peppas model, Korsmeyer-Peppas with Tlag model, Korsmeyer-Peppas with F0 model, Hopfenberg, Hixon-Crowell and Peppas-Sahlin models were selected for evaluation in DDSolver program. After calculation of cumulative amount released, data obtained was transferred to DDSolver program to determine important criteria, R2adjusted, AIC, MSC and n/m for only Peppas models. The highest R2adjusted and MSC values and the lowest AIC values are used for the evaluation of the best fit. When examined and compared those models according to the important criteria mentioned above, Peppas-Sahlin model was selected to be the best kinetic model. Table 3 also showed the diffusional exponent (n/m) for KL release from PNPs. According to the literature, when n/m=0.43 the drug release mechanism is governed by the Fickian diffusion, when 0.43<n<0.85 it is anomalous (non-Fickian) transport, and when n=0.85 it is case II transport[20]. ‘m’ values for formulations S1 and S2 were, 0.542 and 0.450, respectively. In the formulations prepared, the exponential coefficient m was determined to be related to the non-Fickian diffusion base[20]. As a result, for formulations S1 and S2, the best fit was observed with the Peppas-Sahlin model showing that the drug delivery mechanism was controlled by non-Fickian diffusion.
Particle size and distribution is one of the important physical properties of colloidal systems such as PNPs. The particle size distribution of the PNP formulation plays an important role in the physical stability and activity of the colloidal systems. It has also been found that the size of PNPs plays an important role in the adhesion and interaction with biological cells[21]. The mean particle size of all formulations ranged from 490.3±2.2 to 518.3±3.1 nM (mean±SD) with a relative monodisperse distribution (Table 4). The smaller particles have a higher surface area/volume ratio, which facilitates the release of the encapsulated drug from the nanoparticles by diffusion and surface erosion and also has the advantage of penetrating into drug-loaded nanoparticles and penetrating into physiological drug barriers[21,22]. The polydispersity index (PDI) value, which defines particle size distribution is in the range of 0.01 and 0.5-0.7 for monophasic systems; values higher than 0.7 are indicative of a very wide particle size distribution and the values close to zero means narrow particle size distribution[5,23]. All PNP formulations prepared in this study presented PDI values lower than 0.44 and therefore particle size distribution was found to be uniform.
Zeta potential value associated with short/long term stability of PNPs demonstrating high positive or low negative (+30/-30 mV) values lead to high stability owing to the power of repulsion/attraction forces and also zeta potential of nanoparticles is commonly used to characterize the surface property of PNPs. Zeta potential values of PLGA PNPs (Table 4) were found to be negative resulting from the total negative charges of chemical groups on PLGA polymer in Milli-Q water. Similar results were seen in the literature[14,24]. The zeta potential of PNPs was found to be below –20 mV, indicative of high stability of the PNPs suspended in aqueous medium[14].
Fig. 3 represented the surface images of PLGA PNPs obtained by SEM. SEM images showed that all PNPs prepared were in spherical shape with smooth surfaces. KLs crystalline structure was not observed in the formulations indicating successful incorporation of KL into both polymers[5,25]. Fig. 4 showed DSC curves, which provided quantitative and qualitative information about physical structure of the active substance in the nanoparticles and in the control samples, i.e. the raw material (pure KL and pure PLGA) and physical mixture. Pure KL showed a sharp endothermic peak that corresponded to melting at 170°, indicating its crystalline nature. In addition, endothermic peak of KL at 170° was compatible with the literature[2]. Pure PLGA exhibits an endothermic event (60°) corresponding to the relaxation light peak following the glass transition. The reason for not observing the melting peak is the amorphous nature of PLGA[26]. Peak appearance of KL in physical mixture and complete disappearance of KL peak may be due to either the homogeneous polymeric matrix formation or to the dilution effect by the polymer[27]. Disappearance of endothermic KL peak in all DSC curves of PNPs prepared indicated incorporation of KL, homogenous matrix formation and amorphous structure[28,29]. DSC curves of the PM (physical mixture) of the KL with PLGA showed the stability of the active agent in the polymeric carrier owing to the presence of KL in the crystalline structure[30].
XRD is the most important and well-defined analytical method frequently used in nanotechnologic research because it clarifies molecular structure of nanoparticles, examines crystal state/investigates polymorphism and also provides information about stability so diffraction pattern gives detail of the crystalline/amorphous structure of the nanomaterials[5,30]. Structural changes need to be monitored, as polymorphic changes of active agents are important factors that may affect the drug dissolution rate and bioavailability of the drug[30]. XRD diffraction profiles shown in fig. 5 indicated that KL showed sharp peaks at 2Ø-angles representing crystal structure. Nevertheless pure PLGA showed amorphous state as seen in fig. 5. No crystal peak/ signal were detected in the diffraction spectrum of S1 and S2 showing that the KL was dispersed within the amorphous polymer matrix as indicated by DSC analyses results[5,27,30].
FTIR is widely accepted as a globally used technique for the characterization of various nanoparticles including PNPs, metallic nanoparticles, carbon nanomaterials, as well as core-shell and hybrid nanoparticles. FTIR allows the detection of functional groups and adsorbed molecules on the surface of NPs as well as monitoring of surface chemistry changes[31]. FTIR analysis gives crucial information on characterization by evaluating the interactions between drug and polymer during the preparation steps of nanoparticles, comparing changes in frequency and intensity of materials to FTIR signals of pure materials[32]. KL spectrum showed absorption bands for C=O stretching vibration of acid, C=O stretching vibration of ketone, O-H band and C=C stretching vibration of the aromatic ring appeared at 1664, 1631, 3300-3100 cm-1, respectively[33]. Bands at 1541-1575 and 1138-1195 cm-1 were assigned to N–H in-plane bending and C–N stretching of amine, respectively[34]. When examine FTIR spectrum of PLGA polymer exhibited molecular vibrations of its functional groups as shown in fig. 6. Carbonyl groups gave intense bands at 1751 cm-1 due to stretching vibration present in both monomers while medium density bands between 1384 and 1130 cm-1 were respectively attributed to asymmetric and symmetric C-C(=O)-O stretches. Bands in those regions are distinctive bands often used for the characterization of esters[35,36]. The main difference between KL and PLGA is the N-H bonds. N-H bonds were observed in KL, physical mixture, S1 and S2; but were not observed in PLGA and S blank. It was observed that the characteristic KL peaks were observed and KL crystallinity was decreased for all KL-loaded PNPs. This indicated that KL is molecularly dispersed and encapsulated in the polymeric structure supporting DSC and XRD results and also no chemical interaction between PLGA and KL could be found due to the absence of new KL peaks in FTIR spectra of PNPs[5,27,37]. Physicochemical properties of nanoparticles, interaction of active ingredients with polymers/ additives and molecular mobility can be determined by NMR analysis[38]. 1H-NMR analysis performed in this study is important to determine any change of KL in the polymeric structure or encapsulation and interaction with the polymers[5,38]. 1H-NMR analysis performed in this study is important to determine any change of KL in the polymeric structure or encapsulation and interaction with the polymers. No KL peaks at 7-8 ppm range were observed in 1H-NMR spectra of S-blank and PLGA while presence of KL specific peaks was observed in spectra of KL-loaded S1 and S2 PMPs. 1H-NMR results showed molecular KL dispersion in the polymeric structures, which can also be interpreted as encapsulation of KL into PLGA nanoparticles[39].
The MTT assay was used for the quantitative determination of cell cytotoxicity[40]. The results showed no reduction in cell viability by less than 50 % (IC50) for 48 h related the increased dose of KL and formulations (fig. 8). KL, S blank and S1 demonstrated higher cell viability values than the control group at 5 and 20 μg/100 μl concentration suggesting cell renewal property. Cell renewal property of KL was reported that the presence of lysine in KL is an evident protection of the epithelium without the observation of ketoprofen free acid[41]. Renewal property of formulation S2 with lower KL EE % showed the highest viability values when compared to KL, S blank and S1 at 5 and 12.5 μg. The KL salt and its spray-dried form exhibited a reduction in cell proliferation only at very high concentrations when the compared ketoprofen free acid. This situation was correlated with particles engineering because of the reducing the cytotoxic effect of the active compound after formulation[41]. It has been shown that the lysine is associated with a marked regulation of oxidative stress signals and has protective effect on the cell[42]. Results of this study indicated that the encapsulation of KL in PLGA using spray drying method gave synergistic effects on the proliferation of cells with nontoxic and cell renewal properties formulation. This revealed that the formulations S1 and S2 even at the highest concentration tested would still be nontoxic even with a prolonged release pattern.
In this study KL incorporated PLGA-based PNPs were formulated for extended analgesic activity on oral application. In vitro characteristic properties and cytotoxic profile of the PNPs were evaluated in detail. Results demonstrated that nano-sized and spherical particles were obtained using spray drying. Solid state characterization (DSC, XRD, FTIR and NMR) results supported each other and these results proved that KL was loaded into the polymer. Due to the high encapsulation efficacy of the nanoparticles, KL release could be extended up to 8 d, which would enhance the therapeutic efficacy of the formulations prepared. Cytotoxic evaluation revealed the safety of PNPs with relatively high cell viability data at certain concentrations, because of the nontoxic S1 and S2 formulations even at the highest concentration for 48 h demonstrated higher cell viability than the control group and the KL. Therefore it could be concluded as KL-loaded PLGA-based PNPs are effective carrier system for the oral application of KL for extended release. However, in vivo experiments are necessary to confirm the in vitro findings in order to make a final decision.
Acknowledgements:
This study was financed by Anadolu University Scientific Research Project Foundation (No: 1706S379). The authors would like to thank Berko İlaç (İstanbul/Turkey) for providing a gift sample of KL. Faculty of Science is acknowledged for XRD and SEM, DOPNALAB Faculty of Pharmacy for FTIR and 1H-NMR analysis facilities.
References
- Gentile M, Boltri L, Clavenna G. Parenteral pharmaceutical compositions containing ammoniumalkyl salts of 2-arylpropionic acids. WIPO (PCT): WO1997024114A1. 1999.
- Cerciello A, Auriemma G, Del Gaudio P, Cantarini M, Aquino RP. Natural polysaccharides platforms for oral controlled release of ketoprofen lysine salt. Drug Develop Ind Pharm 2016;42(12):2063-69.
- Cimini A, Brandolini L, Gentile R, Cristiano L, Menghini P, Fidoamore, A, et al. Gastroprotective effects of L‐lysine salification of ketoprofen in ethanol‐injured gastric mucosa. J Cell Physiol 2015;230(4):813-20.
- Messeri A, Busoni P, Noccioli B, Murolo S, Ivani G, Grossetti R, et al. Analgesic efficacy and tolerability of ketoprofen lysine salt vs paracetamol in common paediatric surgery. A randomized, single‐blind, parallel, multicentre trial. Pediatr Anesth 2003;13(7):574-8.
- Öztürk AA, Yenilmez E, Arslan R, Şenel B, Yazan Y. Dexketoprofen trometamol-loaded kollidon® SR and eudragit® RS 100 polymeric nanoparticles: formulation and ın vitro-ın vivo evaluation. Lat Am J Pharm 2017;36:2153-65.
- Rao JP, Geckeler KE. Polymer nanoparticles: preparation techniques and size-control parameters. Prog Polym Sci 2011;36(7):887-913.
- Patel RP, Patel MP, Suthar AM. Spray drying technology: an overview. Indian J Sci Technol 2009;2(10):44-47.
- Akagi T, Baba M, Akashi M. Biodegradable nanoparticles as vaccine adjuvants and delivery systems: regulation of immune responses by nanoparticle-based vaccine. In: Kunugi S, Yamaoka T, editors. Polymers in Nanomedicine. Advances in Polymer Science. Vol 247. Berlin, Heidelberg: Springer; 2011. p. 31-64.
- Kumari A, Yadav SK, Yadav SC. Biodegradable polymeric nanoparticles based drug delivery systems. Colloids Surf B Biointerfaces 2010;75(1):1-18.
- Hines DJ, Kaplan DL. Poly (lactic-co-glycolic) acid− controlled-release systems: experimental and modeling insights. Crit Rev Ther Drug Carrier Syst 2013;30(3):257-76.
- Derman S, Kızılbey K, Akdeste ZM. Polymeric nanoparticles. J Eng Nat Sci 2013;31:107-20.
- Anacardio R, Vigilante P, Carlucci G. Development and validation of a HPLC method for the simultaneous determination of ketoprofen lysine salt and preservative in OKI® spray. J Liq Chromatogr Relat Technol 2008;31(7):1060-71.
- ICH, Internatıonal Conference on Harmonisation of Technical Requirements for Registration of Pharmaceuticals for Human Use. ICH Harmonised Tripartite Guideline Validation of Analytical Procedures: Text and Methodology Q2 (R1) 2014. Available from: https://www.ich.org/fileadmin/Public_Web_Site/ICH_Products/Guidelines/Quality/Q2_R1/Step4/Q2_R1__Guideline.pdf.
- Martín-Banderas L, Alvarez-Fuentes J, Durán-Lobato M, Prados J, Melguizo C, Fernández-Arévalo M, et al. Cannabinoid derivate-loaded PLGA nanocarriers for oral administration: formulation, characterization, and cytotoxicity studies. Int J Nanomedicine 2012;7:5793-806.
- Zhang Y, Huo M, Zhou J, Zou A, Li W, Yao C, Xie S. DDSolver: an add-in program for modeling and comparison of drug dissolution profiles. AAPS J 2010;12(3):263-71.
- Zuo J, Gao Y, Bou-Chacra N, Lobenberg R. Evaluation of DDSolver software applications. Biomed Res Int 2014;2014:204925.
- Pandav S, Naik J. Sustained release of ramipril from ammonio methacrylate copolymer matrix prepared by high pressure homogenizer. Int J Pharm Pharm Sci 2014;6(1):349-53.
- Bhambere D, Shirivastava B, Sharma P, Bukan N, Gide P. Preparation and optimization of dry plga nanoparticles by spray drying technique. Partıcul Sci Technol 2013;31(5):533-40.
- Fredenberg S, Wahlgren M, Reslow M, Axelsson A. The mechanisms of drug release in poly (lactic-co-glycolic acid)-based drug delivery systems—a review. Int J Pharm 2011;415(1-2):34-52.
- Unagolla JM, Jayasuriya AC. Drug transport mechanisms and in vitro release kinetics of vancomycin encapsulated chitosan-alginate polyelectrolyte microparticles as a controlled drug delivery system. Eur J Pharm Sci 2018;114:199-209.
- Yenilmez E. Desloratadine-Eudragit® RS100 Nanoparticles: Formulation and Characterization. Turk J Pharm Sci 2017;14(2):148-56.
- Thagele R, Mishra A, Pathak AK. Formulation and characterization of clarithromycin based nanoparticulate drug delivery system. Int J Pharm Life Sci 2011;2(1):510-15.
- Lopedota A, Trapani A, Cutrignelli A, Chiarantini L, Pantucci E, Curci R, et al. The use of Eudragit® RS 100/cyclodextrin nanoparticles for the transmucosal administration of glutathione. Eur J Pharm Biopharm 2009;72:509-20.
- Martin-Banderas L, Muñoz-Rubio I, Prados J, Álvarez-Fuentes J, Calderón-Montaño JM, López-Lázaro M, et al. In vitro and in vivo evaluation of Δ9-tetrahidrocannabinol/PLGA nanoparticles for cancer chemotherapy. Int J Pharm 2015;487(1-2):205-12.
- Gupta NV, Natasha S, Getyala A, Bhat RS. Bioadhesive vaginal tablets containing spray dried microspheres loaded with clotrimazole for treatment of vaginal candidiasis. Acta Pharm 2013;63(3):359-72.
- Mainardes RM, Gremião MPD, Evangelista RC. Thermoanalytical study of praziquantel-loaded PLGA nanoparticles. Rev Bras Cienc Farm 2006;42(4):523-30.
- Pagar K, Vavia P. Rivastigmine-loaded l-lactide-depsipeptide polymeric nanoparticles: decisive formulation variable optimization. Sci Pharm 2013;81(3):865.
- Mainardes RM, Evangelista RC. Praziquantel-loaded PLGA nanoparticles: preparation and characterization. J Microencapsul 2005;22(1):13-24.
- Md S, Ali M, Baboota S, Sahni JK, Bhatnagar A, Ali J. Preparation, characterization, in vivo biodistribution and pharmacokinetic studies of donepezil-loaded PLGA nanoparticles for brain targeting. Drug Dev Ind Pharm 2014;40(2):278-87.
- Basaran E. Ocular Application of Dirithromycin Incorporated Polymeric Nanoparticles: an in vitro Evaluatione. Turk J Pharm Sci 2017;14(2):191-201.
- López-Lorente ÁI, Mizaikoff B. Recent advances on the characterization of nanoparticles using infrared spectroscopy. Trends Anal Chem 2016;84:97-106.
- Devi TR, Gayathri S. FTIR and FT-Raman spectral analysis of paclitaxel drugs. Int J Pharm Sci Rev Res 2010;2(2):106-10.
- Choi SH, Kim SY, Ryoo JJ, Park JY, Lee KP. FT-Raman and FT-IR spectra of the non-steroidal anti-inflammatory drug ketoprofen included in cyclodextrins. Anal Sci 2001;17:i785.
- Carneir J, Döll-Boscardin PM, Fiorin BC, Nadal JM, Farago PV, Paula JPD. Development and characterization of hyaluronic acid-lysine nanoparticles with potential as innovative dermal filling. Braz J Pharm Sci 2016;52(4):645-51.
- Singh G, Kaur T, Kaur R, Kaur A. Recent biomedical applications and patents on biodegradable polymer-PLGA. Int J Pharmacol Pharm Sci 2014;1:30-42.
- Gümüşderelioğlu M, Deniz G. Synthesis, characterization and in vitro degradation of poly (dl-lactide)/poly (dl-lactide-co-glycolide) films. Turk J Chem 1999;23(2):153-62.
- Vino S, Abinaya A, Divya V, Ghosh AR. Controlled release of phenytoin sodium from casein microparticles. Int J Pharm Bio Sci 2014;5(2):233-41.
- Jenning V, Mäder K, Gohla SH. Solid lipid nanoparticles (SLN™) based on binary mixtures of liquid and solid lipids: a 1H-NMR study. Int J Pharm 2000;205(1-2):15-21.
- Başaran E, Yenilmez E, Berkman MS, Büyükköroğlu G, Yazan Y. Chitosan nanoparticles for ocular delivery of cyclosporine A. J Microencapsul 2014;31(1):49-57.
- Büyükköroğlu G, Şenel B, Gezgin S, Dinh T. The simultaneous delivery of paclitaxel and Herceptin® using solid lipid nanoparticles: in vitro evaluation. J Drug Deliv Sci Technol 2016;35:98-105.
- Brandolini L, d'Angelo M, Antonosante A, Villa S, Cristiano L, Castelli V, et al. Differential protein modulation by ketoprofen and ibuprofen underlines different cellular response by gastric epithelium. J Cell Physiol 2018;233(3):2304-12.
- Stigliani M, Aquino RP, Del Gaudio P, Mencherini T, Sansone F, Russo P. Non-steroidal anti-inflammatory drug for pulmonary administration: design and investigation of ketoprofen lysinate fine dry powders. Int J Pharm 2013;448(1):198-204.
 KL,
KL,  S1,
S1,  S-2
S-2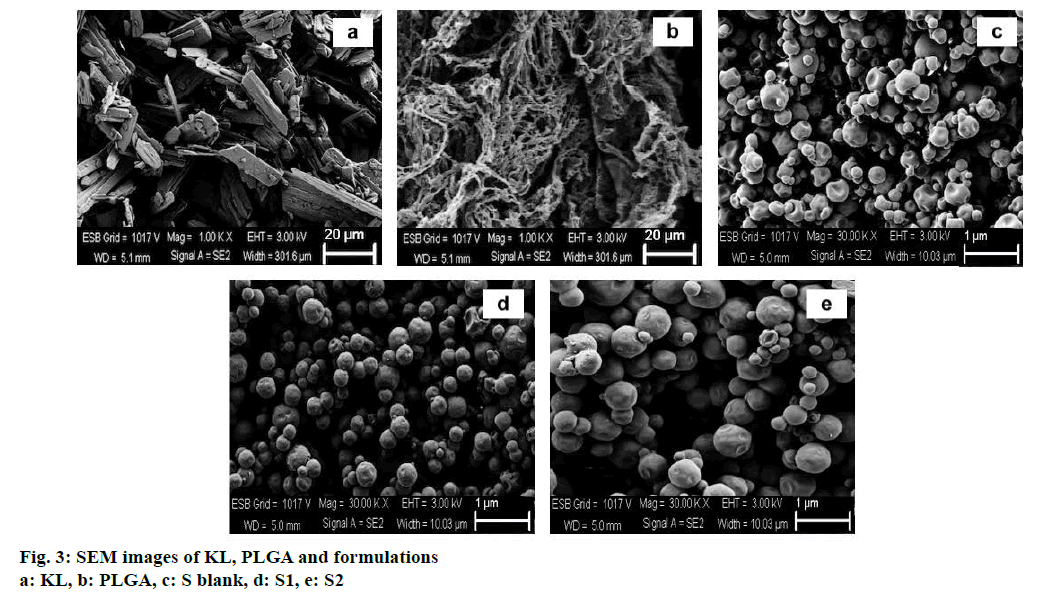
 5 μg,
5 μg,  10 μg,
  12.5 μg,
  15 μg,
  17.5 μg,
  20 μg,
  25 μg,
  30 μg
30 μg


