- Corresponding Author:
- K. G. Baheti
Department of Pharmaceutical Chemistry, Charak College of Pharmacy and Research, Wagholi, Pune-412 207, India. E-mail: nk_baheti@yahoo.com
| Date of Submission | 15 August 2013 |
| Date of Revision | 24 September 2014 |
| Date of Acceptance | 29 September 2014 |
| Indian J Pharm Sci 2014;76(6):557-559 |
Abstract
Ultra violet spectrophotometric estimation of the raltegravir potassium, an integrase inhibitor antiretroviral agent was estimated by Ultra violet absorption maxima method at λmax of 328 nm and UV area under curve method in the wave length range of 323-333 nm. The Beer's law obeyed in the concentration range of 3-55 μg/ml and correlation coefficients were found to be more than 0.996 for both methods. The results of the analysis were 100.58±0.99 and 99.69±0.59 by absorption maxima and area under curve method respectively. Both the methods were validated as per ICH guidelines.
Keywords
UV spectrophotometry, raltegravir potassium, area under curve
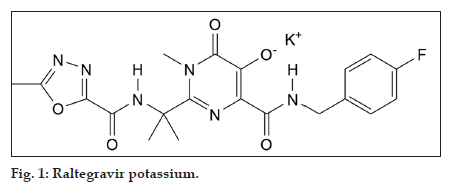
Raltegravir, is a HIV integrase strand transfer inhibitor, which prevents the insertion of viral DNA into the genome of the hostcell and consequently viral replication. Raltegravir potassium, chemically potassium 4-[(4-fluorobenzyl)carbamoyl]-1-methyl-2- (1-methyl-1-{[(5-methyl-1,3,4-oxadiazol-2-yl)carbonyl] amino}ethyl]-6-oxo-1,6-dihydropyrimidine-5-olate [1] (fig. 1). Literature survey revealed that UV [2] and HPLC [2-5] methods were reported for the estimation of raltegravir potassium alone and in combinations with other drugs.In the reported UV method [2], the determination was carried out at λmax219 nm by calibration curve method only with the linearity of 3-15 μg/ml in methanol. Hence, it was thought to determine raltegravir potassium by different UV methods to improve the analytical profile and linearity rangein UV methods.
All the chemicals of analytical grade were used. Spectral and absorbance measurement were made on a Shimadzu double beam UV/Vis spectrophotometer 1800 and a Systronic double beam UV/Vis spectrophotometer 2203 with 10 mm paired quartz cells. A Shimadzu balance (BL-220H) was used for weighing. Raltegravir potassium was obtained from Emcure Pharmaceuticals, Pune. The raltegravir potassium tablet, Isentress (Label claim 400 mg) of E. Merck (India) Ltd., Mumbai, were obtained from a local pharmacy shop.
A stock solution of raltegravir potassium (1 mg/ml) was prepared by dissolving 100 mg of raltegravirin a 50:50 mixture of methanol and water in a 100 ml volumetric flask. From the working standard solution, suitable dilutions (3-55 μg/ml) were obtained for linearity study.
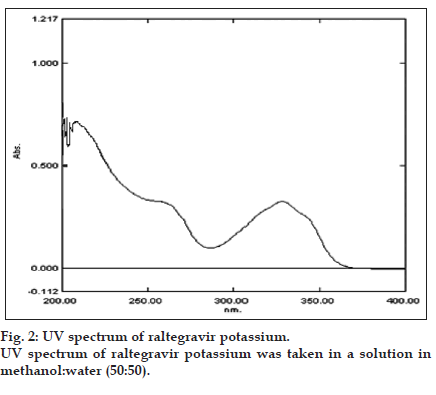
In UV absorption maxima method, a solution of 10 μg/ ml was scanned over the UV range, which gave the maximum absorbance at the wavelength. The λmax of 328 nm was selected. Similarly, by using the same solution, the area under curve range was determined and found to be 323-333 nm (fig. 2). Both the methods were found to be specific as there was no change in the λmax and absorbance of raltegravir potassium in the presence of the excipients. The linearity was found to be 3-55 μg/ml by both methods. Both the methods were validated as per ICH guidelines [6] for accuracy, precision, repeatability, limit of detection, limit of quantitation and ruggedness (Table 1).
| Parameters | Absorptionmaxima method | Area under curve method |
|---|---|---|
| Beer’s law range | 3−55 µg/ml | 3−55 µg/ml |
| Coefficient of correlation | (r2) 0.996 | 0.999 |
| Slope (m) | 0.036 | 0.015 |
| Intercept (c) | 0.06 | 0.00 |
| LOD (µg/ml) | 0.91 | 1.18 |
| LOQ (µg/ml) | 2.77 | 3.60 |
LOD: Limit of detection, LOQ: limit of quantification, UV: ultravioletLOD: Limit of detection, LOQ: limit of quantification, UV: ultraviolet
Table 1: Statistical parameters of uv spectroscopic methods
Accuracy of the method was checked by recovery study using standard addition method at three different concentration levels (80, 100 and 120%). The recovery study results were found to be 99.36 to 102.31 with %RSD less than 2 (Table 2). The same solutions of recovery study were further evaluated on same day at three different times and on three different days for intraday and interday precision study. The precision of both methods was found to be good with %RSD less than 2 (Table 2).
| Recovery study (%) |
Label claim mg/tab |
Amount of substance added |
Recovery±RSD* (%) | |
|---|---|---|---|---|
| Absorption maxima method |
Area under curve method |
|||
| 80 | 400 | 320 | 99.36±0.100 | 99.23±0.250 |
| 100 | 400 | 400 | 100.21±0.990 | 98.47±0.720 |
| 120 | 400 | 448 | 102.31±0.960 | 101.12±0.860 |
*n=3, RSD: relative standard deviation
Table 2: Recovery study of uv spectroscopic methods for determination of raltegravir potassium
The limit of detection for raltegravir potassium were found to be 0.91 and 1.18 μg/ml for absorption maxima and area under curve method where as limit of quantification was found to be 2.77 and 3.60 μg/ml calculated for absorption maxima and area under curve method, respectively. The ruggedness of both the methods was performed by changing analysts and instruments. The results are given in Table 3. The robustness was performed by changing solution composition and wave length for both methods (Table 4).
| Type of analysis | % estimated ± % RSD* | |
|---|---|---|
| Absorption maxima method | Area under curve method | |
| Analyst−1 | 100.58±0.990 | 99.69±0.590 |
| Analyst−2 | 99.42±0.588 | 98.97±0.101 |
| Instrument−1 | 100.96±0.993 | 100.15±0.998 |
| Instrument−2 | 98.36±0.968 | 98.06±0.100 |
*n=5, RSD: relative standard deviation
Table 3: Ruggedness study of uv spectroscopic methods for determination of raltegravir potassium
| Parameter | Estimated±RSD* (%) | |
|---|---|---|
| Absorption maxima method | Area under curve method | |
| Methanol: Water47.5:52.5 | 99.65±0.980 | 98.55±0.583 |
| Composition (±5%)50:50 52.5:47.5 |
100.25±0.986 99.03±0.585 |
99.23±0.587 98.01±0.100 |
| Wavelength (±5 nm)323 328 333 |
101.55±0.210 100.36±0.987 101.88±0.990 |
100.05±0.997 99.96±0.996 101.80±0.880 |
*n=5, RSD: relative standard deviation
Table 4: Robustness study of uv spectroscopic methods for determination of raltegravir potassium
Twenty tablets were weighed and powdered. Tablet powder equivalent to 100 mg of raltegravir potassium was accurately weighed and transferred into a 100 ml volumetric flask and to this 25 ml of methanol and water (50:50) was added. The solution was sonicated for 20 min and filtered through Whatman filter paper 41. The final volume was made up to 100 ml to obtain concentration of 1 mg/ml raltegravir potassium. This solution was further diluted to obtain concentration 10 μg/ml and was used in analysis. The results of analysis of tablet formulation were found to be 100.58±0.99 and 99.69±0.59 by absorption maxima and area under curve method respectively (Table 5).
| Methods | Label claim mg/tab | Estimated* (%) | RSD* (%) |
|---|---|---|---|
| Absorption maxima | 400 | 100.58 | 0.990 |
| Area under curve | 400 | 99.69 | 0.590 |
*n=5, RSD: relative standard deviation
Table 5: Result of analysis for raltegravir potassium in tablet formulation
Proposed two methods were simple, economical and reliable. In the reported methods linearity range was narrow i.e. 3-15 μg/ml whereas in the proposed methods the linearity was found in the range of 3-55 μg/ml. The methods are validated and can be used for routine analysis of raltegravir potassium in bulk and tablet dosage form.
Acknowledgements
The authors are thankful to Prof. T. J. Sawant, founder secretary, JSPM’s Charak College of Pharmacy and Research, Pune for providing necessary facilities and constant support for research. The authors gratefully acknowledge Emcure Pharmaceuticals, Pune for sample of raltegravir potassium.
References
- Sweetman SC, Martindale: The Complete drug reference. 36th ed. London: Pharmaceutical Press; 2009. p. 902.
- Sudha T, Raghupathi T. RP-HPLC and UV spectrophotometeric method for estimation of Raltegravir Potassium in bulk and tablet dosage form. Global J Med Res 2011;11:9-15.
- Rambabu K, BalamuraliKK, Sambasiva R. New RP-HPLC method development and validation for analysis of antiviral drug Raltegravir. Int J Res Pharm Biotech 2011;2:2229-3701.
- Lakshmana RA, Raghu R. Validated RP-HPLC method for determination of Raltegravir in Pharmaceutical preparation. Int J Res Pharm Chem 2012;2:2231.
- Satyanarayana L, Naidu SV, Narasimha RM, Ayyanna C, Alok Kumar. The estimation of Raltegravir in tablet dosage form by RP-HPLC.Asian J Pharm Anal 2011;1:56-8.
- ICH. Q2B validation of analytical procedure: Methodology International Conference on Harmonization, Geneva, Nov 1996, 1-15.


