- *Corresponding Author:
- P. C. Hanamshetty
Department of Chemistry, Guru Nanak First Grade College, Bidar, Karnataka 585402, India
E-mail: prashant.hanamshetty@gmail.com
| Date of Received | 02 September 2022 |
| Date of Revision | 20 April 2023 |
| Date of Acceptance | 10 November 2023 |
| Indian J Pharm Sci 2023;85(6):1660-1668 |
This is an open access article distributed under the terms of the Creative Commons Attribution-NonCommercial-ShareAlike 3.0 License, which allows others to remix, tweak, and build upon the work non-commercially, as long as the author is credited and the new creations are licensed under the identical terms
Abstract
The present study proposes two straightforward, responsive and inveterate spectrophotometric techniques for the detection of amiloride hydrochloride. The methodologies are mainly relay on the generation of charge transfer complex, with the reagents 2,3-dichloro-5,6-dicyano-1,4-benzoquinone (Method A) and p-chloranilic acid (Method B), hence an enduring 1:1 stoichiometric complex were accomplished, which are yellow and pink colour correspondingly. The generated chromogens optical densities were measured at 476 and 508 nm respectively. Beer’s law been tested in the range of 5-30 μg.ml-1 and 1-6 μg.ml-1. The other analytical parameters like, Limit of Detection (LOD), Limit of Quantification (LOQ), accuracy and precisions were examined. The mentioned approaches were successfully adopted for the determination of the amiloride hydrochloride in tablet formulation with high accuracy, better recoveries and acceptable relative standard deviation.
Keywords
Method validation, amiloride hydrochloride, 2,3-dichloro-5,6-dicyano-1,4-benzoquinone, p-chloranilic acid, spectrophotometry, charge transfer complex
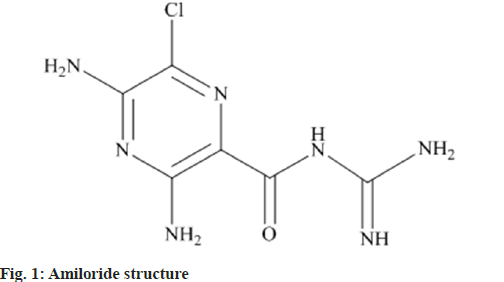
Chemically Amiloride, 3,5-diamino-6-chloro- N-(diaminomethylene) pyrazine-2-carboxamide (fig. 1), which operates through blocking the epithelial sodium channel through decreasing sodium reabsorption in the distal convoluted tubules and collecting ducts in the kidneys[1]. This stimulates the elimination of salt and water from the body, but without depleting potassium. The medicine is typically used in combination with thiazide (eg. co-amilozide) or loop diuretics (eg. co-amilofruse) (e.g. co-amilofruse). Due to its potassium-sparing qualities, hyperkalemia (high blood potassium levels) are sometimes recorded in patients on Amiloride. It is used in the therapy of hypertension and congestive heart failure. It is beneficial for the prevention of hypokalemia generated by hydrochlorothiazide especially during extended therapy. Amiloride is available on the market as combination medicine with furosemide such as Amifru tab, Amimide, Exna-k tab. It is also available in conjunction with Atenelol and Hydrochlorothiazide namely Beta-Biduret cap, BP-Loride tab, Hipres-D cap.
The inclusive literature study affirms that there are various methods available for the evaluation of amiloride, such as Ultraviolet (UV)- spectrophotometric methods in which derivative method have been used the methods have limitations in terms of scanning rates, wavelength selection and order of derivative. Despite being a sensitive approach, it is very vulnerable to a variety of factors. Due to its low repeatability, the approach is restricted to a single system and has limited uses. When a current instrumental technique (which measures signal) is unavailable, this approach is the second alternative. It performs less well when measuring zero-crossing spectra. Because the form of derivative spectra and zero order spectra is similar, a tiny alteration in a basic spectrum can dramatically modify the derivative spectrum. Poor reproducibility can affect findings when multiple spectrophotometers used for zero order spectra produce comparable results but derivatization produces different results[1-10]. In view of developing simple, straightforward and sensitive spectrophotometric techniques have been developed and validated by the authors of the current work for the analysis of Amiloride hydrochloride (AMD) in pure and pharmaceutical dosage forms; p-Chloranilic Acid (PCA) and 2,3-dichloro-5,6- dicyano-1,4-benzoquinone (DDQ) are used as π-acceptors. The developed techniques' linearity, accuracy, and precision were validated. The proposed methods basically relay on the formation of stable charge transfer complexes[11]. High Performance Liquid Chromatography (HPLC)[12-17], some of the method uses the chemometrics in conjunction with UV-spectrophotometer[14-16,24], methods uses spectrofluorimeter[17-21], a method with Capillary Zone Electrophoresis[22,23], a to assess the AMD in formulations and biological samples. However, these procedures are connected with sophistication, expertise, extraction, and more expensive than other methods. Additionally the procedures have been closely followed several of the widely known standards and approaches[24-29]. In the suggested approaches, we have employed spectrophotometer, which is a method of choice still in many pharmaceutical businesses for the regular analysis in developing nations. It serves to be one of the quickest, promising and most trustworthy strategies. The rationale of the current work is to develop and verify novel straightforward, receptive, swift, reliable and accurate spectrophotometric techniques for the measurement of AMD in its dose forms.
Materials and Methods
Equipment:
Double beam T90+ UV-Spectrophotometer (PG Instruments Ltd. USA) with quartz cells of 1 cm thickness were utilized to obtain the absorbance data.
Materials:
The reference standard AMD pure (99.5 %) was offered by Shreeji Pharma International Pvt. Ltd. Gujarat, India. which is used for the analysis, (10 mg of reference standard in 10 ml methanol the apparent conc. is 1000 μg ml-1) the lower concentrations of this solution are prepared by suitable dilutions with methanol (100 and 50 μg ml-1). Biduret® pills (Biduret®-5) which has been developed and sold by Glaxo Smithkline Pharmaceuticals Ltd. were acquired from the medical shop, which are utilized as test samples. DDQ from Sigma Aldrich chemical (0.1 % in methanol), PC from Sigma Aldrich chemicals (0.1 % in acetonitrile), AR grade solvents methanol and acetonitrile were used, deionized water was used throughout the analysis.
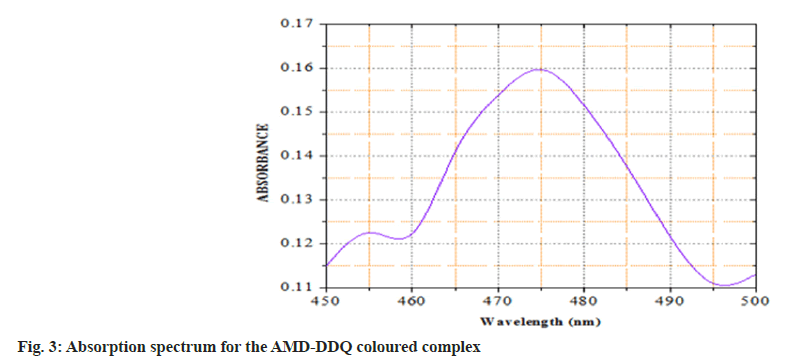
Investigative procedure:Method A: To a series of 10 ml volumetric flasks, varying fractions of working standard solution of AMD (100 μg.ml-1) varying from 0.5-3.0 ml were transferred, 1 ml of 0.1 % DDQ was added and swirled physically to get homogenous solutions, thermostated 5 min at 60°, an orange-yellow coloured species was obtained, left the solution for 10 min to develop colour at ambient conditions (room temperature). The whole bulk of the solution was brought to 10 ml using methanol[10]. Absorption spectrum of the coloured species was then scanned in the range 450 to 500 nm at 476 nm obtained the highest absorption versus blank solution, there were no interferences observed by the reagent. A calibration curve (Beers Law) was created by plotting absorbance vs. concentration of drug (μg. ml-1), the regression equation was derived. From this generalization, the sample concentration was estimated. The method has been validated using International Council for Harmonisation (ICH) guidelines[28,29].
Method B: Variable fractions of AMD working standard solution (50 g.ml-1) varying from 0.2-1.2 ml were transferred to a set of 10 ml volumetric flaks. 1 ml of (0.1 %) PCA solution was added and thoroughly blended, a pink coloured complex formed and the flask was left for 10 min to complete the colour development at room temperature. Acetonitrile was used to make the total volume to 10 ml. The Absorption spectrum of the coloured species was obtained by scanning in the range 400-800 nm and observed a λmax at 508 nm against a blank solution, there were no interferences observed by the reagent. By tracing a graph of absorbance vs. drug concentration (μg. ml-1) obtained a calibration chart, the regression equation was derived[10]. The sample concentrations were determined using this equation. The method has been validated using ICH guidelines[28,29].
Assay procedure for samples:
The content of AMD in tablet formulation was investigated. Ten [Biduret®-5] pills, each weighing 237 mg, are crushed to a fine powder. A portion of this grind, equal to 100 mg of AMD, was taken to a 100 ml standard flask and extracted with 15 ml of water by thorough mechanical shaking, filtered into a 100 ml volumetric flask through filter paper no. 41, and brought to the mark with methanol (Method A) and acetonitrile (Method B). The obvious concentration of the solution was 1000 g.ml-1; lower concentrations of this solution were prepared by stepwise dilutions with methanol/ acetonitrile to match the concentration of both procedures' reference standards[10]. Following the typical approach, the amount of AMD contained in the tablets was estimated, and the concentration was computed using regression equations.
Stoichiometry of drug to reagent:
In all procedures, the molar ratio of AMD: Reagents, was determined using Job's approach. AMD:reagents were evaluated at equimolar doses of 2×10⁻³ M. A series of solutions in the ratios of [0:10, 1:9, 2:8, ……..., 10:0] were produced, and the associated absorbances were measured. The absorbance measurements were plotted against the mole ratio in each reagent used in the two techniques the composition of both reagent and drug was taken as unity and the stoichiometric ration was obtained in the form of 0.1, 0.2, 0.3, etc. by taking the ration of drug to the whole solution[11].
Results and Discussion
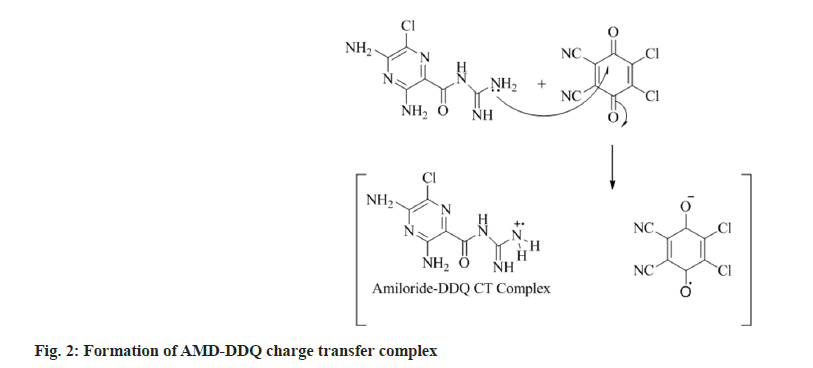
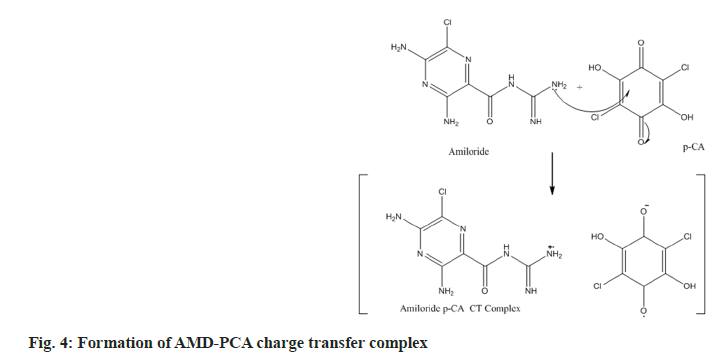
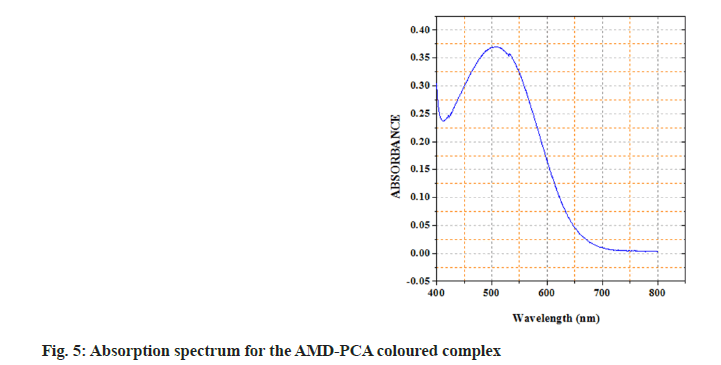
In the current study, we have chosen a medication with therapeutic potential in anti-hypertensive action and worked to develop simple and accurate testing procedures in pure and tablet dosage forms. The active ingredient has a higher tendency to give its non-bonding pair of electrons, resulting in charge transfer between the acceptor reagent DDQ and the AMD; this is the basis for method A's innovation. The interaction of AMD and DDQ in method A results in the production of an orange-yellow colour charge transfer complex. The likely chemical route for the complex's creation was shown in (fig. 2). The synthesised chromogen gave an absorbance maximum at 476 nm (fig. 3). The study's foundation was the increase in chromogen intensities as the concentration of AMD increased. The technique B was established on the charge transfer mechanism amongst the drug and the reagent PCA, which resulted in a stable pink-coloured complex (fig. 4). The generated compound exhibits a maximum absorbance of 508 nm (fig. 5). The colour intensities grew as the concentrations of AMD increased, becoming the foundation for the study. The sections that follow detail the improvement parameters that impact the chemical reaction and the analytical efficiencies of the proposed tests.
To achieve a robust technique, we tuned all of the required parameters based on their optical densities, the concentration of DDQ solution, the reaction time for the creation of chromogen and volume of DDQ solution, and also temperature effects on the formation of chromogen, listed in (Table 1). We tweaked all the essential settings based on the preceding findings to get reproducible results.
| Parameters | Studied range | Optimum |
|---|---|---|
| DDQ concentration (%) | 0.02-1.0 | 0.1 |
| Volume of 0.1 % DDQ (ml) | 0.5-2.5 | 2.0 |
| Reaction time (min) | 0-30 | 10 |
| Temperature (º) | 28-75 | 60 |
| λmax (nm) | 400-600 | 476 |
Table 1: Optimization of Coloured Complexes
We tuned all of the essential parameters for a robust approach based on their optical densities the volume of PCA solution, concentration of PCA solution and the reaction time for the chromogen formation. Thermal dependence is also established in the (Table 2).
| Parameters | Studied range | Optimum |
|---|---|---|
| PCA concentration (%) | 0.02-1.0 | 0.1 |
| Volume of 0.1 % PCA (ml) | 0.5-2.5 | 1.0 |
| Reaction time (min) | 0-30 | 10 |
| Temperature (º) | 28-75 | 28 |
| λmax (nm) | 400-600 | 508 |
Table 2: Optimization of Coloured Complexes
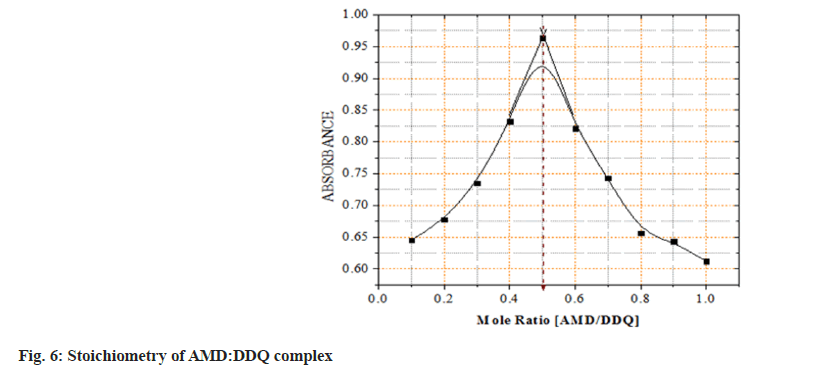
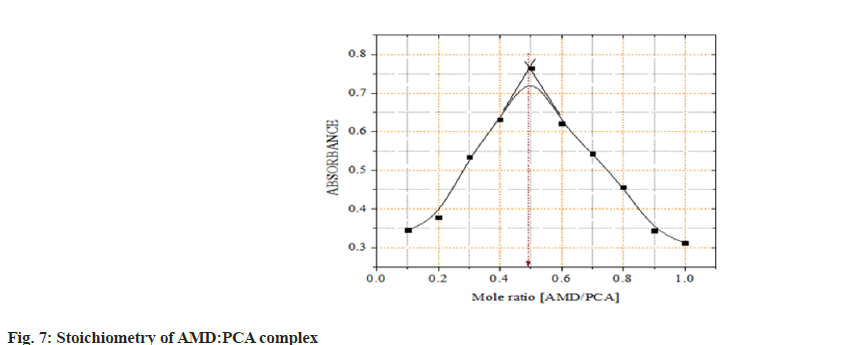
The mole ratio of AMD:DDQ was established using Job's continuous variation method. Based on the Job's graphs, it was observed that the concentration of drug and the reagent concentrations were equal by showing the maximum absorbance at 0.5 (50 % drug and 50 % reagent), it was confirmed AMD:DDQ and AMD:PCA ratios come out to be both 1:1. This establishes that each mole of AMD reacted with one mole of DDQ and PCA (fig. 6 and fig. 7).
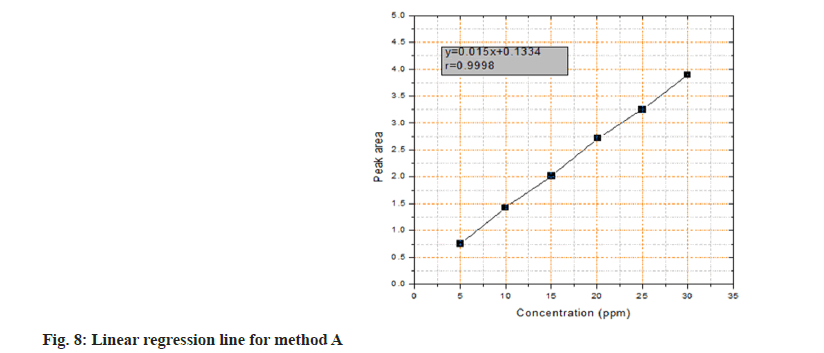
The projected assay was generated by plotting the optical density as a function of the respective AMD concentration under the aforementioned optimal reaction conditions. The least-squares approach was used to create the regression equation for the findings, and the Beer's law plot was found to be linear in the concentration range of 5.0-30.0 μg.ml-1. The straight line equation was as follows:
Y=0.015x+0.1334 (r=0.9998), where 'Y,' 'x,' and 'r' are the optical density, AMD concentration, and correlation coefficient, correspondingly (fig. 8).
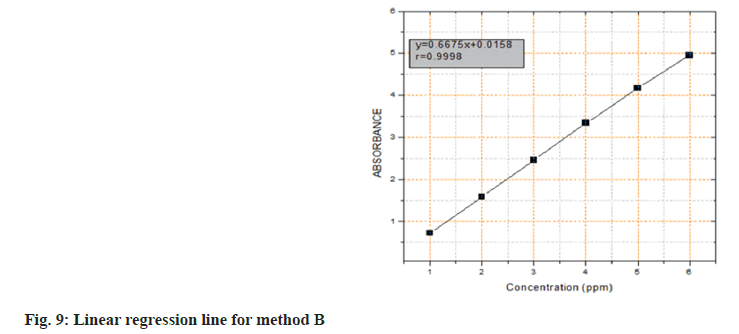
Calibration graph for the determination of AMD using the intended assay was generated by plotting the optical density as a function of the respective AMD concentration under the aforementioned optimal reaction conditions. The least-squares approach was used to construct regression equation for the results. Beer's law plot was found to be linear in the conc. 1.0-6.0 μg.ml-1 range. The straight line equation was Y=0.6675x+0.0158 (r=0.99987), with 'Y', 'x', and 'r' representing optical density, AMD concentration and correlation coefficient, respectively (fig. 9).
According to ICH guidelines[25-27], the Limits of Detection (LOD) and Limits of Quantification (LOQ) were calculated as follows; LOD=3.3 S/b and LOQ=10 S/b, 'S' is the standard deviation of blank absorbance values (n=6) and b is the slope of the calibration line. The LOD and LOQ values were determined, 0.7660 and 2.553 μg.ml-1, respectively for method A and 0.0140, 0.0470 μg.ml-1, respectively for method B. The suggested assay's quantitative parameters are presented in (Table 3). The data in the table suggest that the LOD and LOQ’s of the method are very low and the method B has lower values as compared to method A which indicates that the method B has better sensitivity than the method A.
| Parameters | Method A | Method B |
|---|---|---|
| λmax (nm) | 476 | 508 |
| Linearity range (µg ml-1) | 5.0-30.0 | 1.0-6.0 |
| Apparent molar absorptivity (L Mol-1 cm-1) |
0.331x10⁴ | 0.204 x 10⁴ |
| Sandell’s sensitivity (ng cm-2 0.001 abs units) |
6.9592 | 11.2500 |
| Linear regression | Y=0.015x+0.1334 | Y= 0.6675x+0.0158 |
| Slope (b) | 0.015 | 0.6675 |
| Intercept (a) | 0.1334 | 0.0158 |
| Correlation coefficient (r) | 0.99980 | 0.99987 |
| % RSD | 0.160 | 0.118 |
| % Range of errors: | ||
| a) 0.05 level | 0.4487±0.686x10⁻³ | 0.2472±0.372x10⁻³ |
| b) 0.01 level | 0.4487±0.0121x10⁻³ | 0.2472±0.653x10⁻³ |
| LOD (µg ml-1) | 0.7660 | 0.0140 |
| LOQ (µg ml-1) | 2.553 | 0.0470 |
Table 3: Parameters of Analytical Interest for the Methods A and B
Recovery experiments for reference solution at various conc. proved their accuracy and precision. For (method A), an (intra-day) precision at three distinct concentrations (15, 17.5, and 20 g.ml-1) was determined for five replicates of the AMD in pure form, as shown in (Table 4). The standard analytical errors, percentage Relative Standard Deviations (% RSD), and recoveries achieved in the suggested method's intra-day investigation were judged to be satisfactory. As a result, the suggested approach is successful in determining AMD.
| Observed concentration of AMD (μg ml-1) | ||||
|---|---|---|---|---|
| Concentration of AMD (μg ml-1) |
Intra-day | |||
| Average* | Error (%) | RSD (%) | Recovery (%) | |
| 15 | 15.24 | 15.2±0.0032 | 0.87 | 101.16 |
| 17.5 | 17.64 | 17.6±0.0034 | 1.09 | 100.8 |
| 20 | 19.84 | 19.8±0.0038 | 0.87 | 99.2 |
Note: *For five determinations
Table 4: Assessment of the Suggested Technique's Accuracy and Precision (Method A) By Intra-Day Test Observed Conc.of Amd (G Ml-1)
The suggested method's (Method A) accuracy was further tested by completing recovery tests on the pre-analyzed dose forms, which were then calculated using the recommended process (Table 5). Average recoveries were determined to be 99.4 %-100.4 %, with % RSD ranging from 0.084 %-0.231 %. According to the validation requirements for analytical procedures, this range is acceptable. This shows that the approach is repeatable. Using the conventional addition procedure, no influence from typical tablet excipients was found. A known quantity of pure AMD was added for this reason.
| Quantity of drug before addition (μg) | Amount of drug added (μg) | Theoretical amount (μg) | Average amount recovered (μg) | Mean % of recovery (n=5) | % RSD |
|---|---|---|---|---|---|
| 4 | 4 | 8 | 7.96 | 99.7 | 0.23 |
| 8 | 4 | 12 | 12.1 | 100.4 | 0.15 |
| 10 | 4 | 14 | 13.9 | 99.4 | 0.08 |
Table 5: Estimation of Amd in Tablet Formulation by Standard Addition Technique (Method A)
For method B, five replicate determinations of AMD in pure form at three distinct concentrations (1.5, 2.5, and 5.0 g.ml-1) using short term (intra-day) precisions, as demonstrated in (Table 6). The standard analytical errors, relative standard deviations (percent RSD), and recoveries achieved in the suggested method's intra-day analysis were judged to be satisfactory. As a result, the suggested approach is successful in determining AMD.
| Observed Concentration of AMD (μg ml-1) | ||||
|---|---|---|---|---|
| Concentration of AMD (μg ml-1) |
Intra-day | |||
| Average* | Error (%) | RSD (%) | Recovery (%) | |
| 1.5 | 1.514 | 1.514±0.0032 | 0.87 | 101 |
| 2.5 | 2.502 | 2.502±0.0034 | 1.09 | 100.1 |
| 5.0 | 4.985 | 4.985±0.0038 | 0.87 | 99.7 |
Note: *For five determinations
Table 6: Evaluation of Intra-Day Test for the Suggested Technique's Accuracy and Precision (Method B) by Observed Conc. of Amd (G Ml-1)
The proposed method's (Method B) accuracy was further tested by completing recovery tests using the usual addition procedure. A determinate amount of pure AMD was added to the pre-analyzed dosage forms for this purpose, and the results were determined using the prescribed approach (Table 7). The average recoveries were determined to be 98.9101.3 %, with % RSD ranging from 0.11 %-0.14 %. According to the validation requirements for analytical procedures, this range is acceptable. This shows that the approach is repeatable. The usual tablet excipients did not cause any interference.
| Amount of drug before addition (μg) | Amount of drug added (μg) | Expected Amount (μg) | The mean Amount recovered (μg) | Avg. % of Recovery (n=5) | RSD% |
|---|---|---|---|---|---|
| 2 | 2 | 4 | 3.96 | 99.0 | 0.23 |
| 2 | 3 | 5 | 5.01 | 100.2 | 0.15 |
| 2 | 4 | 6 | 5.95 | 99.17 | 0.08 |
Table 7: Estimation of Amd in Pharmaceutical Dosage Form by Standard Addition Technique (Method B)
The analytical performance of each technique was investigated by assessing the impact of tiny variations in each method variable on its robustness. In these trials, one parameter was tweaked while the others remained the same, and the recovery percentages were calculated every time. Small adjustments in the technique variables were shown to have no compelling effect on the operations; recovery values ranged from 98.4 %-101.1 %. This demonstrated the dependability of the proposed approaches in frequent use for AMD analysis in quality control laboratories.
Further, ruggedness was examined by utilising the suggested approach of the AMD assay under similar working conditions, but with two separate instruments from two different laboratories and with varying elapsed time. Because the % RSD did not surpass 2 %, the results obtained from lab-to-lab and day-to-day changes were repeatable.
The suggested approach was used to analyse AMD in pharmaceutical dosage forms [Biduret®5 tablet formulations], findings were statistically compared with the reference methodolgy using student's t-values. According to the data compiled in, the estimated t-values were fewer than the tabulated values at the 95 % confidence level for five degrees of freedom (Table 8). This signifies that the suggested technique is as exact and accurate as the reference method[3,10].
| % Content±SDa | |||||||
|---|---|---|---|---|---|---|---|
| Method | Tablet | Claimed (mg) | Obtained (mg) | %Recovery | Reported method* | t-valueb | F-valueb |
| A | 4.97 | 99.4±0.0006 | 1.104 | 1.327 | |||
| B | Biduret®5 | 5 | 5.05 | 101±0.0010 | 95.35±0.455 | 1.102 | 3.835 |
Table 8: Recovery and Assay Studies of Amd in Tablet, Two Methods A And B
At the 95 % confidence level, no noteworthy differences were discovered in the calculated and theoretical values of both the suggested and reported assays using the t- and F-tests. This demonstrated that the planned and reported approaches provided comparable accuracy and precision in the analysis.The present study includes the design and validation of two straightforward, precise, reliable, and costeffective assay methods for assessing AMD in pure and formulated form utilizing charge transfer complex spectrophotometry[11]. The tests were carefully checked in line with the standards for analytical method validation, and the results were satisfactory. These methods have been tested on single drug formulation not in the combined drug formulations. Amongst the developed methods in the current study method B has shown good LOD and LOQ as compared to method A. The acceptable recovery values verified the usefulness of the suggested approaches for the quality control of AMD. The following benefits are associated with the tests reported herein.
The UV-visible spectrophotometer instrument, in contrast to the LC/MS and HPLC methods, is simple and affordable; then again, the superiority resides in simplicity and user friendliness. Furthermore, typical additives and excipients do not interfere with the procedure; Limiting the use of organic solvents in the charge transfer-based spectrophotometric measurement of AMD, hence decreasing analyst exposure to the hazardous effects of organic solvents; Easily adopted for the Quality Control facilities.
Acknowledgements:
The authors would like to thank the Principal of Guru Nanak First Grade College in Bidar for the lab facilities and encouragement.
Conflict of interests:
The authors declared no conflict of interests.
References
- Erk N, Onur F. Three new spectrophotometric methods for simultaneous determination of hydrochlorothiazide and amiloride hydrochloride in sugar-coated tablets. Anal Lett 1997;30(8):1503-15.
- Sabarwal N, Jain S, Agarwal DD. Spectrophotometric method for simultaneous determination of amiloride and hydrochlorothiazide in combined dosage form. J Adv Sci Res 2021;12(3):170-4.
- Lakshmi AV. Spectrophotometric method for estimation of amiloride in bulk and tablet dosage form. Drug Dev Ther 2015;6(2):62-5.
- Kartal M, Erk N. Simultaneous determination of hydrochlorothiazide and amiloride hydrochloride by ratio spectra derivative spectrophotometry and high-performance liquid chromatography. J Pharm Biomed Anal 1999;19(3-4):477-85.
[Crossref] [Google Scholar] [PubMed]
- Ferraro MCF, Castellano PM, Kaufman TS. Simultaneous determination of amiloride hydrochloride and hydrochlorothiazide in synthetic samples and pharmaceutical formulations by multivariate analysis of spectrophotometric data. J Pharm Biomed Anal 2002;30(4):1121-31.
[Crossref] [Google Scholar] [PubMed]
- Al-Saidi KH, Abdlaziz S, Semer S. Simultaneous determination of amiloride hydrochloride and hydrochlorothiazide in pharmaceuticals by derivative spectrophotometry. Al-Nahrai J Sci 2010;13(4):52-61.
- Toral MI, Pope S, Quintanilla S, Richter P. Simultaneous determination of amiloride and furosemide in pharmaceutical formulations by first digital derivative spectrophotometry. Int J Pharm 2002;249(1-2):117-26.
[Crossref] [Google Scholar] [PubMed]
- Siddappa K, Hanamshetty PC. Spectrophotometric quantitative determination of ambroxol hydrochloride in bulk and pharmaceutical dosage forms using PDAB reagent. Int J Pharm Sci Res 2014;5(10):4188-94.
- Lapa RA, Lima JL, Santos JL. Dual-stopped-flow spectrophotometric determination of amiloride hydrochloride in a multicommutated flow system. Anal Chim Acta 2000;407(1-2):225-31.
- Siddappa K, Hanamshetty P. Application of charge transfer reactions for the quantitative spectrophotometric determination of cyclophosphamide in pure and pharmaceutical formulation. Curr Pharm Anal 2015;11(2):131-8.
- Deepakumari HN, Revanasiddappa HD. Use of the charge transfer reactions for the spectrophotometric determination of risperidone in pure and in dosage forms. J Pharm 2013;792186.
[Crossref] [Google Scholar] [PubMed]
- Youssef RM, Maher HM, El-Kimary EI, Hassan EM, Barary MH. Validated stability-indicating methods for the simultaneous determination of amiloride hydrochloride, atenolol, and chlorthalidone using HPTLC and HPLC with photodiode array detector. J AOAC Int 2013;96(2):313-23.
[Crossref] [Google Scholar] [PubMed]
- Abdel-Hay MH, Ragab MA, Ahmed HM, Mohyeldin SM. The use of arrhenius kinetics to evaluate different hydrolytic stability of amiloride hydrochloride and cyclopenthiazide using chromatographic methods. Microchem J 2019;147:682-90.
- Solanki R, Nagori BP. RP-HPLC method for simultaneous estimation of frusemide and amiloride hydrochloride in tablet formulation. Indian J Pharm Sci 2010;72(3):384-7.
[Crossref] [Google Scholar] [PubMed]
- De Luca M, Ioele G, Grande F, Platikanov S, Tauler R, Ragno G. Photostability study of multicomponent drug formulations via MCR-ALS: The case of the hydrochlorothiazide-amiloride mixture. J Pharm Biomed Anal 2020;186:113332.
[Crossref] [Google Scholar] [PubMed]
- El-Gindy A, Emara S, Mostafa A. HPLC and chemometric-assisted spectrophotometric methods for simultaneous determination of atenolol, amiloride hydrochloride and chlorthalidone. Farmaco 2005;60(3):269-78.
[Crossref] [Google Scholar] [PubMed]
- Naguib IA, Abdelaleem EA, Abdallah FF, Emam AA. Development and validation of two chromatographic methods for simultaneous determination and quantification of amiloride hydrochloride, hydrochlorothiazide, and their related substances, in pure and tablet forms. J AOAC Int 2020;103(3):747-54.
[Crossref] [Google Scholar] [PubMed]
- Naguib IA, Abdelaleem EA, Zaazaa HE, Draz ME. Simultaneous determination of hydrochlorothiazide and benazepril hydrochloride or amiloride hydrochloride in presence of hydrochlorothiazide impurities: chlorothiazide and salamide by HPTLC method. J Chromatogr Sci 2015;53(1):183-88.
[Crossref] [Google Scholar] [PubMed]
- Marzouk HM, Ayish NS, El-Zeany BA, Fayed AS. Eco-friendly chromatographic platforms for simultaneous determination and impurity profiling of an antihypertensive ternary pharmaceutical mixture. Sustain Chem Pharm 2023;32:100978.
- Nafea HM, Turkey NS. The determination of amiloride via quenched continuous fluorescence of azo dye using low-pressure mercury lamp tube (uv-light) and multi solar cells at 2 90° as a detectors. Int J App Pharm 2020;211-18.
- Idris AM, Alnajjar AO. Native fluorescent detection with sequential injection chromatography for doping control analysis. Chem Cent J 2013;7(1):144.
[Crossref] [Google Scholar] [PubMed]
- Chen W, Xiong Y, Wang W, Wu T, Li L, Kang Q, et al. Assembly of a UV-LED induced fluorescence system for rapid determination of amiloride in pharmaceutical tablet and human serum. Talanta 2019;203:77-82.
[Crossref] [Google Scholar] [PubMed]
- Wedian F, Lataifeh A, Mohammed MS. Simultaneous spectrofluorometric analysis of tablets containing hydrochlorothiazide combined with timolol maleate or amiloride hydrochloride. Acta Pharm 2020;70(3):373-85.
[Crossref] [Google Scholar] [PubMed]
- Maguregui MI, Jimenez RM, Alonso RM. Simultaneous determination of the -blocker atenolol and several complementary antihypertensive agents in pharmaceutical formulations and urine by capillary zone electrophoresis. J Chromatogr Sci 1998;36(10):516-22.
[Crossref] [Google Scholar] [PubMed]
- Al Azzam KM, Saad B, Aboul-Enein HY. Simultaneous determination of atenolol, chlorthalidone and amiloride in pharmaceutical preparations by capillary zone electrophoresis with ultraviolet detection. Biomed Chromatogr 2010;24(9):977-81.
[Crossref] [Google Scholar] [PubMed]
- Khorshed AA, Khairy M, Banks CE. Electrochemical determination of antihypertensive drugs by employing costless and portable unmodified screen-printed electrodes. Talanta 2019;198:447-56.
[Crossref] [Google Scholar] [PubMed]
- Rawal RK. Chemometrics assisted quantitative estimation of synthetic and marketed formulations. Asian J Biomed Pharm Sci 2014;4(34):21-6.
- Singh J. International conference on harmonization of technical requirements for registration of pharmaceuticals for human use. J Pharmacol Pharmacother. 2015;6(3):185-7.
[Crossref] [Google Scholar] [PubMed]
- Prasad PB, Satyanaryana K, Krishnamohan G. Development and validation of a method for simultaneous determination of metformin and saxagliptin in a formulation by RP-HPLC. Am J Anal Chem 2015;6(11):841.
- United States Pharmacopeia, 23, NF 18. U. S. Pharmacopeial Convention, Rockville, MD, 1995.
- Siddappa K, Prashant CH. Spectrophotometric quantitative determination of bromhexine hydrochloride in bulk and pharmaceutical dosage form using PDEAB reagent. Chem Sci Trans 2016;5(3):611-18.
- Analytical Methods Committee. Recommendations for the definition, estimation and use of the detection limit. Analyst 1987;112(2):199-204.
