- *Corresponding Author:
- Aqsa Quazi
Department of Pharmaceutics, Y. B. Chavan College for Pharmacy, Aurangabad, Maharashtra 431003, India
E-mail: quaziaqsa@gmail.com
| Date of Received | 18 March 2023 |
| Date of Revision | 25 April 2024 |
| Date of Acceptance | 21 October 2024 |
| Indian J Pharm Sci 2024;86(5):1781-1790 |
This is an open access article distributed under the terms of the Creative Commons Attribution-NonCommercial-ShareAlike 3.0 License, which allows others to remix, tweak, and build upon the work non-commercially, as long as the author is credited and the new creations are licensed under the identical terms
Abstract
An enteric-coated tablet with modified geometry was prepared comprising of layers that absorb water and swell, plus a simplified highly water-soluble middle layer containing glibenclamide and excipients which draw water into the tablet core simultaneously. Glibenclamide has poorly water solubility and so has a problem of variable bioavailability and bioequivalence. This work investigated the rapid as well as controlled release of glibenclamide that too in a minimum amount of surrounding solvent. The middle layer of prepared tablets rapidly observes water when reaches the intestine, and the relatively rigid swollen matrix structure of the upper and lower layer facilitates consistent in vivo drug release in the intestinal tract. The drug releases out of the dosage form when it reaches the colon, where a shortage of surrounding media has been reported to be one of the key reasons for the malabsorption of drugs. The formulations were studied for water uptake, the minimum amount of solvent required for drug release and in vitro drug release. Animal studies were performed on the rabbit model, where after oral administration of formulation the blood glucose level dropped significantly. A minimal 30 ml of fluid was required to carry out the drug release, thereby suggesting formulation design plays a crucial role in the drug release. This formulation technology could be useful among patients where a lesser amount of intestinal fluid secretion is noted or when the patient consumes lesser fluid due to scarcity, traveling, kidney failure patients, etc.
Keywords
Multilayer tablet, modified drug release, super disintegrants, glibenclamide, intestinal release, swellable polymers, dosage form
Among the most common drug delivery system is tablet dosage form, though very popular among all ages but the drug release is highly dependent on the nearby surrounding fluid[1]. The low moisture environment and the presence of viscous contents in the colon limit the fluid access to the delivery system which leads to reduced drug release rate in the distal regions of the Gastrointestinal (GI) tract[2]. Therefore, it will be important to consider the colonic release from dosage forms requiring fluid. This could be crucial in some categories of patients where there is either a limited amount of water available such as in case of dehydration, or their fluid intake is restricted such as kidney failure patients.
Briefly, the selected antidiabetic drug glibenclamide is a weak acid and is virtually insoluble in water (4 mg/l at 27°). To achieve a constant drug release from these tablet dosage forms, we need a delivery system that requires a minimal amount of surrounding fluid. This could be achieved by formulation design comprising of some excipients which can readily solubilize with minimal fluid and thereby provide uniform drug release. Geometrically Long Absorption Regulated system (GLARs) has a similar sort of technology, which by enabling drug dissolution and dispersion allows consistent drug absorption even within the colon irrespective of the surrounding environment[2-7].
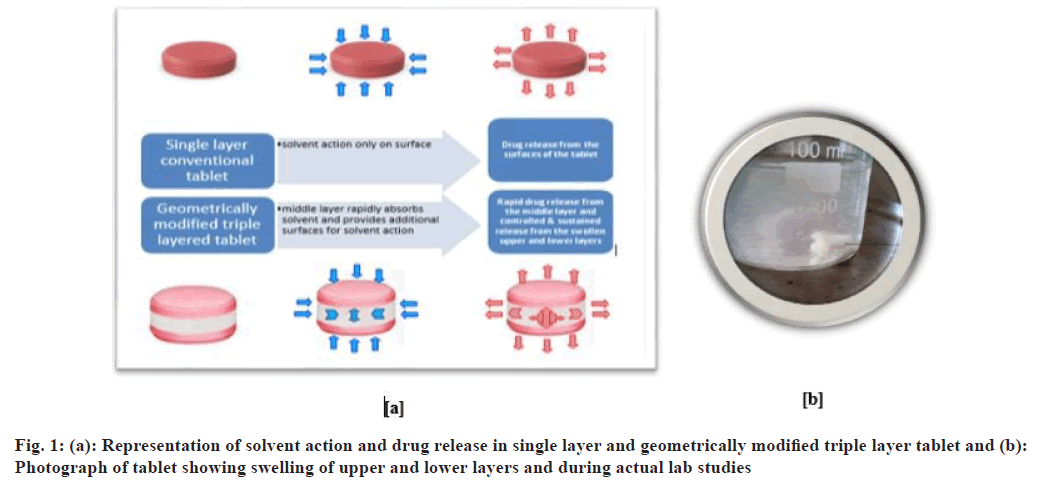
The middle layer induces rapid water absorption; this penetrated water also diffuses through the upper and lower layers, causing the tablet to swell. A consistent in vivo drug release is facilitated by the relatively rigid swollen matrix structure of the upper and lower layer of the tablet irrespective of the degree of GI motility[8].
By combining layers with different rates of swelling and erosion the rate of drug release can be regulated[9,10]. Moreover, layers could be formulated to give multi-modal, pulsatile, delayed, or extended- release, or to release two or more drugs at different rates. However, the mechanical properties of control layers are dependent on various factors that include drug solubility, drug-to-polymer ratio, polymer viscosity, particle size of drug, polymer, and the water-soluble excipient ratio.
Materials and Methods
Glibenclamide was obtained as a gift sample from USV Pharma Mumbai. Polyox WSR 303 was received as a gift sample from Wockhardt Ltd., Aurangabad. Microcrystalline Cellulose (MCC), magnesium stearate, PEG 400 and acetone were received from Research Lab Fine Chem Industries, Mumbai. Sodium chloride (NaCl), croscarmellose sodium (Ac-Di-Sol), Crospovidone and Eudragit® L 100 were received from Loba Chemie Pvt. Ltd., Mumbai.
Fourier-Transform Infrared (FTIR) spectroscopy:
FTIR spectroscopy was employed as an analytical tool to check the drug-excipients interaction, using the potassium bromide (KBr) disc method. Nearly a fine alkali halide (example KBr) powder of (200-250) mg 0.1 % to 1.0 % sample was mixed well. Later it was pulverized and it was placed in a pellet-forming die. Around an 8 tons force under a vacuum of several mmHg was applied to form transparent pellets. The FTIR spectra were scanned and recorded between 400 and 4000 cm-1.
Differential Scanning Calorimetry (DSC):
DSC thermograph of pure glibenclamide was recorded on Shimadzu thermal analyzer. About 7 mg of sample was placed in an aluminum cell with a reference pan heated at a rate of 10°/min over a hold temperature of 220°. An inert atmosphere was maintained with a purge of nitrogen gas with a flow of 100 ml/min.
Preparation of Triple Layer Tablet (TLT):
The upper layer and lower layer comprise ingredients as specified in Table 1, which were kept constant throughout the entire study. The middle layer was subjected to formulation optimization, which chiefly contains NaCl, Ac-Di-Sol and Crospovidone.
| S. No. | Ingredients | Quantity taken per tablet (mg) |
|---|---|---|
| 1 | Polyox WSR 303 | 84 |
| 2 | MCC | 50.4 |
| 3 | Magnesium stearate | 5.6 |
| 4 | Total weight | 140 |
Table 1: Composition of Upper and Lower Layer for TLT
Briefly, the blend for the barrier layers and the middle layer was prepared separately by mixing the weighed quantities of ingredients except magnesium stearate in a polybag. Mentioned quantity of magnesium stearate was mixed with both blends separately. An exact amount of each layer was loaded one by one (70 mg lower layer, 100 mg middle layer and 70 mg upper layer) into the die and compressed using plain surface punches of 10 mm diameter. The total weight of each tablet was 240 mg, which was further subjected to enteric coating by using Eudragit® L 100 polymer[11-13] (fig. 1).
Applying factorial design:
A 23 factorial design was applied for the preparation of the middle layer of the tablet (Table 2 and Table 3). The three dependent variables were considered at two levels, lower level (-1), and upper level (+1). The complete formulations for triple-layer tables are shown in Table 4.
| Variables | Levels | |
|---|---|---|
| Lower (-1) | Upper (+1) | |
| X1-Ac-Di-Sol | 5 mg | 10 mg |
| X2-Crospovidone | 5 mg | 10 mg |
| X3-NaCl | 5 mg | 10 mg |
Table 2: Variables and Levels of Factorial Design
| Formulation code | X1 | X2 | X3 |
|---|---|---|---|
| F1 | -1 | -1 | -1 |
| F2 | 1 | -1 | -1 |
| F3 | -1 | 1 | -1 |
| F4 | 1 | 1 | -1 |
| F5 | -1 | -1 | 1 |
| F6 | 1 | -1 | 1 |
| F7 | -1 | 1 | 1 |
| F8 | 1 | 1 | 1 |
Table 3: Batches for Factorial Design
| S. No. | Formulation ingredients | Quantity (mg) | |||||||
|---|---|---|---|---|---|---|---|---|---|
| F1 | F2 | F3 | F4 | F5 | F6 | F7 | F8 | ||
| 1 | Glibenclamide | 5 | 5 | 5 | 5 | 5 | 5 | 5 | 5 |
| 2 | MCC | 75 | 70 | 70 | 65 | 70 | 65 | 65 | 60 |
| 3 | NaCl | 5 | 10 | 5 | 10 | 5 | 10 | 5 | 10 |
| 4 | Ac-Di-Sol | 5 | 5 | 10 | 10 | 5 | 5 | 10 | 10 |
| 5 | Crospovidone | 5 | 5 | 5 | 5 | 10 | 10 | 10 | 10 |
| 6 | Magnesium stearate | 5 | 5 | 5 | 5 | 5 | 5 | 5 | 5 |
Table 4: Formulae Composition of Glibenclamide TLT
Water uptake studies:
The degree of water uptake was calculated by immersing the test tablets in 200 ml of dissolution medium (phosphate buffer, pH 7.4) at 37° and stirring with a magnetic bar operating at 100 rpm. The degree of water uptake can be calculated using the following equation
Water uptake (%)=W2-W1/W1×100
Where, W1 is the initial weight of the dry tablet and W2
is the weight of the hydrated tablet[9].
Minimum amount of solvent required for drug release:
The tablets were kept in different beakers containing different volumes of Fasted State Simulated Intestinal Fluid (FaSSIF). These beakers were subjected to magnetic stirring. The minimum amount of solvent on which the tablet breaks was noted.
In vitro drug release study in two different dissolution media:
The in vitro drug release was studied in phosphate buffer pH 7.4 and FaSSIF for all batches. Dissolution profiles of prepared glibenclamide tablets were determined using the paddle, United States Pharmacopeia (USP) type 2 dissolution apparatus at 75 rpm. The samples were analyzed at 300 nm using double beam Ultraviolet (UV)-visible spectrophotometer.
Kinetics analysis of drug release:
To analyze the mechanism of drug release from the triple layer tablet, the in vitro dissolution data were fitted to zero order, first order, Higuchi release model, Hixson and Crowell powder dissolution method and Korsmeyer and Peppas model by using PCPDisso version 2.08 software, and the model with the higher correlation coefficient was considered to be the best model.
Statistical analysis:
For the selected 23 full factorial design, 3 factors were evaluated at 2 levels. The proportion of NaCl, Ac-Di- Sol and crosspovidone were selected as independent variables and the dependent variables were in vitro drug release in phosphate buffer pH 7.4 and in vitro drug release in FaSSIF. The data obtained were treated using Stat-Ease Design-Expert 9 software and analyzed statistically using Analysis of Variance (ANOVA). The data were also subjected to three Dimensional (3D) response surface methodology.
Animal studies:
In order to determine the efficacy of the prepared TLT formulations, the blood glucose level was determined in a healthy rabbit. Briefly, 1-1.5 kg Swiss albino rabbit of either gender was selected and was administered 5 mm of punched tablet using an applicator. At periodic time intervals, blood samples were collected from the marginal ear vein and placed on test strips. Further subject to analysis using Accu-Chek Active glucometer. The test was continued until the blood glucose level was raised.
Results and Discussion
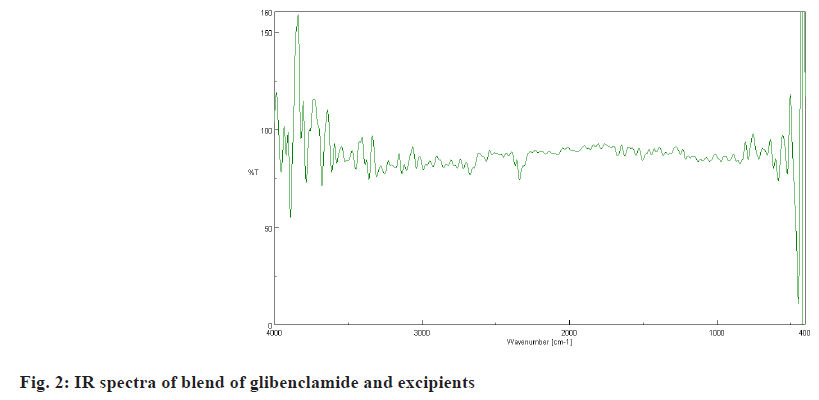
The peaks for drug and excipients are seen in the spectra of tablet blend (fig. 2). The FTIR spectrum showed drug characteristics peaks at 3500-3100 cm-1 (N-H stretching of primary secondary amine), 1680- 1630 cm-1 (C=O stretching of amide), 1350-1000 cm-1 (C-N stretching of amine), 1050 cm-1 (S=O stretching of sulphoxides), 785-540 cm-1 (C-Cl stretching of chloride). This indicates that no chemical interaction took place between the drug and the excipients.
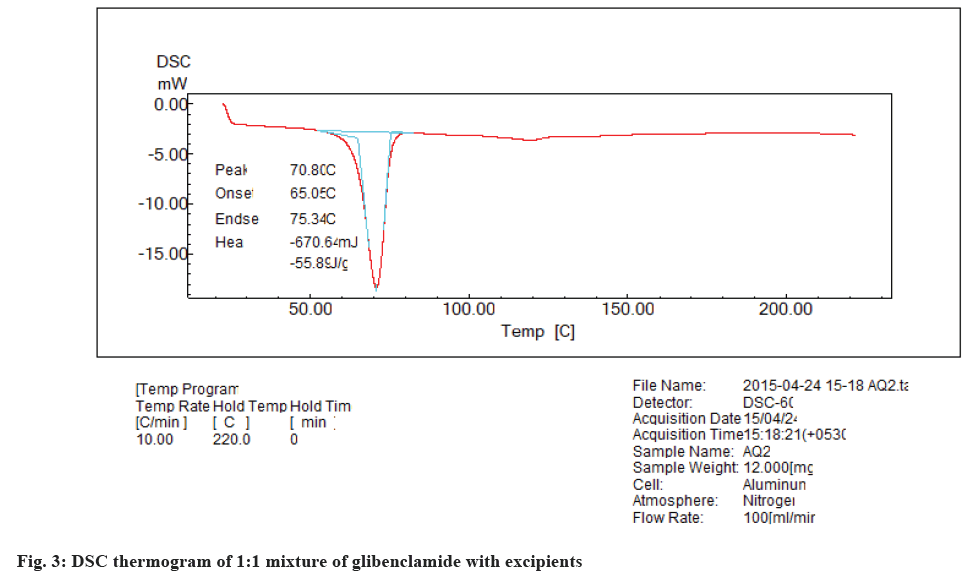
The DSC thermogram of glibenclamide shows the drug melting peak at 175.83°, there is a shift in this endotherm to 70.8° (fig. 3) when glibenclamide is in combination with MCC, NaCl, Ac-Di-Sol, crosspovidone, magnesium stearate, polyox WSR 303 (1:1). This shift in the endotherm may be due to the presence of the excipients which may result in the change in geometry (collegative).
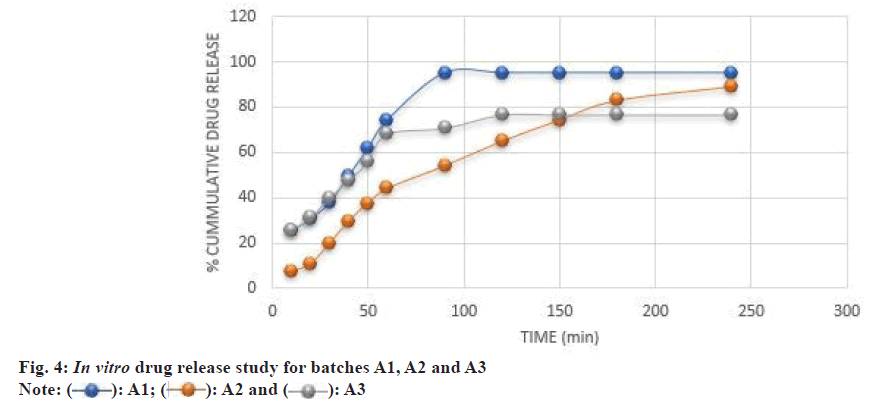
In the formulation trial batches of A1, A2 and A3, the amount for composition in the middle layer was 100 mg, and the upper and lower layer was decreased to 70 mg each. The in vitro drug release study for batches A1, A2 and A3 is shown in fig. 4.
NaCl tends to cause a rise in surrounding pH, which works in favor of the dissolution of glibenclamide, as glibenclamide is more soluble in alkaline pH than in acidic media. Ac-Di-Sol and Crospovidone tend to favor as they are highly water-attracting, in combination they provide water-wicking action and rapid swelling, which aids in rapid drug release from the formulation.
The formulation batch A1 breaks after 50 min and gets completely separated into two layers and maximum release was found in 90 min. The absence of super disintegrant in A2 formulation causes a slow release of the drug, thereby suggesting the role of super disintegrant required for rapid drug release. It took 4 h for A2 formulation to release the maximum amount of the drug. The A2 formulation breaks at 150 min but did not get separated, suggesting interactive binding between the upper and the lower layer. However, in the case of A3 formulation, the time required for drug release was less as compared to A2 formulation. But the amount of drug release also decreased in A3 as compared to A2. This could be due to the absence of NaCl. This tablet separated in two layers at 50th min, but due to the absence of NaCl, the dissolution of glibenclamide was not rapid. This suggests an alkaline media is required for glibenclamide dissolution.
The solvent rapidly enters the tablet from the sides of the middle layer. The drug release also takes place from the sides as well as from the barrier layer. After some time, the middle layer is completely dissolved and the tablet breaks into two parts. What remains are the barrier layers that dissolve after 8 h or can be eliminated as such. F4 formulation containing a high concentration of NaCl and a low concentration of MCC resulted in 94.11 %±0.05 % drug release in 150 min, while F1 formulation containing a low concentration of NaCl (4 mg) and a high concentration of MCC (75 mg) showed 85.7 %±0.16 % drug release after 180 min (fig. 5). This suggests that NaCl 10 mg plays a crucial role in rapid drug release.
F8 formulation showed 98 %±0.24 % in 90 min, which could be again due to high concentrations of NaCl (10 mg), Ac-Di-Sol (10 mg) and Crospovidone (10 mg) and a low concentration of MCC (60 mg). In this formulation, highest activity of all the three variables viz., creating alkaline pH and channels, water wicking and swelling can be the reason for fastest disintegration and dissolution, and highest drug release.
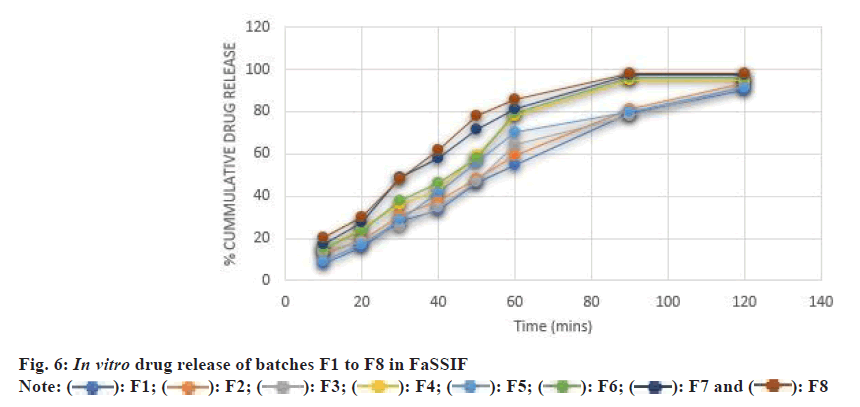
In order to better correlate with in vivo studies, drug release studies were also performed in simulated intestinal fluid. The drug release was found to be more in FaSSIF than that in phosphate buffer pH 7.4 (fig. 6). The Li et al.[11] 2015 cryogenic electron microscopic studies reveal the hydrated surface formulation in simulated GI fluid was particulate and porous, which tends to induce crack formation or lamination in tablets, leading to the burst release of drug in the GI tract. Our finding also showed a similar correlation to the Li et al.[11].
When all the selected variables were kept at a lower level i.e., 5 mg. The maximum drug release of 85.7±0.16 was found after 3 h in phosphate buffer and 90.53±0.02 after 2 h in FaSSIF. When 10 mg of Ac-Di- Sol was taken while NaCl and crosspovidone were kept at a lower level, the tablet showed higher drug release in the initial stages as compared to F1 which may be due to a higher level of Ac-Di-Sol. The maximum drug release was found to be 81±0.05 at 180 min in PBS and 93.6±0.61 in FaSSIF. When 10 mg of Crospovidone was taken while the other two variables were kept at a lower level, the F1 and F3 formulation showed a higher rate and amount of drug release. Two variables (NaCl and Ac-Di-Sol) were at upper level while 5 mg of Crospovidone was taken. The rate and extent of drug release were increased as compared to F1, F2 and F3. The 10 mg of Crospovidone was taken while the other two variables were kept at a lower level. The maximum drug release was found to be greater than the drug release of F1 while less than F3 and F4.
5 mg of Ac-Di-Sol was taken and 10 mg of NaCl and Crospovidone. The rate and extent of drug release are greater than F1, F2, F3 and F5. Here NaCl is 5 mg while the other two variables were 10 mg. The drug release was better than all the above-mentioned batches i.e., F1-F6. The maximum drug release takes place in 90 min. Ac-Di-Sol and crosspovidone when taken in a 1:1 ratio are more effective. In this batch, all the variables are at the upper level. 98 % drug release was obtained within 90 min making F8 the optimized batch.
The water uptake studies were carried out and the results found are reported in Table 5. It was found that the batches containing more amounts of super disintegrants showed more water uptake. The results so obtained correlate with the in vitro drug release in pH 7.4 and simulated intestinal fluid media studies. The prime objective of the formulation is to prepare formulation, which required lesser of surrounding fluid for drug release. So, to evaluate the amount of solvent required it was subjected to further studies, where the minimum amount of solvent required to break the tablet of each batch was recorded. The results are reported in Table 6.
| Batch | Percent water uptake |
|---|---|
| F1 | 200 |
| F2 | 233 |
| F3 | 250 |
| F4 | 248 |
| F5 | 240 |
| F6 | 240 |
| F7 | 280 |
| F8 | 280 |
Table 5: Water Uptake Studies
| Batch | Minimum amount of solvent required |
|---|---|
| F1 | 35 |
| F2 | 35 |
| F3 | 40 |
| F4 | 40 |
| F5 | 40 |
| F6 | 40 |
| F7 | 30 |
| F8 | 30 |
Table 6: Minimum Amount of Solvent Required
With the results obtained, it can be concluded that 30 ml is the minimum volume of fluid required for drug release. ANOVA indicated that the developed models were significant for considered response (Table 7).
| Source | Sum of squares | Df | Mean Square | F value | p-value probability value>F |
|---|---|---|---|---|---|
| Model | 185.14 | 3 | 61.71 | 6.61 | 0.0498 |
| NaCl | 10.37 | 1 | 10.37 | 1.11 | 0.3513 |
| Ac-Di-Sol | 87.85 | 1 | 87.85 | 9.41 | 0.0374 |
| Crosspovidone | 86.92 | 1 | 86.92 | 9.31 | 0.038 |
| Residual | 37.34 | 4 | 9.33 | ||
| Corrected Total | 55.46 | 7 |
Table 7: ANOVA for Drug Release in Phosphate Buffer pH 7.4
The model F-value of 6.61 implies the model is significant. There is only a 4.98 % chance that an F-value this large could occur due to noise. Values of probability value>F<0.0500 indicate model terms are significant. In this case, B and C are significant model terms. Values >0.1000 indicate the model terms are not significant.
The model F-value of 8.80 implies the model is significant. There is only a 3.10 % chance that an F-value this large could occur due to noise. Values of probability value>F<0.0500 indicate model terms are significant. In this case, A, B and C are significant model terms.
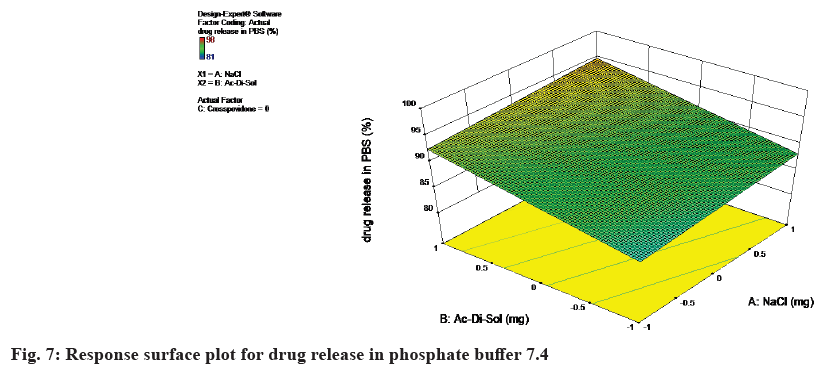
The response surface plot for drug release in phosphate buffer 7.4 was shown in fig. 7.
Final equation in terms of coded factors are
Drug release in PBS=+90.41+1.14×A+3.31×B+3.30×C
Drug release in PBS=90.40+1.4×Nacl+3.31×Ac-Di-Sol+3.29×crosspovidone
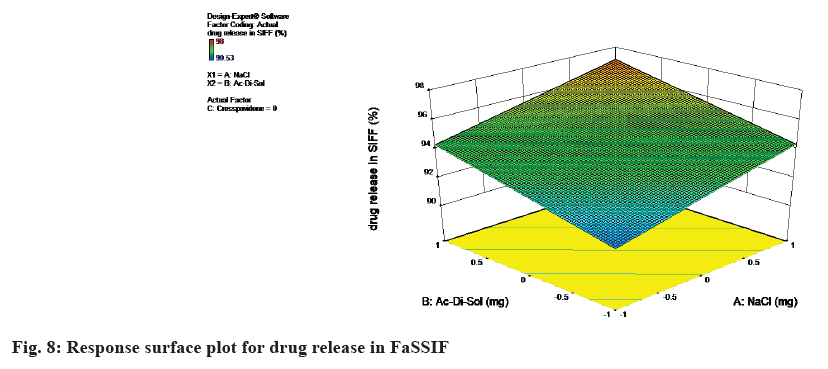
The equation in terms of actual factors can be used to make predictions about the response for given levels of each factor. From the equation it can be concluded as the concentration of NaCl, Ac-Di-Sol and Crospovidone increases, the response i.e., drug release in PBS also increases. The response surface plot for drug release in FaSSIF was shown in Table 8 and fig. 8.
| Source | Sum of squares | Df | Mean square | F value | p-value probability value>F |
|---|---|---|---|---|---|
| Model | 48.16 | 3 | 16.05 | 8.8 | 0.031 |
| A-NaCl | 15.57 | 1 | 15.57 | 8.53 | 0.0432 |
| Ac-Di-So | 15.07 | 1 | 15.07 | 8.26 | 0.0453 |
| Crosspovidone | 17.52 | 1 | 17.52 | 9.6 | 0.0363 |
| Residual | 7.3 | 4 | 1.82 | ||
| Corrected total | 55.46 | 7 |
Table 8: ANOVA for Drug Release in FASSIF
Drug release in SIFF=94.36+1.39×A+1.37×B+1.48×C
Drug release in SIFF=94.36+1.39×NaCl+1.37×Ac-Di-Sol+1.48×crosspovidone
From the equation it can be concluded as the concentration of NaCl, Ac-Di-Sol and Crospovidone increases, the response i.e., drug release in SIFF also increases.
The normal blood glucose level for the rabbit used for animal testing was found to be 160 µg/ml. The sampling of blood was started after 2.5 h of administration of the tablet, so that the drug reaches peak plasma concentration, and the sampling was done after each hour till the endpoint. The blood glucose level dropped significantly from 160 µg/ml to 120 µg/ml, indicating that the drug has been absorbed and thereby showing its pharmacological effect. The blood glucose level further reduced to 90 µg/ml and 60 µg/ml after 3.5 and 4.5 h respectively.
After another hour, the blood glucose level remained constant at 60 µg/ml. After this, the blood glucose level started rising indicating that the drug's effect was decreasing and the elimination phase has started. The half-life of the metabolites of glibenclamide is about 10 h and in this study, the normal blood glucose level was reached after 8.5 h. The endpoint was reached when the blood glucose level started rising after declining and reaching the normal value (Table 9).
| Time (h) | Blood glucose level (µg/ml) |
|---|---|
| 0 | 160 |
| 2.5 | 120 |
| 3.5 | 90 |
| 4.5 | 60 |
| 5.5 | 60 |
| 6.5 | 80 |
| 7.5 | 120 |
| 8.5 | 160 |
Table 9: Glucose Level with Respect to Time after Tablet Administration
A glibenclamide triple-layer tablet was formulated, which required minimum amount of surrounding fluid for drug release (30-40) ml. The physical mixture of drug and excipients was found to be compatible as indicated by FTIR and DSC studies. A 23 factorial design was applied and amongst all the formulations of factorial batches prepared (F1-F8), the F8 showed the best results in terms of water uptake, minimum amount of solvent required for drug release and in vitro drug release. The drug release was compared in phosphate buffer pH 7.4 and FaSSIF, it was found to be more in FaSSIF. Design expert software was used for ANOVA studies and response surface plots. The models for drug release were found to be significant. The animal study was performed in which after the oral administration of the formulation the blood glucose level dropped.
Ethical approval:
The Institutional Animal Ethics Committee (IAEC) approval number for animal studies in this research was CPCSEA/IAEC/Pharmaceutics-23/2014-2015/99.
Acknowledgments:
We would like to show our gratitude towards Dr. Syed Ayaz Ali for his help in animal studies. We also express our sincere thanks to late Mrs. Fatema Rafiq Zakaria.
Authors’ contributions:
Aqsa Quazi conceptualized, reviewed the literature, analyzed, investigated, collected and processed the data and prepared the original draft. Md. Ismail Mouzam visualized and supervised the research, reviewed and edited the manuscript.
Conflict of interest:
The authors declared no conflict of interests.
References
- Ubhe TS, Gedam P. A brief overview on tablet and its types. J Adv Pharmacol 2020;1(1):21-31.
- Wang H and Park J. A possible approach for the desire to innovate. Oral drug delivery: Formulation selection methods and novel delivery technologies. Frederick Furness Publishing: United Kingdom; 2011. p. 10-3.
- Choi DH, Kim KH, Park JS, Jeong SH, Park K. Evaluation of drug delivery profiles in geometric three-layered tablets with various mechanical properties, in vitro-in vivo drug release, and Raman imaging. J Control Release 2013;172(3):763-72.
[Crossref] [Google Scholar] [PubMed]
- Shin KH, Jeon JY, Jang K, Kim TE, Kim MG. Dose-proportional pharmacokinetic properties of GLA5PR GLARS-NF1 controlled-release pregabalin in healthy Korean volunteers: A randomized, open, single-dose, parallel study. Drug Design Dev Ther 2018;12:3449-57.
[Crossref] [Google Scholar] [PubMed]
- Lee MK, Jeon Y, Choi SS, Lee PB, Kim YC, Suh JH, et al. Efficacy and safety of the controlled-release pregabalin tablet (GLA5PR GLARS-NF1) and immediate-release pregabalin capsule for peripheral neuropathic pain: A multicenter, randomized, double-blind, parallel-group, active-controlled, phase III clinical trial. Clin Ther 2020;42(12):2266-79.
[Crossref] [Google Scholar] [PubMed]
- Kim KH, Lim SH, Shim CR, Park J, Song WH, Kwon MC, et al. Development of a novel controlled-release tablet of pregabalin: Formulation variation and pharmacokinetics in dogs and humans. Drug Des Dev Ther 2020;14:445-56.
[Crossref] [Google Scholar] [PubMed]
- Kim TE, Jeon JY, Gu N, Kwon MC, Kim MG. Comparative pharmacokinetics of a controlled-release pregabalin tablet (GLA5PR GLARS-NF1) and an immediate-release pregabalin capsule in healthy male volunteers. Clin Ther 2018;40(12):2112-24.
[Crossref] [Google Scholar] [PubMed]
- Hodges LA, Sime KA, Creech LA, Connolly SM, Barclay ST, Kwon MC, et al. Pharmacoscintigraphy confirms consistent tamsulosin release from a novel triple-layered tablet. Int J Pharm 2013;454(1):41-6.
[Crossref] [Google Scholar] [PubMed]
- Park JS, Shim JY, Park JS, Choi YW, Jeong SH. A novel three-layered tablet for extended release with various layer formulations and in vitro release profiles. Drug Dev Ind Pharm 2011;37(6):664-72.
[Crossref] [Google Scholar] [PubMed]
- Abdul S, Poddar SS. A flexible technology for modified release of drugs: Multi layered tablets. J Control Release 2004;97(3):393-405.
[Crossref] [Google Scholar] [PubMed]
- Li L, Li J, Si S, Wang L, Shi C, Sun Y, et al. Effect of formulation variables on in vitro release of a water-soluble drug from chitosan-sodium alginate matrix tablets. Asian J Pharm Sci 2015;10(4):314-21.
- Colombo P, Conte U, Gazzaniga A, Maggi L, Sangalli ME, Peppas NA, et al. Drug release modulation by physical restrictions of matrix swelling. Int J Pharm 1990;63(1):43-8.
- Joshi M. Role of eudragit in targeted drug delivery. Int J Curr Pharm Res 2013;5(2):58-62.
 A3
A3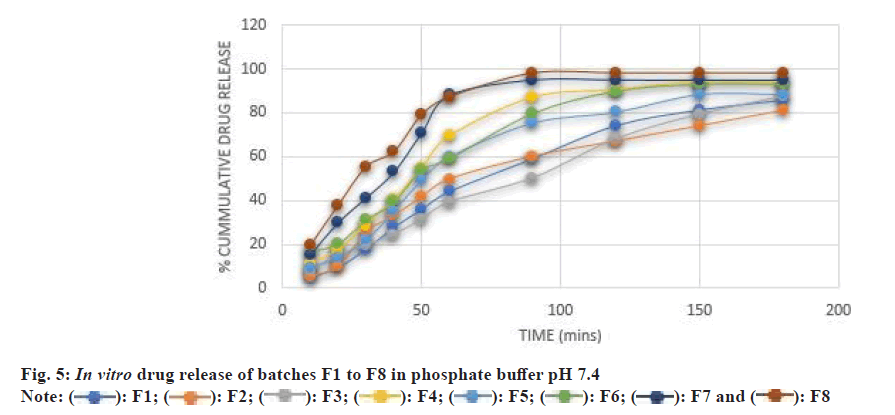
 F8
F8