- *Corresponding Author:
- Y Srinivasarao
Department of Pharmaceutical Analysis
Vignan Institute of Pharmaceutical Technology
Duvvada, Visakhapatnam 530046
Andhra Pradesh
E-mail: ysrvignan@gmail.com
| Date of Received | 25 September 2020 |
| Date of Revision | 10 February 2021 |
| Date of Acceptance | 18 March 2021 |
| Indian J Pharm Sci 2021;83(2):322-326 |
This is an open access article distributed under the terms of the Creative Commons Attribution-NonCommercial-ShareAlike 3.0 License, which allows others to remix, tweak, and build upon the work non-commercially, as long as the author is credited and the new creations are licensed under the identical terms
Abstract
Using first-order derivative techniques, a simple accurate and precise Ultraviolet spectrophotometric method was developed for the determination of solifenacin succinate and tamsulosin hydrochloride in combined dosage form. Every solifinacin succinate and tamsulosin hydrochloride was scanned in the wavelength region of 200-400 nm for determination of sampling wavelengths and selected sampling wavelengths were selected.
https://aermech.com https://world-oceans.org https://lline.net https://apecu.org https://febayder.com https://johnbirch.org
Sampling wavelengths were chosen at 265 nm (zero crossing of solifinacin succinate) where the absorbance of tamsulosin hydrochloride was important and at 250 nm (zero crossing of tamsulosin hydrochloride) where the absorbance of solifinacin succinate was significant. For solifenacin succinate, linearity ranged from 10 to 100 μg/ml with a correlation coefficient of 0.998 and 2 to 10 μg/ml for the correlation coefficient of tamsulosin hydrochloride is 0.9988. The median recovery was considered to be satisfactory. For the routine study of solifenacin succinate and tamsulosin hydrochloride in combined dosage forms, the approach proposed can be applied.Keywords
Solifenacin succinate, tamsulosin hydrochloride, first order derivative spectroscopy
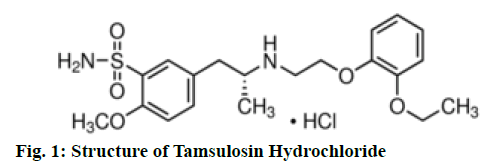
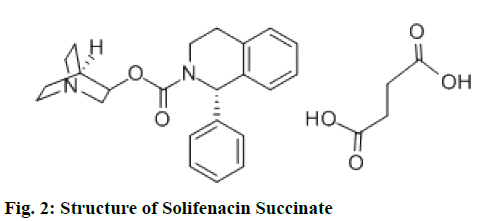
Chemically tamsulosin hydrochloride is 5-[(2R)- 2-{[2-(2-ethoxyphenoxy)ethyl] amino}propyl]-2- methoxybenzene-1-sulfonamide, fig. 1 and used as selective antagonist of α-1A-adrenergic receptors[1]. Chemically solifenacin succinate (SFS) is butanedioic acid (3R)-1-azabicyclo[2.2.2]octan-3-yl (1S)-1-phenyl- 1,2,3,4-tetrahydroisoquinoline-2-carboxylate, fig. 2 and used as competitive muscarinic acetylcholine receptor (M3) antagonist[2]. Solifenacin Succinate and tamsulosin hydrochloride is available with the brand name of “VESOMNI” in the form of modified-release tablets with the dosage strength 6 mg/0.4 mg. Therapeutic indication of this brand is to treat moderate to severe storage symptoms like urgency, increased micturition frequency and voiding symptoms associated with benign prostatic hyperplasia (BPH) in men who are not adequately responding to treatment with monotherapy[3]. Literature survey reveals spectrophotometric methods[4-8], High Performance Liquid Chromatography (HPLC)[9-11] and Liquid Chromatography-Electrospray Ionization-Mass Spectrometry (LC-ESI-MS/MS)[11-12] methods were available for tamsulosin hydrochloride and Ultraviolet[13-14], HPLC[15-16], Ultra-Performance Liquid Chromatography (UPLC)[17], high-performance thin layer chromatography (HPTLC)[18] and Liquid Chromatography with tandem mass spectrometry (LC-MS/MS)[19-20] methods were available for estimation of solifinacin succinate. Only few reverse phase high performance liquid chromatography (RP-HPLC)[21-22] method and spectrofluorimetric[23] methods were reported for the estimation of solifinacin succinate & tamsulosin hydrochloride in combination dosage forms. However no UV spectrophotometric method is reported yet for the estimation of solifinacin succinate & tamsulosin hydrochloride in combination dosage forms. However chromatographic methods are complex with costly instrument set up, skilled operators and expensive solvents limit the application of simultaneous quantification of above drugs. The derivative spectrophotometric[24-25] method have the advantage of separation of unresolved signals, reduction of spectral background interferences and quantification of one component in presence of other. The present work described first order derivative spectrophotometric method for the estimation of solifinacin succinate and tamsulosin hydrochloride in tablet formulation.
Materials and Methods
A double beam UV-visible spectrophotometer (LABINDIA) having two matched quartz cells with 1 cm light path and loaded with Microwave software (version 2.4.1) was used for recording of spectra and measuring absorbance. An electronic analytical weighing balance(APEX Ind Ltd) was used for all weighings and a Ultrasonicator (IBACO Services) used for sonication of all analytical solutions. Pure samples of solifenacin succinate , tamsulosin hydrochloride were obtained as gifted samples from pharma industry. Tablet formulation VESOMNI containing 6 mg solifenacin succinate and 0.4 mg tamsulosin hydrochloride was purchased from the local market and a Whatman filter paper no. 41 (Whatman International Ltd., England) was used. Double distilled water was used for all studies.
Preparation of Standard stock Solutions (100 μg/ml)
A standard stock solution (1 mg/ml) each of solifenacin succinate and tamsulosin hydrochloride were separately prepared in double distilled water and these stock solutions were further diluted with double distilled water to get a concentration of 100 μg/ml. These solutions were used as working standard solutions for further analysis.
Preparation of Sample Solution
Twenty tablets were weighed and powdered. The quantity of the powder equivalent to 60 mg of solifenacin succinate was transferred to 100 ml volumetric flask. The content was mixed with distilled water (70 ml) and sonicated for 20 min to dissolve the drug as completely as possible. The solution was then filtered through a Whatman filter paper no. 41 and volume was adjusted up to the mark with distilled water. An aliquot of 1 ml was transferred to a 10 ml volumetric flask and the volume was adjusted up to the mark with distilled water to obtain required concentration of solifenacin succinate (60 μg/ml) and tamsulosin hydrochloride (4 μg/ml). These solutions were analysed by first order derivative spectroscopic method and aborbances were noted at 250 nm and 265 nm.
Results and Discussion
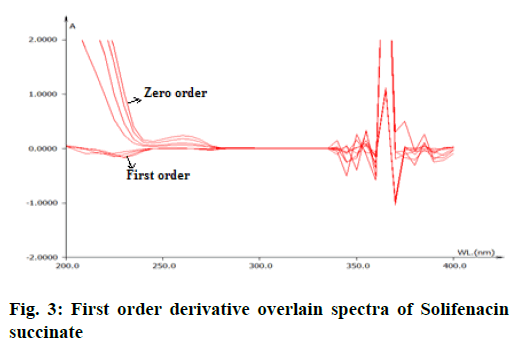
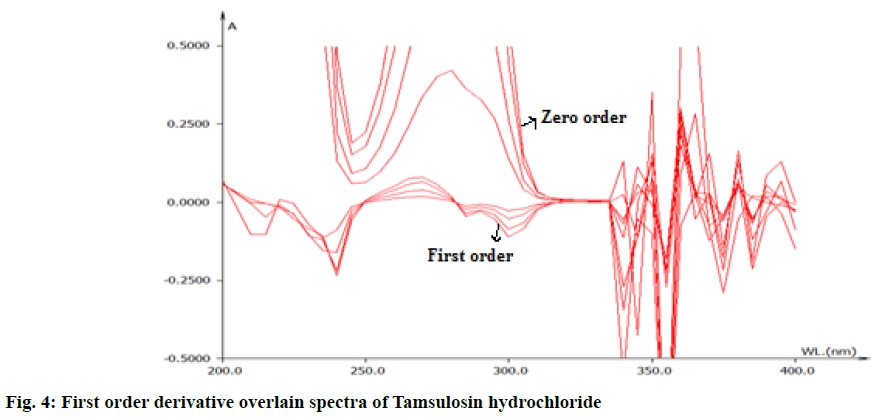
From the appropriate dilution of working standard stock solution 10 μg/ml of solifenacin succinate and 10 μg/ml of tamsulosin hydrochloride were separately prepared and scanned in UV range of 200-400 nm. The zero order spectra were obatained and converted to first order derivation spectra in the instrument derivative mode. From the first order derivative spectra of standard , solifenacin succinate and tamsulosin hydrochloride, zero crossing point of solifinacin succinate was found at 265 nm as shown in fig. 3 and zero crossing point of tamsulosin hydrochloride was found at 250 nm as shown in fig. 4 and wavelength selected for their estimation was 250 nm for solifenacin succinatte and 265 nm for Tamsulosin hydrochloride.
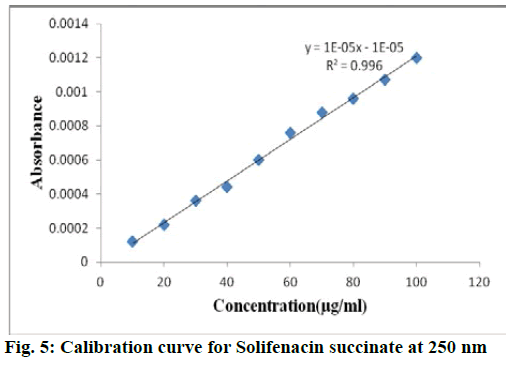
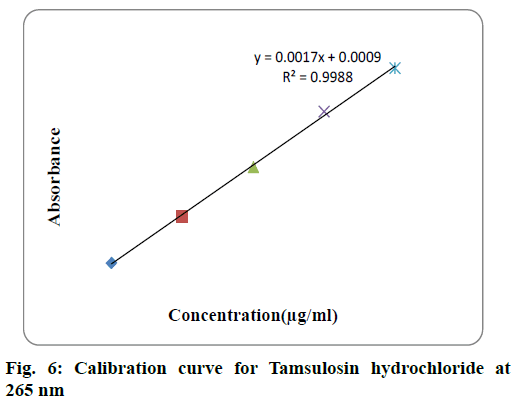
For each drug linearity was observed by diluting appropriate aliquots of working standard solution into a series of 10 ml volumetric flask with double distilled water to get a concentration range of 10-100 μg/ml for both solifenacin succinate and 2-10 μg/ml for tamsulosin hydrochloride. The samples were scanned in 200-400 nm range and first order derivative spectra was obtained. The dA/dλ of each of the solution measured at selected wavelength and plotted against concentration to obtain calibration curve. The calibraion curve of solifenacin succinate and tamsulosin hydrochloride were shown in fig. 5 and fig. 6 respecively. The statistical parameters of the calibration curve for both drugs was shown in Table 1.
| Parameter | Solifenacin succinate | Tamsulosin hydrochloride |
|---|---|---|
| Analytical wavelength | 250 nm | 265 nm |
| Beer’s law limit | 10-100 µg/ml | 2-10 µg/ml |
| Regression line equation Y = mx + c |
y=0.00003x -0.000001 |
y=0.0017x+0.0009 |
| Correlation coefficient | R2 = 0.996 | R2 = 0.9988 |
| LOD(µg/ml) | 1.054 | 0.101 |
| LOQ(µg/ml) | 3.196 | 0.308 |
Table 1: Optical Characteristics and Regression Analysis Data
The precision was measured in terms of method precision and intermediate precision. The precision of the method was checked by repeated measurement of absorbances of solutions of solifenacin succinate (60 μg/ml) at 250 nm and tamsulosin hydrochloride (4 μg/ml) at 265 nm by proposed method without changing any parameter. The results were reported in terms of percentage Relative standard deviation (RSD). The intraday and interday precision of the proposed method was determined by analyzing the corresponding responses 3 times on the same day and on 3 different days for different concentrations of standard solutions of solifenacin succinate (40, 60, 80 μg/ml) and tamsulosin hydrochloride (2 ,4, 6 μg/ml). The results were reported in terms of percentage RSD. The percentage RSD values for Solifenacin succinate and Tamsulosin hydrochloride were found to be 1.7 % and 1.07 % respectively. The low percentage RSD values (<2 %) indicates that proposed method is repeatable. The results of intraday and interday precision of solifenacin succinate and tamsulosin hydrochloride are shown in Table 2. The percentage RSD values of intraday precision for solifenacin succinate and tamsulosin hydrochloride were found to be 0.19 -0.87 and 1.09-1.47 % respectively and percentage RSD values of interday precision for solifenacin succinate and tamsulosin hydrochloride were found to be 0.27- 0.63 and 0.84-1.70 % respectively. The low percentage RSD values (<2 %) reveals that the proposed method is precise.
| DRUG | Concentration (µg/ml) |
Inter-day | Intra-day | ||
|---|---|---|---|---|---|
| Concentration estimated*(µg/ml±SD | % RSD | Concentration estimated* (µg/ml)±SD | % RSD | ||
| Solifenacin Succinate |
40 | 40.06±0.11 | 0.27 | 40.12±0.08 | 0.19 |
| 60 | 59.98±0.38 | 0.63 | 39.93±0.35 | 0.87 | |
| 80 | 79.97±0.29 | 0.36 | 79.92±0.56 | 0.70 | |
| Tamsulosin Hydrochloride |
2 | 2.05±0.03 | 1.7 | 1.98±0.02 | 1.01 |
| 4 | 4.06±0.06 | 1.47 | 3.94±0.05 | 1.29 | |
| 6 | 5.91±0.05 | 0.84 | 6.09±0.09 | 1.47 | |
*Average of three determinations
Table 2: Intraday and Interday Precision Data
The accuracy of the method was determined by calculating recovery of solifenacin succinate and tamsulosin hydrochloride by the standard addition method. Known amounts of standard solutions of solifenacin succinate (30, 60 and 90 μg/ml) and tamsulosin hydrochloride (2, 4, 6 μg/ml) were added to prequantified sample solutions of solifenacin succinate (60 μg/ml) and tamsulosin hydrochloride (4 μg/ml). The amount of solifenacin succinate and tamsulosin hydrochloride was determined by applying obtained values to the regression equation of the calibration curve. The accuracy was repeated for three times at each level. The recovery study was carried out for three times and percentage mean recovery was calculated and results are shown in Table 3. The value of standard deviation and percentage recovery studies were indicates that the proposed method is accurate.
| DRUG | Level | Amount of sample taken (µg/ml) | Amount of standard spiked (µg/ml) | Amount recovered* (µg/ml) | % Mean recovery* ± SD |
|---|---|---|---|---|---|
| Solifinacin Succinate | 50 % | 60 | 30 | 29.83 | 98.33 ± 1.791 |
| 100 % | 60 | 60 | 59.84 | 99.20 ± 0.613 | |
| 150 % | 60 | 90 | 89.92 | 99.75 ± 0.519 | |
| Tamsulosin Hydrochloride | 50 % | 4 | 2 | 1.98 | 98.93 ± 0.210 |
| 100 % | 4 | 4 | 3.965 | 98.58 ± 0.297 | |
| 150 % | 4 | 6 | 5.971 | 99.03 ± 0.154 |
* Mean of three determinations
Table 3: Recovery Data of Solifenacin Succinate and Tamsulosin
Limit of Detection (LOD) and the Limit of Quantification (LOQ) of the solifenacin succinate and tamsulosin hydrochloride were calculated using the following equations as per International Council for Harmonisation (ICH) guidelines. LOD=3.3×σ/S; LOQ=10×σ/S
Where, σ = The Standard deviation of y-intercepts of calibration curves. S = Average slope of calibration curve.
LOD values for solifenacin succinate and tamsulosin hydrochloride were found to be 1.054 and 0.101 μg/ml, respectively and LOQ values for solifenacin succinate and tamsulosin hydrochloride were found to be 3.196 and 0.308 μg/ml respectively. These data reveals that proposed method is sensitive for the determination of solifenacin succinate and tamsulosin hydrochloride.
The proposed validated method was successfully applied to determine concentration of solifenacin succinate and tamsulosin hydrochloride in their combined dosage form. The assay results obtained for solifenacin succinate and tamsulosin hydrochloride were comparable with the corresponding labeled amounts indicates that the method is suitable for simultaneous estimation of solifenacin succinate and tamsulosin hydrochloride without interference of excipients normally present in tablets.The results are shown in Table 4.
| Parameters | Drug | |
|---|---|---|
| Solifinacin Succinate |
Tamsulosin HCl |
|
| Label Claim(mg/tablet) Drug Content* % ± SD %RSD |
6 99.89 ± 1.473 1.475 |
0.4 99.69 ± 1.912 1.918 |
* Average of six determinations
Table 4: Results of Commercial Formulation Analysis
The developed first order derivative spectrophotometric method was found to be simple in nature and produced more accurate results. Hence the method is effective for routine analysis of solifenacin succinate and tamsulosin hydrochloride in combined dosage form.
Acknowledgements:
The authors are grateful to Dr.L.Rathaiah, Chairman of Lavu educational society for providing necessary facilities to carry out the above research work.
References
- Takenaka T, Fujikura T, Honda K, Asano M, Niigata K. Discovery and development of tamsulosin hydrochloride, a new alpha 1-adrenoceptor antagonist. J Pharma Soc Japan 1995;115(10):773-89.
- Ohtake A, Saitoh C, Yuyama H, Ukai M, Okutsu H, Noguchi Y, et al. Pharmacological characterization of a new antimuscarinic agent, solifenacin succinate, in comparison with other antimuscarinic agents. Biol Pharma Bull 2007;30(1):54-8.
- Dimitropoulos K, Gravas S. Solifenacin/tamsulosin fixed-dose combination therapy to treat lower urinary tract symptoms in patients with benign prostatic hyperplasia. Drug Des Devel Ther 2015;9:1707-16.
- Raghubabu K, Swarup Shanti L, Kalyanaramu B, Rao MN, Ramdas C. Simple and inexpensive methods development for the estimation of tamsulosin hydrochloride as a single component from its solid dosage forms by Visible spectrophotometry. Int J Pharm Biol Sci 2012;2:12-9.
- Radhika V, Kanaka Raju A, Vara Prasada Rao K, Srinivasa Rao Y, Deepthi, R. Validated and a sensitive UV spectrophotometric method for estimation of tamsulosin hydrochloride in bulk and commericial form. J Global Trends Pharm Sci 2020;11:8621-7.
- Thimmaraju MK, Rao V, Hemanth K, Siddartha K. Determination of tamsulosin in bulk and pharmaceutical dosage forms by UV spectrophotometric method. J Chem Pharm Res 2011;3:762-7.
- Rizka M, Toubara SS, Habibb HI, Mona S, Elshaheda. Stability indicating micelle-enhanced spectrofluorimetric method for determination of tamsulosin hydrochloride in dosage forms. J Adv Chem 2015;11:3513-31.
- Patel DB, Patel NU, Chaudhari BG. Validated spectrofluorimetric method for the determination of tamsulosin hydrochloride in tablet dosage form. Pelgia Res Library 2011;2:172-5.
- Kumari R, Dash PP, Lal VK, Mishra A, Murthy PN. RP-HPLC method for the estimation of Tamsulosin Hydrochloride in Tablet Dosage Form. Ind J Pharm Sci 2010;72:785-7.
- Zhang Z, Yang G, Liang G, Liu H, Chen Y. Chiral separation of tamsulosin isomers using HPLC using cellulose tris (3,5-dimethylphenylcarbamate) as a chiral stationary phase. J Pharm Biomed Anal 2004;34:689-93.
- Laha TK, Mishra S, Sen S. RP-HPLC Method for the Determination of Tamsulosin in Bulk and Pharmaceutical Dosage Forms. Asian J Chem 2011;23:11-4.
- Samba Siva Rao T, Tirumala R, Srinivas Rao P .Quantification of Tamsulosin in Human Plasma Using LC-MS/MS. J Bioanal Biomed 2011;3:55-8.
- Rakesh B, Bhargavi P, Reddy SR, Kumar AA. UV-Spectrophotometric method development and validation for the quantitative estimation of solifenacin succinate in tablets. Int J Pharm Pharm Sci 2014;6:190-3.
- Seshamamba BSV, Satyanarayana PVV, Sekaran CB. Development and validation of spectrophotometric methods for the quantification of solifenacin succinate application to tablet dosage forms. Int Let. Chem Phy Astr 2013;15:167-82.
- Bhavana V, Kumar Hemanth T, Rao Srinivasa Y, Rao Vara Prasada K. RP- HPLC method for estimation of solifenacin succinate in API and tablet dosage form. Asian Journal of Pharm Sci 2019; 9:118-22.
- Yanagihara T, Aoki T, Soeishi Y, Iwatsubo T, Kamimura H. Determination of solifenacin succinate, a novel muscarinic receptor antagonist, and its major metabolite in rat plasma by semi-micro high performance liquid chromatography. J Chromatogr B Analyt Technol Biomed Life Sci 2007;859(2):241-5.
- Krishna SR, Rao BM, Rao NS. A validated rapid stability-indicating method for the determination of related substances in solifenacin succinate by ultra-fast liquid chromatography. J Chromatogr Sci 2010;48(10):807-10.
- Desai DJ, Patel G, Ruikar D, Jain RA, Rajput SJ. Development and validation of stability-indicating HPTLC method of solifenacin succinate. Asian J Pharm Biol Res 2011;1:310-6.
- Puttagunta SB, Shaik RP, Bannoth CK, Challa BSR, Awen BZS. Bioanalytical method for quantification of solifenacin in rat plasma by LC-MS/MS and its application to pharmacokinetic study. J Anal Sci Technol 2014;5(1):35.
- Macek J, Ptáček P, Klíma J. Determination of solifenacin in human plasma by liquid chromatography-tandem mass spectrometry. J Chromatogr 2010;878(31):3327-30.
- Israel DS, Krishnachaitanya K, Sankar DG. RP-HPLC Method for the estimation of tamsulosin and solifenacin in bulk and its dosage forms. Int J Pharm Sci Res 2013;4:4343-50.
- Ganthi H, Park PR, Bapatu Y, Park S , Cho W.Stability Indicating HPLC Method for Quantification of Solifenacin Succinate & Tamsulosin Hydrochloride along with Its Impurities in Tablet Dosage Form. Am J Anal Chem 2016;7:840-62.
- Swathi N, Pani Kumar D, Sunitha G, Rajeshwari G. Quantification of Tamsulosin Hydrochloride and Solifenacin Succinate by Discriminative Derivative Synchronous Emission Spectroscopy. Turk J Pharm Sci 2018;15(2):149-55.
- Ojeda BC, Rojas FS. Recent developments in derivative ultraviolet/visible absorption spectrophotometry. Anal Chim Acta 2004;518:1-24.
- Karpiriska J.Derivative spectrophotometry-recent applications and directions of developments. Talanta 2004;64(4):801-22.
