- *Corresponding Author:
- S. Halde
Department of Pharmacology, School of Pharmacy and Technology Management, Narsee Monjee Institute of Management, and Higher Studies University, Mumbai-400 056, India
E-mail: supriyagujar@hotmail.com
| Date of Submission | 3 January 2011 |
| Date of Revision | 13 July 2011 |
| Date of Acceptance | 22 July 2011 |
| Indian J Pharm Sci, 2011, 73 (3): 416-421 |
Abstract
A selective and sensitive high performance liquid chromatography with UV detector (HPLC-UV) method was developed and validated from human plasma. Nevirapine and internal standard (IS) zidovudine were extracted from human plasma by liquid-liquid extraction process using methyl tert-butyl ether. The samples were analysed using Inertsil ODS 3, 250×4.6 mm, 5 μ column using a mobile phase consists of 50 mM sodium acetate buffer solution (pH-4.00±0.05): acetonitrile (73:27 v/v). The method was validated over a concentration range of 50.00 ng/ml to 3998.96 ng/ml. The method was successfully applied to bioequivalence study of 10 ml single dose nevirapine oral suspension 50 mg/5 ml in healthy male volunteers.
Keywords
High performance liquid chromatography with UV detector, nevirapine suspension, pharmacokinetics
Nevirapine is non-nucleoside reverse transcriptase inhibitor (NNRTI) with activity against Human Immunodeficiency Virus Type-1 (HIV-1). Nevirapine is structurally a member of the dipyridodiazepinone chemical class of compounds. The chemical name of nevirapine is 11-cyclopropyl-5,11-dihydro-4-methyl- 6H-dipyrido[3,2-b;2’,3’-e][1,4]diazepin-6-one [1]. Nevirapine does not appear to harm pregnant women in the first three months of pregnancy. It is also used to prevent transmission of HIV from a pregnant woman to her new child. Nevirapine costs less and works better where women breast-feed their babies. The mother gets one dose when she arrives at the hospital in labor. Then the newborn gets one dose during the first three days of life [2].
To carry out bioequivalence studies a bio-analytical method was developed and validated in human plasma. There are many methods reported in literature for analysis of nevirapine [3-8]. Some of the methods requires expensive techniques like solid phase extraction for the sample preparation [9], few methods requires liquid chromatography with mass spectrometer (LC-MS/MS) for the analysis [9,10] however in this method comparable sensitivity is obtained by using HPLC technique. Few reported methods for liquid-liquid extraction involves mixture of solvents [11] however in this method, good recovery and very clean samples were received by single solvent.
The aim of the present work was to develop an accurate and sensitive HPLC method with dynamic linearity range that can cover the plasma concentrations following single oral dose of nevirapine. Here we also described the optimization of the instrumental parameters as well as the extraction procedure from human plasma samples by liquidliquid extraction. The method had been validated by evaluating the precision, accuracy and other validation parameters for human plasma samples as mentioned in regulatory guidelines [12].
Materials and Methods
The HPLC system used was Shimadzu LC-2010HT with UV detector. Using ‘LC Solution software Version 1.21’ data processing and chromatographic integration was carried out. Reciprocating shaker used for liquid–liquid extraction was procured from Trishul Equipment. The nitrogen evaporator used to evaporate the samples was procured from Takahe Analytical Instruments. Hettich centrifuge machine was used for the sample preparation. Deep freezers used for storage of plasma samples were procured from Sanyo (Japan).
Nevirapine and zidovudine (IS) working standards were obtained from Macleods Pharmaceuticals Ltd, Mumbai, India. Water was deionized and further purified for HPLC with Milli-Q system, Millipore, USA, acetonitrile and glacial acetic acid used was of HPLC grade and supplied by Thomas Baker, India and methanol and methyl tert-butyl ether used was of HPLC grade and were supplied by J. T. Baker, USA, sodium acetate trihydrate GR Grade was supplied by Merck, India.
Fresh frozen plasma containing disodium EDTA as an anticoagulant was used during validation and study sample analysis was collected in-house in Macleods Pharmaceuticals Ltd, Mumbai India. Plasma was stored at −20° before sample preparation.
Standards and working solutions
An individual stock standard solution of nevirapine and internal standard containing 1000 μg/ml was prepared by dissolving working standards in methanol. Intermediate dilutions and IS spiking dilutions were prepared from respective stock solutions by dilution with 50% acetonitrile in water v/v. Calibration standards were prepared in the range of 50.00 ng/ ml to 3998.96 ng/ml of nevirapine using eight concentration levels. Quality control standards were of three different levels low (140.01 ng/ml), medium (2000.16 ng/ml) and high (3401.64 ng/ml) were also prepared.
Chromatographic conditions
The successful analysis of the analyte in biological fluids using HPLC method relies on the optimization of chromatographic conditions like sample preparation, chromatographic separation and post column detection etc. Thus for better selectivity and sensitivity different types of column make and mobile phase were used. Length of the column varied from 150 to 250 mm. Columns of different types of stationary phase like C8 and C18 showed interference at the retention time of analyte or internal standard or improper peak shape. Finally Inertsil ODS 3, 250×4.6, 5μ column was selected for analysis based on good peak shape, suitable retention time and selectivity in presence of endogenous matter from the plasma.
The influence of buffer molarity, pH and various organic solvents were also studied to optimize peak shape of drug and its response, also to remove interference from retention time of analyte and internal standard. Based on good peak shape, response and selectivity a mixture of 50 mM sodium acetate trihydrate pH 4 and acetonitrile in proportion of 73:27 was used as mobile phase with flow rate of 1 ml/min.
The total analysis time of a single injection was 15 min. injection volume was 50 μl wavelength selected for detection is 280 nm, Column oven temperature was kept at 25° and sample cooler temperature was kept at 4°. Rinsing solution was prepared by mixing water and acetonitrile in the volume ratio of 50:50.
Sample treatment
The sample clean up technique was also optimized in order to obtain insignificant interference from endogenous components of matrix. Different techniques like protein precipitation, liquid-liquid extraction and solid phase extraction were used for sample clean up. Liquid-liquid extraction technique without adding any buffer was found to be the best method for sample clean up. Extraction trials were carried out with ethyl acetate, hexane, dichloromethane and methyl tert-butyl ether. It was observed that with methyl tert-butyl ether the recovery of nevirapine and internal standard was maximum.
Five hundred microlitres of the samples were transferred to stoppered test tubes. Fifty microlitres of 35000 ng/ml of zidovudine solution was added to it as an IS except in blank sample wherein 50 μl of diluent was added, and vortexed. Five milliliters of methyl-tert-butyl ether was added in plasma samples, shaked well on shaker for 10 min at 100-rpm speed. Plasma samples were centrifuged for 5 min at 4°, 4000 rpm. Transferred 4.0 ml of upper organic layer in plain test tube and evaporated to dryness at 40° in nitrogen evaporator. The residue was then reconstituted with 250 μl of mobile phase. Processed samples were injected into the HPLC system for analysis.
Method validation
The method was validated in terms of linearity, specificity, Lower Limit of Quantitation (LLOQ), recovery, accuracy, precision, dilution integrity, heamolysis effect and stability studies such as short term room temperature stock solution stability, long term refrigerated stock solution stability, long term stability in plasma, freeze-thaw stability, bench top stability, dry extract stability and auto-sampler stability. The accuracy and precision determination were carried out with six replicates of three different concentrations low, medium and high quality control samples.
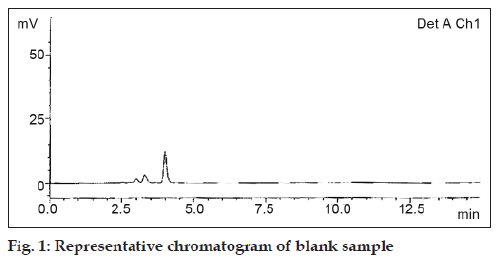
Specificity and selectivity was checked using ten different lots of plasma to ensure that no endogenous interference at the retention time of nevirapine and internal standard. Ten LLOQ level samples along with Plasma blanks (fig. 1) from respective plasma lots were prepared and analysed. In all ten plasma blanks, the response at the retention time of nevirapine was less than 20% of LLOQ response and at the retention time of IS, the response was less than 5% of the mean IS response in LLOQ.
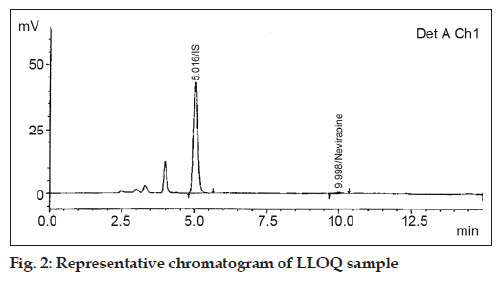
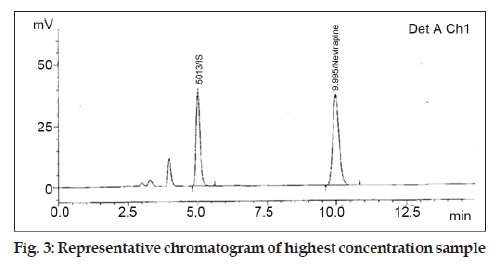
Sensitivity i.e. the lowest limit of reliable quantification was set at the concentration of the LLOQ 50.00 ng/ml from plasma (fig. 2). Linearity of calibration curve standards in the range 50.00 ng/ml to 3998.96 ng/ml (fig. 3) was assessed by subjecting the spiked concentrations and respective peak areas using 1/x as weighing factor.
The precision of the assay was measured as the percent coefficient of variation over the concentration range of LLOQ QC, LQC, MQC and HQC samples respectively during the course of validation. The accuracy of the assay was defined as the absolute value of the ratio of the calculated mean values of LLOQ QC, LQC, MQC and HQC samples to their respective nominal values, expressed in percentage. Six replicates of each QC level were analyzed together with a set of calibration standard. The obtained precision and accuracy (inter and intra-day) are presented in Table 1.
| QC levels | Mean accuracy (%) | Mean precision (%RSD) |
|---|---|---|
| Intra day (n=12) | ||
| LLOQ QC | 98.42 | 8.33 |
| LQC | 96.14 | 2.20 |
| MQC | 96.95 | 1.53 |
| HQC | 98.09 | 2.79 |
| Inter day (n=18) | ||
| LLOQ QC | 96.98 | 7.16 |
| LQC | 96.17 | 2.35 |
| MQC | 96.75 | 1.32 |
| HQC | 97.32 | 2.70 |
Table 1: Inter and intra-day accuracy and Precision of nevirapine
The recovery study was performed by comparing processed QC samples of three different concentrations with aqueous recovery comparison samples representing 100% extraction. To determine haemolysis effect ten haemolysed plasma blanks along with LLOQ samples and QC samples at three concentrations (LQC, MQC and HQC) were prepared. Six replicates of each QC sample were analyzed together with a set of calibration curve prepared in normal plasma.
Stability studies
The stability of nevirapine and internal standard was investigated in the stock and working solutions, in plasma during storage, during processing after three freeze-thaw cycles and in the final extract. The stability samples were compared with freshly prepared calibration curve and quality control samples. Analyte and internal standard were considered stable when the change of concentration was ±15% of nominal value. For long-term stability concentrations obtained are compared with the results of 1st day of analysis of bulk-spiked samples to check the stability of the samples stored in deep freezers (below −50°).
For freeze thaw stability retrieval of frozen samples was carried out after 24 h, 12 h and 12 h of freezing, respectively. Dry extract stability of nevirapine studied after extraction of samples only up to stage of evaporation to dryness and storing these samples in refrigerator without reconstitution for 24 h. It was carried out by quantifying six sets each of LQC and HQC against the freshly spiked calibration curve standards. For bench top stability QC samples spiked in biological matrix in six replicates at low and high concentration were kept on bench at room temperature. After 6 h samples were processed along with fresh calibration curve (which is not kept on bench) and analyzed. For autosampler stability QC samples at low and high concentrations were prepared in six replicates in biological matrix, processed and stored into autosampler. After autosampler stability period samples were analysed against freshly prepared calibration curve. Long-term stability was checked on 6 replicates of QC samples at low, medium and high concentration and stored below –50°. After 106 days the samples were processed and checked for the stability. Stock solutions stability was performed at room temperature and in a refrigerator. Stock solutions were stable at room temperature for 25 h and in refrigerator the stocks are found to be stable for 11 days.
Clinical protocol
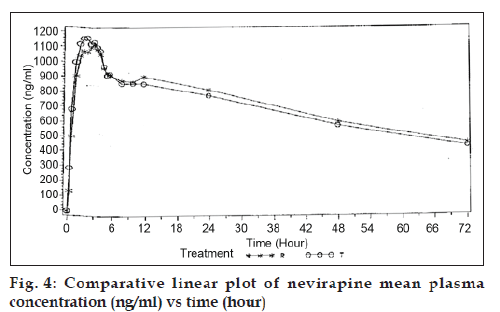
Validated method was further applied to carry out bioequivalence study. The independent ethics committee approved study protocol. An open label, balanced, analyst blind, randomized, two-treatment, one-period, single dose, parallel bioequivalence study was carried out on 12 healthy, adult, males under fasting conditions. Each subject was administered with single dose of 10 ml of nevirapine oral suspension (each 5 ml of suspension contains nevirapine hemihydrate equivalent to nevirapine 50 mg). Dosing was carried out after an overnight fasting of at least 10 h. Total of 20 time points were collected from each subject. Time points were as follows: Pre-Dose sample, 0.25, 0.50, 1.00, 1.50, 2.00, 2.50, 3.00, 3.50, 4.00, 4.50, 5.00, 5.50, 6.00, 8.00, 10.00, 12.00, 24.00, 48.00, and 72.00 h. Comparative linear plot of nevirapine mean plasma concentration (ng/ml) Vs time (h) was plotted (fig. 4).
Results and Discussion
Simple specific and sensitive method was developed on HPLC- UV. For good peak shape and resolution the column selected was Inertsil ODS 3, 250×4.6, 5μ column was selected. For proper retention time the mobile phase was optimized to 50 mM sodium acetate trihydrate pH 4 and acetonitrile in proportion of 73:27.
In specificity exercise blank samples showed no significant interference at retention time of nevirapine and internal standard indicating that the method was specific for nevirapine even in presence of endogenous matter from plasma. Linearity ranged from 50.00 ng/ml to 3998.96 ng/ml. Correlation coefficient (r2) was greater than 0.99. Accuracy of all calibration standards was within 85-115% except LLOQ where it was 80-120%.
The precision and accuracy at LLOQ was found to be 2.55% and 98.38% in sensitivity exercise. Accuracy and precision exercise result showed that the method is accurate as the accuracy is within acceptance limits of 100±20% of the theoretical value at LLOQ and LLOQ QC and 100±15% at all other concentration levels. The precision around the mean value was less than 15% C.V. at any of the concentration other than LLOQ and LLOQ QC for which it was within 20% C.V.
The recovery of low quality control (LQC) level was 76.56%, medium quality control (MQC) level was 78.29% and for high quality control (HQC) the level was 67.86%. The mean recovery of all the three QC’s levels was 74.24% with the precision 7.53% C.V. Recovery of internal standard was 68.43%.
In hemolysis effect none of the blank sample showed any significant interference at the retention time of analyte and internal standard. The average accuracy at LQC level was 96.03% at MQC level was 97.48% and HQC level was 96.72%. The %CV of LQC was 0.67% MQC was 1.36% and for HQC was 0.56%.
The observed accuracy after three freeze thaw cycles for nevirapine was 95.75% for LQC and 99.83% for HQC level. The percent accuracy for dry extract stability was found to be 99.92% for LQC and 100.57% for HQC. The observed bench top accuracy after 6 h for nevirapine was 94.06% for LQC and 97.82% for HQC levels. The autosampler stability observed after 103 h for nevirapine was 98.33% accuracy for LQC and 102.25% accuracy for HQC levels. The observed accuracy for long-term stability below -50° after 106 days for nevirapine was 104.7% for LQC, 105.09% for MQC and 98.89% for HQC levels. The stock solution stability of nevirapine at room temperature after 25 h was 99.98% and for internal standard 100.15%. The stocks were stable in the refrigerator for 11 days. The accuracy of nevirapine was 100.52% and for internal standard stock solution was 100.09%. All the results of method validation are summaries in Tables 1 and 2.
| Stability | Stability duration | QC level | Mean accuracy (%) | Mean precision (% CV) |
|---|---|---|---|---|
| Bench top | 6 h | LQC | 94.06 | 0.90 |
| HQC | 97.82 | 1.90 | ||
| Freeze thaw | 3 cycles | LQC | 95.75 | 1.79 |
| HQC | 99.83 | 4.06 | ||
| Dry extract | 24 h | LQC | 99.92 | 1.21 |
| HQC | 100.57 | 2.70 | ||
| Auto sampler | 103 h | LQC | 98.33 | 1.55 |
| HQC | 102.25 | 1.71 | ||
| Long term plasma stability | 106 days | LQC | 104.70 | 0.66 |
| MQC | 105.09 | 0.81 | ||
| HQC | 98.89 | 0.85 |
Table 2: Summary Of Stability Data
The above described fully validated method was applied to determine the concentration time profile following single dose administration of nevirapine to healthy volunteers. After HPLC analysis the plasma nevirapine concentration (ng/ml) found were subjected to statistical analysis. The Cmax for both test and reference products were 1262.95 ng/ml and 1205.26 ng/ml and AUC0-t for both test and reference products were 48961.25 ng/ml h and 48564.27 ng/ml h.
A simple sensitive, selective, precise and accurate HPLC method for the determination of nevirapine in human plasma was developed. Nevirapine was determined with economical liquid-liquid extraction technique from human plasma. This method was successfully applied to a bio-equivalence study of nevirapine suspension.
Acknowledgements
The authors thank Macleods Pharmaceuticals Ltd, Mumbai, for providing all the working standards, chemicals, Laboratory instruments and facility to carry out this work.
References
- Available from: http://www.rxlist.com/viramune-drug.htm [Last cited on 2010 Oct 25].
- Available from: http://www.aidsinfonet.org/fact_sheets/view/431 [Last cited on 2010 Oct 25].
- Pav JW, Rowland LS, Korpalski DJ. HPLC-UV method for the quantitation of nevirapine in biological matrices following solid phase extraction. J Pharm Biomed Anal 1999;20:91-8.
- Silverthorn CF, Parsons TL. A Validated method for Nevirapine Quantitation in Human Plasma via High-Performance Liquid Chomatography. Biomed Chromatogr 2006;20:23-7.
- van Heeswijk RP, Hoetelmans RM, Meenhorst PL, Mulder JW, Beijnen JH. Rapid determination of nevirapine in human plasma by ion-pair reversed-phase high performance liquid chromatography with ultraviolet detection, J Chromatogr B Biomed Sci Appl 1998;713:395-9.
- Hollanders RM, van Ewijk-BenekenKolmer EW, Burger DM, Wuis EW, Koopmans PP, Hekster YA. Determination of nevirapine, an HIV non nucleoside reverse transcriptase inhibitor, in human plasma by reversed-phase high performance liquid chromatography. J Chromatogr B Biomed SciApplAppl 2000;744:65-71.
- Kappelhoff BS, Rosing H, Huitema AD, Beijnen JH. Simple and rapid method for the simultaneous determination of the non-nucleoside reverse transcription inhibitors efavirenz and nevirapine in human plasma using liquid chromatography, J Chromatogr B AnalytTechnol Biomed Life Sci 2003;792:353-62.
- Weller DR, Brundage RC, Balfour HH Jr, Vezina HE. An isocratic liquid chromatography method for determining HIV non-nucleoside reverse transcriptase inhibitor and protease inhibitor concentrations in human plasma. J Chromatogr B AnalytTechnol Biomed Life Sci B 2007;848:369-73.
- Mistry NH, Shrivastav P, Jangid AG, Sanyal M. Development and validation of a rapid liquid chromatography tandem mass spectrometry method to quantify nevirapine in human plasma and its application to bioequivalence study in healthy human subjects. Anal Lett 2007;40:1147-65.
- Kavuri SR, Mukkamala SB, Putheti R. Quantitative determination of two bioactive compounds in Andrographispaniculata (Burm.f) Nees by ultra performance liquid chromatography. J Pharm Res 2010;3:1682-4.
- Dailly E, Thomas L, Kergueris MF, Jolliet P, Bourin M. High-performance liquid chromatographic assay to determine the plasma levels of HIV-protease inhibitors (amprenavir, indinavir, nelfinavir, ritonavir and saquinavir) and the non-nucleoside reverse transcriptase inhibitor (nevirapine) after liquid-liquid extraction. J Chromatogr B Biomed SciAppl 2001;758:129-35.
- Guidance for Industry, Bioanalytical Method Validation, Food and Drug Administration, Centre for Drug and Research CDER, 2001.


