- *Corresponding Author:
- Ji Mingyue
Department of Obstetrics, Cangzhou Hospital of Integrated TCM-WM, Cangzhou, Hebei Province 061899, China
E-mail: wan8261468@qq.com
| This article was originally published in a special issue, “Clinical Advancements in Life Sciences and Pharmaceutical Research” |
| Indian J Pharm Sci 2024:86(5) Spl Issue “27-33” |
This is an open access article distributed under the terms of the Creative Commons Attribution-NonCommercial-ShareAlike 3.0 License, which allows others to remix, tweak, and build upon the work non-commercially, as long as the author is credited and the new creations are licensed under the identical terms
Abstract
To determine whether genes associated with the tumor microenvironment can serve as markers for diagnosing and monitoring ovarian cancer progression was analyzed, using the clinical data of 169 ovarian cancer individuals from the cancer genome atlas database. We conducted univariate Cox regression analysis using 760 tumor microenvironment-related gene expression values as continuous variables to conduct differential analysis, generate risk score model and verify diagnostic model; tumor microenvironment differential gene function enrollment was carried. Univariate Cox regression analysis estimated the differential analysis, generated risk score calculation and diagnostic model verification and develop TME differential gene function enrollment. The ovarian cancer patients in our hospital from January 2020 to January 2023 were tested for potential selected genes as diagnostic markers. The expression of tumor microenvironment was closely related to the development and diagnosis of ovarian cancer. The optimal number of differential genes was 15, among which the genes of branched chain amino acid aminotransferase and enhancer of zeste homolog 2 were significant. These genes were enriched in the extracellular matrix organization and extracellular matrix receiver interaction pathway. The two genes, branched chain amino acid aminotransferase and enhancer of zeste homolog 2 were utilized as clinical markers to predict ovarian cancer patients at different stages, and the accuracy rate met the standard. Tumor microenvironment related genes can serve as effective clinical markers for the diagnosis and progression of ovarian cancer.
Keywords
Ovarian cancer, tumor microenvironment, prognosis, survival analysis, chemotherapy
Liver fibrosis or hepatic fibrosis, is usually the outcome of a sustained healing process that occurs in response to chronic liver damage. This damage can arise from various factors, including viral infections, autoimmune reactions, drug-induced injuries, cholestasis, and metabolic disorders[1]. Hepatic fibrosis is marked by the significant release of inflammatory cytokines and the excessive accumulation of extracellular matrix proteins following stimulation, leading to scar tissue formation. Among gynecologic cancers, ovarian cancer is one of the most common and the most fatal type of cancer, with a worldwide mortality rate of 70 %[1]. Because of the lack of specificity in the early stages of the disease, and even some patients without symptoms, it is difficult to detect it in its early stages among most of the patients[2], which results in being diagnosed at an advanced stage among the patients. The traditional treatment methods for ovarian cancer include surgery, radiotherapy and chemotherapy[3,4]. However, the limitation of this disorder is that it cannot improve the survival rate of advanced patients. The 5 y survival rate of advanced ovarian cancer is <30 %[5]. Despite the significant advances in early diagnosis and multidisciplinary cancer treatment, the prognosis for ovarian cancer is far away from adequate satisfaction[6]. Tumor Microenvironment (TME) is crucial for cancer initiation and progression[7]. As shown by recent studies, TME comprises of a series of immune and stromal cells. There is growing evidence that immune mediators in TME are crucial in the development and progression of ovarian cancer[8]. However, limited research has been conducted on the association between TME-related genes and the prognosis of ovarian cancer patients.
Materials and Methods
General information:
The Cancer Genome Atlas (TCGA) (https://tcga-data.nci.nih.gov/tcga/) database includes 513 ovarian cancer individuals. Among them, 169 ovarian cancer individuals were involved in the final analysis based on their complete survival information. A retrospective study was conducted by randomly selecting 178 patients who were pathologically diagnosed with ovarian cancer in our hospital between January 2020 and January 2023. 18 individuals were excluded while the remaining 160 of them were included in the study. The hospital ethics committee approved all the treatments and tests. Informed consent was obtained from patients or their families.
Inclusion criteria:
The patients whose age was between (40-70) y; patients who have signed the informed consent form; patients who met the diagnostic criteria of National Comprehensive Cancer Network (NCCN) guidelines of 2016 and patients whose clinical data was complete were included in the study.
Exclusion criteria:
Similarly, patients having other malignant tumors except ovarian cancer; patients having other ovary diseases and patients who did not have the signed consent from patients or family members were excluded from the study.
Least Absolute Shrinkage and Selection Operator (LASSO) Cox regression analysis:
Univariate Cox regression analysis was conducted on all ovarian cancer patients based on the expression values of 760 TME-related genes in TCGA database. Genes significantly related to ovarian cancer prognosis were selected using a threshold of p<0.01[8]. LASSO Cox regression analysis was used to further optimize TME-related genes related to prognosis of ovarian cancer. We calculated the risk score for each patient using the selected genes according to the below provided formula.
Risk score=Ʃn i=1Coefi×Xi
In this study, Coefi represents the regression coefficient of each factor calculated by LASSOCox model, and Xi represents the expression value of each factor.
Further, the selected individuals were divided into 2 groups, individuals with low risk in a group and individuals with high risk in another group, based on the median value of the risk score.
Gene function enrichment analysis:
Enrichment analysis was conducted using “clusterprofiler” package according to R language[9] to analyze the differentially expressed genes. Functional enrichment analysis package was used to enrich Gene Ontology (GO) terms, including biological process, molecular function, and cellular component, as well as Kyoto Encyclopedia of Genes and Genomes (KEGG) pathways where p<0.05 was considered as the selection criteria for screening GO and KEGG pathways.
Clinical detection of Branched Chain amino acid Aminotransferase (BCAT) and Enhancer of Zeste Homolog 2 (EZH2) concentrations in ovarian cancer patients:
The concentration of BCAT and EZH2 was determined using the double antibody sandwich Enzyme Linked Immunosorbent Assay (ELISA) method by strictly following the kit instructions (purchased from Abcam company). Peripheral blood samples were collected for this study.
Statistical analysis:
The study used R language software package to perform the statistical analysis. The overall survival rate of both the groups was estimated using the Kaplan-Meier method; the significance of survival rate differences between groups was tested using the log-rank test[10]. Other factors and risk scores were included in the multivariate Cox regression model to determine whether risk score can be an independent factor affecting prognosis.
Results and Discussion
Screening of TME related differentially expressed genes were carried. We analyzed 760 TME-related gene expression values by Cox regression analysis and we calculated the Hazard Ratio (HR) of each gene. The optimal number of genes was 15 where BCAT and EZH2 genes were most significantly different (fig. 1); p<0.01 was determined as selecting criteria.
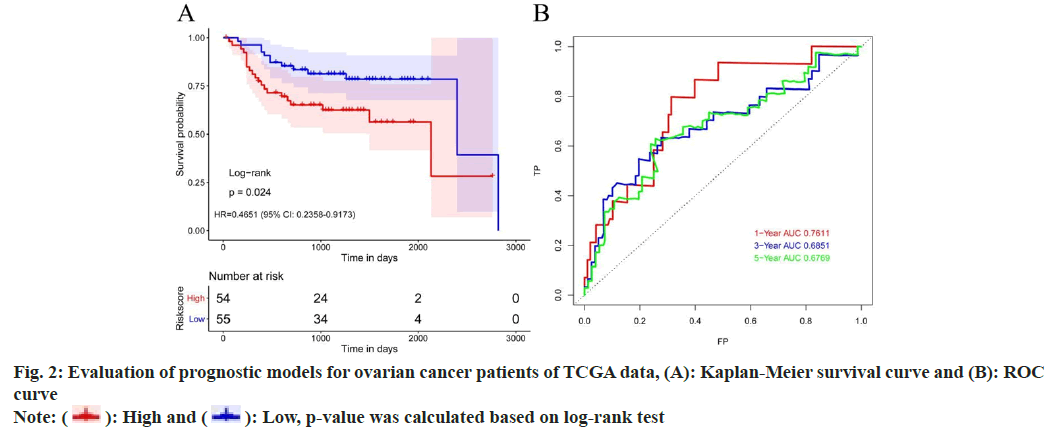
Further, risk score calculation and prognostic model validation were studied. Based on 15 differential TME genes, risk score was calculated for each patient. Based on the median value of the risk score, the TCGA dataset was divided into 2 groups, high risk and low risk groups. Survival analysis denoted that high risk ovarian cancer patients have poor overall survival rate than low risk patients. Meanwhile, time-dependent Receiver Operating Characteristic (ROC) curve can suggest that the risk model constructed by 15 differentially expressed TME genes can effectively predict the prognosis of all ovarian cancer patients (fig. 2).
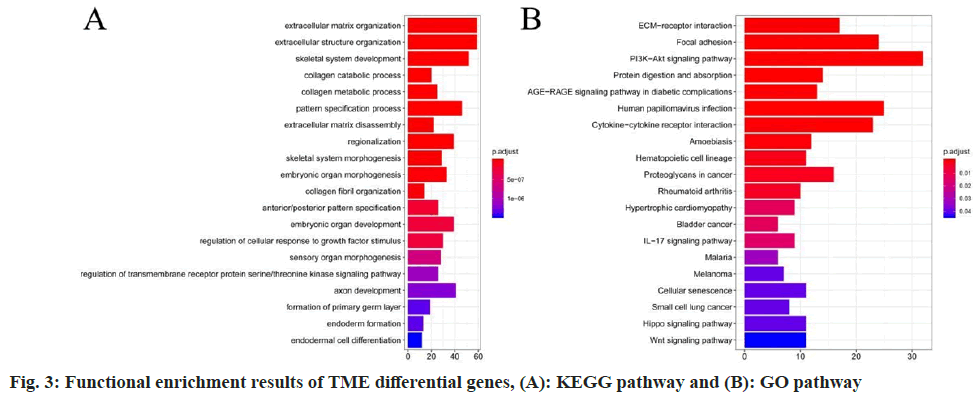
Analysis of enrichment investigation for differentially expressed genes was studied. To further investigate the molecular functions and biological pathways related to these differentially expressed genes, we conducted functional enrichment analysis in this study. The results revealed that the 15 key TME genes were significantly enriched in GO terms related to Extracellular Matrix (ECM) organization and KEGG pathways such as ECM-receptor interaction (fig. 3).
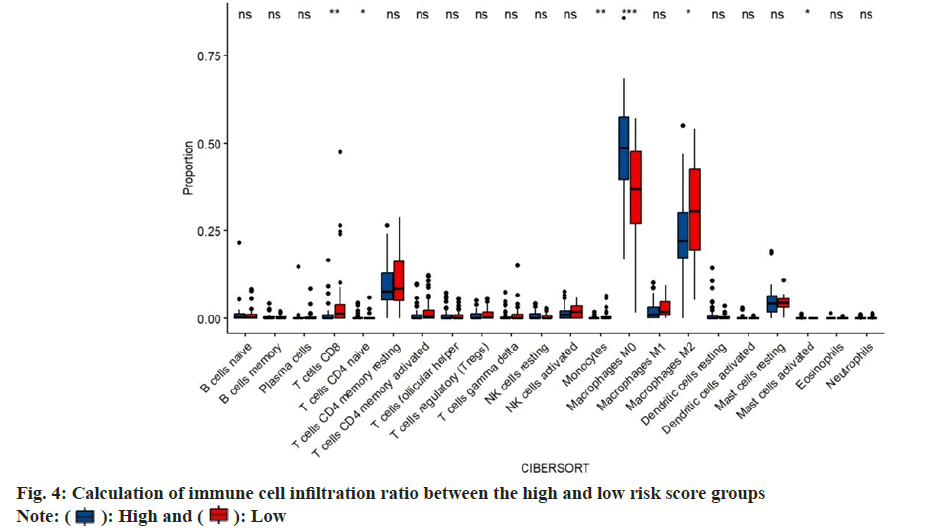
Immune cell infiltration ratio was calculated. In order to study the composition of various immune cells in ovarian cancer patients, we analyzed the proportion of 22 types of immune cells in each patient of using the CIBERSORT algorithm, and compared the difference in the proportion of 22 types of infiltrating immune cells between the high risk score group and the low risk score group. In the high risk score group, immature B cells, resting memory Cluster of Differentiation 4 (CD4+) T cells, CD8+ T cells, activated memory CD4+ T cells and Gamma-Delta (γδ) T follicular helper cells. The proportion of T cells, M1 macrophages, resting dendritic like cells and activated dendritic like cells was significantly lower in the low risk score group. While, the proportion of resting Natural Killer (NK) cells, M0 macrophages, M2 macrophages and resting mast cells in the high risk score group was higher than that in the low risk score group (fig. 4).
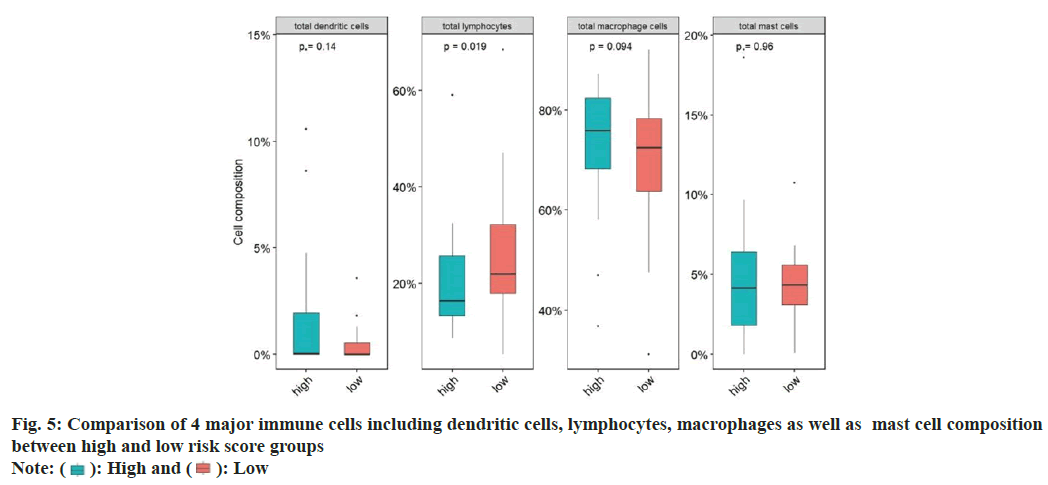
Next, we examined the immune cell infiltration ratio for ovarian cancer patients. For this, we summarized and divided immune cells into four categories, namely dendritic cells, lymphocytes, macrophages, and mast cells, and compared the proportion differences of the four categories of cells in the high and low risk score groups. The proportion of dendritic cells and lymphocytes in the high risk score group was significantly lower than that in the low risk score group. The proportion of macrophages and mast cells in the high risk score group was significantly higher than that in the low risk score group (fig. 5).
In vivo clinical test for BCAT and EZH2 in ovarian cancer patients was studied. BCAT and EZH2 were used as clinical markers to predict ovarian cancer patients of different tumor stages and the accuracy was assured to meet the standard (Table 1).
| Group | Tumor, Node and Metastasis (TNM) stage 1 (forecast/actual) | TNM stage 2 (forecast/actual) | TNM stage 3 (forecast/actual) | TNM stage 4 (forecast/actual) |
|---|---|---|---|---|
| BCAT | 93.0 % | 92.6 % | 87.5 % | 88.6 % |
| EZH2 | 91.2 % | 85.1 % | 91.4 % | 83.9 % |
Table 1: BCAT and EZH2 Can Serve as Markers for Ovarian Cancer Patients Prognosis in Different Tumor Stages (n)
Currently, for ovarian cancer, the breakthrough progress in prognosis is still lacking, especially in case of effective biomarkers[11]. This study was conducted through ovarian carcinoma samples of the patients. The gene expression analysis of the samples revealed that several TME genes were closely associated with ovarian carcinoma prognosis. It is worth noting that most to the differentially expressed genes are risk causing genes for ovarian cancer. TME is composed of a large number of cells from the adaptive immune system and innate immune system. According to their phenotypic and functional characteristics, these cells can be divided into anti-tumor cells and pre-tumor cells[12].
Based on our findings, pre-tumor cells may play a more critical role in the development and progression of ovarian cancer. These cells promote immune evasion of tumor cells by suppressing the immune responses and generating immune tolerance. These cells include regulatory T cells (Tregs), Myeloid Derived Suppressor Cells (MDSCs) and Tumor Associated Macrophages (TAM)[13]. Previous studies have shown an increase in the number of pre-tumor immune cells in the peripheral blood of the ovarian cancer patients when compared with those of the healthy donors[14]. Additionally, the size of the ovarian cancer tumors is determined by the percentage of pre-tumor immune cells[15].
Currently, single-cell transcriptomics work was performed by Dr. Olalekan and his colleagues using 9885 cells isolated from the omentum in 6 patients with ovarian cancer. Basically, they isolated major cell types, including cancer, stromal and immune cells. For the TME components, they demonstrated the ones which are closely associated with ovarian cancer and grouped them into 2 groups, namely High T cell infiltrating (H Tinf) group and Low T cell infiltration (L Tinf). Meanwhile, thymocyte selection associated high mobility group box (TOX)-expressing Tissue Resident Memory (TRM) CD8+ cytotoxic T cells and granulysin-expressing CD4+ T cell clusters are enriched in the high Tinf group. Similarly, our work also supports the prominent effects of T cell members, elucidating the immune response within ovarian tumors from these regulatory factors.
Indeed, due to the outstanding functions of TME factors in ovarian tumors development, number of novel drugs targeting the components TME has been approved by The United States Food and Drug Administration (FDA) in solid cancers. For instance, treatment with Immune Checkpoint Inhibitors (ICIs), Chimeric Antigen Receptor (CAR)- and T-Cell Receptor (TCR)-engineered cells has been rapidly developing. At the same time, the efficiency of several therapeutic drugs could be improved significantly if immunotherapy is included as an adjuvant therapy, in combination with chemotherapy, radiation therapy or by the use of anti-angiogenesis drugs and use of Poly Adenosine Diphosphate (ADP) Ribose Polymerase inhibitors (PARPi).
This study presents a risk scoring model for predicting the prognosis of ovarian cancer, using TME-related gene expression as the independent variable. The Area under Curve (AUC) value evaluates and recognizes the accuracy of the model prediction, which not only proves the rationality of the method but also highlights the importance of the prediction model for future ovarian cancer prognosis. Additionally, this study aims to establish a prognostic model for ovarian cancer by exploring multiple key related genes.
BCAT is the enzyme which is responsible for catalyzing the 1st step of Branched-Chain Amino Acid (BCAA) catabolism. In recent years, the potential functions of BCAT in tumors have attracted more and more attention of scientists and there have been continuous research reports explaining that BCAT plays an important role in the tumors. The connections between BCAT1 and breast cancer has been deeply investigated. A number of experiments have demonstrated that BCAT1 was required for breast cancer growth as well as for its development. It was found that in terms of proliferation regulation, BCAT1 could be considered as direct target of cellular- Myelocytomatosis (c-Myc) oncogene, which is the activation promoter of metabolic reprogramming in breast cancer. In ovarian carcinoma, BCAT1 was involved in the proliferation and invasion of epithelial ovarian cancer cells. These underlines the molecular mechanisms that might be closely associated with cellular metabolic reprogramming, including Phosphoinositide 3 Kinase/Protein Kinase B/mammalian Target of Rapamycin (PI3K/ AKT/mTOR) pathway and Wingless-related integration site (Wnt)/Beta (β)-catenin signaling pathway or/and tumor gene regulation which includes c-Myc pathway[15,16]. Moreover, since BCAT is mainly responsible for the 1st step of the BCAA degradation, of which, metabolites are shunted into various metabolic processes. BCAAs and their catabolism at the BCAT step during T-cell metabolic reprogramming shed a putative role in the anti-tumor immunity of T cells[17].
Compared with BCAT, the internal relationship between EZH2 and cancer is still poorly understood. EZH2 which serves as main regulator of chromatin offers many potential activities for cancer therapy. While explaining, this evidence suggests that enhancer of EZH2 which is a component of the Polycomb Repressive Complex 2 (PRC2), might serve as a key regulator in controlling drug resistance. The overexpression of EZH2 has been observed in breast cancer and many other malignancies, which denotes a strong correlation with poor outcomes. Meanwhile, many cancers exhibit genetic, transcriptional and posttranscriptional dysregulation of EZH2[18-20].
In addition to analyzing the relationship between TME gene, prognosis of ovarian cancer patients, various immune cells and cellular pathways by bioinformatics methods, this study has also explored the feasibility of the most prominent gene detection prognosis in clinical practice. The results met expectations; however, this study has some limitations. As this was a single-center study with limited sample size, in order to promote the drug more effectively in clinical practice and truly become a reliable prognostic marker for ovarian cancer, multi-center as well as large sample size studies were necessary.
Conflict of interests:
The authors declared no conflict of interests.
References
- Chen B, Zhao L, Yang R, Xu T. The recent advancements of ferroptosis in the diagnosis, treatment and prognosis of ovarian cancer. Front Genet 2023;14:1-20.
[Crossref] [Google Scholar] [PubMed]
- Fotopoulou C, Eriksson AG, Yagel I, Chang SJ, Lim MC. Surgery for recurrent epithelial ovarian cancer. Curr Oncol Rep 2024;26(1):46-54.
[Crossref] [Google Scholar] [PubMed]
- Li C, Liu FY, Shen Y, Tian Y, Han FJ. Research progress on the mechanism of glycolysis in ovarian cancer. Front Immunol 2023;14:1-12.
[Crossref] [Google Scholar] [PubMed]
- Nguyen TT, Demeestere I. A journey to reach the ovary using next-generation technologies. Int J Mol Sci 2023;24(23):1-21.
[Crossref] [Google Scholar] [PubMed]
- Mendes AD, Freitas AR, Vicente R, Vitorino M, Vaz Batista M, Silva M, et al. Adipocyte microenvironment in ovarian cancer: A critical contributor? Int J Mol Sci 2023;24(23):16589.
[Crossref] [Google Scholar] [PubMed]
- Kozieł MJ, Piastowska-Ciesielska AW. Estrogens, estrogen receptors and tumor microenvironment in ovarian cancer. Int J Mol Sci 2023;24(19):1-14.
[Crossref] [Google Scholar] [PubMed]
- Xiong J, Fu Y, Huang J, Wang Y, Jin X, Wan X, et al. Metabolic and senescence characteristics associated with the immune microenvironment in ovarian cancer. Front Endocrinol 2023;14:1-14.
[Crossref] [Google Scholar] [PubMed]
- Newman AM, Liu CL, Green MR, Gentles AJ, Feng W, Xu Y, et al. Robust enumeration of cell subsets from tissue expression profiles. Nat Methods 2015;12(5):453-7.
[Crossref] [Google Scholar] [PubMed]
- Friedman J, Hastie T, Tibshirani R. Regularization paths for generalized linear models via coordinate descent. J Stat Softw 2010;33(1):1-22.
[Google Scholar] [PubMed]
- Yu G, Wang LG, Han Y, He QY. clusterProfiler: An R package for comparing biological themes among gene clusters. OMICS 2012;16(5):284-7.
[Crossref] [Google Scholar] [PubMed]
- Ostrowska-Lesko M, Rajtak A, Moreno-Bueno G, Bobinski M. Scientific and clinical relevance of non-cellular tumor microenvironment components in ovarian cancer chemotherapy resistance. Biochim Biophys Acta Rev Cancer 2023:1879(1):189036.
[Crossref] [Google Scholar] [PubMed]
- Rodriguez GM, Yakubovich E, Vanderhyden BC. Unveiling the immunogenicity of ovarian tumors as the crucial catalyst for therapeutic success. Cancers 2023;15(23):1-19.
[Crossref] [Google Scholar] [PubMed]
- Ruan D, Wen J, Fang F, Lei Y, Zhao Z, Miao Y. Ferroptosis in epithelial ovarian cancer: A burgeoning target with extraordinary therapeutic potential. Cell Death Discov 2023;9(1):1-10.
[Crossref] [Google Scholar] [PubMed]
- Staropoli N, Ciliberto D, Luciano F, Napoli C, Costa M, Rossini G, et al. The impact of PARP inhibitors in the whole scenario of ovarian cancer management: A systematic review and network meta-analysis. Crit Rev Oncol Hematol 2023:104229.
[Crossref] [Google Scholar] [PubMed]
- Sharma S, Sharma H, Gogoi H. Bacterial immunotherapy: Is it a weapon in our arsenal in the fight against cancer? Front Immunol 2023;14:1-13.
[Crossref] [Google Scholar] [PubMed]
- Zhang Z, Li Y, Fan L, Wang B, Liu W, Cui J, et al. LncRNA THUMPD3-AS1 promotes invasion and EMT in gastric cancer by regulating the miR-1297/BCAT1 pathway. iScience 2023;26(9).
[Crossref] [Google Scholar] [PubMed]
- Boskovic P, Wilke N, Man KH, Lichter P, Francois L, Radlwimmer B. Branched-chain amino acid transaminase 1 regulates glioblastoma cell plasticity and contributes to immunosuppression. Neuro Oncol 2024;26(2):251-65.
[Crossref] [Google Scholar] [PubMed]
- Sun F, Sun Y, Wang X, Zhu J, Chen S, Yu Y, et al. Engineered mesenchymal stem cell-derived small extracellular vesicles for diabetic retinopathy therapy through HIF-1α/EZH2/PGC-1α pathway. Bioact Mater 2024;33:444-59.
[Crossref] [Google Scholar] [PubMed]
- Wang J, Yang C, Xu H, Fan X, Jia L, Du Y, et al. The interplay between hif‐1α and ezh2 in lung cancer and dual‐targeted drug therapy. Adv Sci 2024;11(7):1-16.
[Crossref] [Google Scholar] [PubMed]
- Szymanowski W, Szymanowska A, Bielawska A, Lopez-Berestein G, Rodriguez-Aguayo C, Amero P. Aptamers as potential therapeutic tools for ovarian cancer: Advancements and challenges. Cancers 2023;15(21):1-41.
[Crossref] [Google Scholar] [PubMed]

 High and
  Low risk score
 High and
  Low, p-value was calculated based on log-rank test

 High and
  Low
Low
 High and
  Low
Low


