- *Corresponding Author:
- G. Preethi
Department of Pharmacy, Chalapathi Institute of Pharmaceutical Sciences, Guntur, Andhra Pradesh 522034, India
E-mail: preethigkishore123@gmail.com
| Date of Received | 14 September 2023 |
| Date of Revision | 22 May 2024 |
| Date of Acceptance | 22 October 2024 |
| Indian J Pharm Sci 2024;86(5):1765-1773 |
This is an open access article distributed under the terms of the Creative Commons Attribution-NonCommercial-ShareAlike 3.0 License, which allows others to remix, tweak, and build upon the work non-commercially, as long as the author is credited and the new creations are licensed under the identical terms
Abstract
A simple, fast, new, precise, sensitive, and accurate reverse-phase high performance liquid chromatography method was developed and validated according to International Council for Harmonisation guidelines for the estimation of enrofloxacin and ketoprofen in bulk and marketed formulation. Chromatographic separation was achieved using a Shimadzu high performance liquid chromatography system with an inertsil octadecylsilyl C18 column (4.6 mm×250 mm internal diameter, 5 µm particle size). The best results were obtained with the mobile phase composition consisting of 0.1 % trifluoroacetic acid, methanol, and acetonitrile in a ratio of 20:40:40 v/v/v. The system was regulated at a 0.7 ml/min flow rate at an optimized wavelength selected for detection at 262 nm. The retention time for enrofloxacin and ketoprofen were 2.941 and 5.756 min, respectively. The method has been validated for linearity, accuracy, precision, limit of detection, limit of quantification, and robustness as per International Council for Harmonisation guidelines. The calibration graphs were linear over the concentration range of 10-50 µg/ml for enrofloxacin and 6-30 µg/ml for ketoprofen. The values for enrofloxacin and ketoprofen were 1 µg/ml and 0.6 µg/ml for the limit of detection, and 0.3 µg/ml and 1.8 µg/ml for the limit of quantification, respectively. The analysis's conclusion indicates that for all of the validation parameters, the % relative standard deviation will be less than 2, and recovery studies revealed that the results were within the predetermined bounds. Therefore, it was determined that the suggested method was effective and that it could be utilized for the routine examination of enrofloxacin and ketoprofen in their marketed formulation.
Keywords
Enrofloxacin, ketoprofen, reverse-phase high performance liquid chromatography, method development, method validation
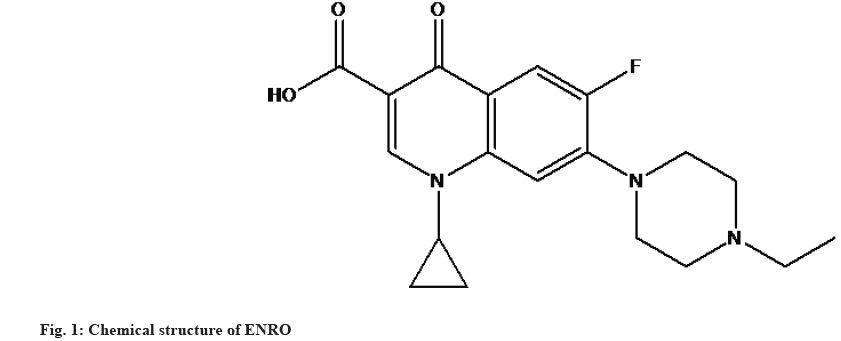
Enrofloxacin (ENRO) is a synthetic compound from the fluoroquinolone family, with antibacterial activity commonly used in mammals. ENRO prevents bacterial Deoxyribonucleic Acid (DNA) from unwinding and duplicating by inhibiting the enzymatic actions of bacterial gyrase and topoisomerase IV. ENRO exhibits potent antibacterial activity against both gram-positive and gram-negative bacteria. The molecular formula and molecular weight of ENRO are C19H22FN3O3 and 359.4 g/mol. ENRO is a pale yellowish or light yellow crystalline powder that is partially insoluble in water, slightly soluble in methanol, soluble in acetonitrile, and freely soluble in methylene chloride. Fig. 1 depicts the structural composition of ENRO, which is 1-cyclopropyl-7-(4- ethyl-1-piperazinyl)-6-fluoro-1,4-dihydro-4-oxo-3-quinolonecarboxylic acid[1-3].
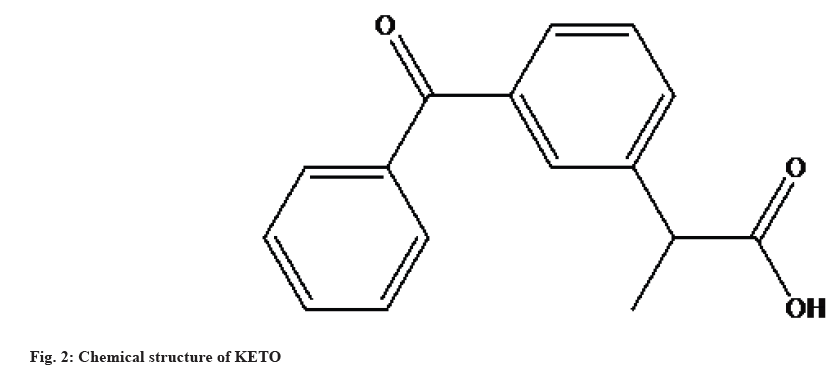
KETO is a Nonsteroidal Anti-Inflammatory Drug (NSAID) derived from propionic acid with anti- inflammatory, analgesic, and antipyretic properties for both animal and human use. KETO reduces the production of precursors to prostaglandins and thromboxanes by inhibiting the activity of the enzymes cyclooxygenase I and II. KETO also inhibits bradykinin, which is responsible for inflammation and pain. The molecular formula and molecular weight of KETO are C16H14O3 and 254.3 g/mol. It is a white or almost white crystalline powder that is partially insoluble in water, soluble in acetonitrile, and freely soluble in ethanol (95 %), chloroform, ether, and methanol. Fig. 2 depicts the structural composition of KETO, which is (2-(3-benzolphenyl)-propionic acid[4-6].
According to a literature review, multiple analytical techniques have been described for the estimation of KETO and ENRO separately, including spectrophotometer[7-11], Ultraviolet (UV) spectrophotometer[12-14], UV-visible spectrophotometric method[15], kinetic spectrophotometer[16], electrokinetic chromatography[17], Infrared (IR) spectroscopy[18], derivative IR spectroscopy[19], Fourier Transform Infrared (FTIR) spectroscopy[20], capillary electrophoresis[21-23], High-Performance Liquid Chromatography (HPLC)[24-38], flow injection[38,39], gas chromatography[40], and hyphenated techniques[41-44]. The present research is about the simultaneous estimation of KETO and ENRO by Reverse-Phase HPLC (RP-HPLC) in marketed formulation. The developed RP-HPLC method was validated for linearity, accuracy, precision, Limit of Detection (LOD), Limit of Quantitation (LOQ), and robustness as per International Conference on Harmonisation (ICH) Q2(R1) guidelines.
Materials and Methods
Chemicals and reagents:
The standard drugs, ENRO and KETO, were obtained from Vijayanand Roadlines Pharma Tech Enterprises. The veterinary injection of the combination ENRO (100 mg) and KETO (60 mg) was obtained from a local pharmacy. Water (HPLC grade), methanol (HPLC grade), acetonitrile (HPLC grade), and Trifluoroacetic acid (TFA) used for mobile phase preparation were obtained from Thermo Fisher Scientific India Pvt. Ltd., Mumbai, India. The simultaneous estimation of KETO and ENRO was conducted using a Shimadzu HPLC series Liquid Chromatography (LC)-2030C chromatographic system, while wavelength selection was performed with a LABINDIA 3092 UV-visible spectrophotometer.
Method development by RP-HPLC:
Chromatographic conditions: Inertsil Octadecylsilyl (ODS) C18 column (4.6×250 mm, 5 µm) was used for separation, and the mobile phase of 0.1 % TFA, methanol, and acetonitrile in the ratio of 20:40:40% v/v/v at the flow rate of 0.7 ml/min was chosen to provide appropriate peak resolution. The mobile phase was filtered through 0.45 µm membrane filter and degassed before use. The injection volume was 20 µl, and the elution was monitored at a wavelength of 262 nm.
Preparation of 0.1 % TFA: About 0.1 ml of TFA was pipetted out and transferred to a 100 ml volumetric flask, which was then filled to capacity with HPLC- grade water.
Preparation of mobile phase: A ratio of 20:40:40 % v/v/v mixture of 0.1 % TFA, methanol, and acetonitrile was used to make the mobile phase. The mobile phase prepared was filtered through a 0.45 µm membrane filter and sonicated to get rid of dissolved gases.
Diluent: As a diluent, a mixture of water and methanol in a ratio of 50:50 v/v was used.
Preparation of standard solutions:
Standard solutions of ENRO: A standard stock solution of ENRO was prepared by dissolving 10 mg of drug with diluent in a 10 ml volumetric flask and making up the volume to get a concentration of 1000 µg/ml. From the prepared stock solution, different volumes of standard solutions were taken and prepared at 10, 20, 30, 40, and 50 µg/ml concentrations of ENRO solutions.
Standard solutions of KETO: A standard stock solution of KETO was prepared by dissolving 20 mg of drug with diluent in a 100 ml volumetric flask and making up the volume to get a concentration of 200 µg/ ml. From the prepared stock solution, different volumes of standard solutions were taken and prepared at 6, 12, 18, 24, and 30 µg/ml concentrations of KETO solutions.
Preparation of sample solution: A 1 ml solution containing 100 mg ENRO and 60 mg KETO from the formulation was taken, dissolved in diluent, and made up to 10 ml with diluent. Further dilution was made by taking 1 ml of the above solution and diluting it to 10 ml with diluent. Further dilutions were made according to the requirements.
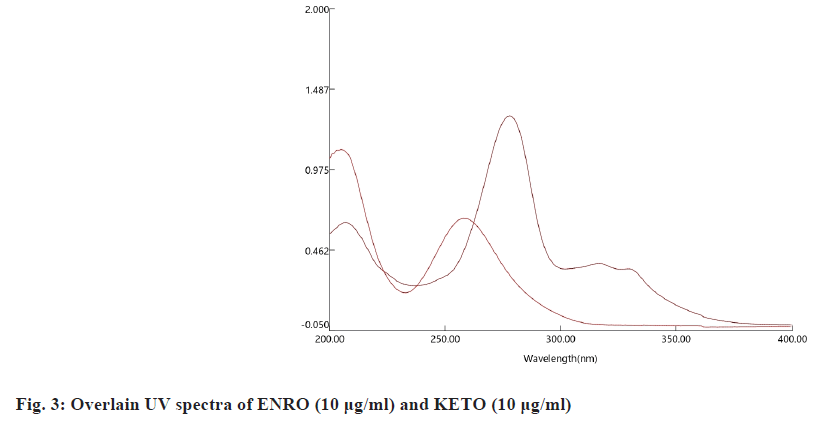
Wavelength selection: A 10 µg/ml of ENRO and KETO working standard solutions were prepared separately with diluent. The detection was carried out in the UV range (200-400) nm. The prepared solutions of ENRO and KETO were scanned in a UV-visible spectrophotometer between the wavelength ranges of 200-400 nm. The isobestic point of the drugs was found to be 262 nm, and it was selected as the wavelength for simultaneous estimation of ENRO and KETO (fig. 3).
Method validation: Method validation was performed in terms of system suitability, specificity, linearity, accuracy, precision, LOD, LOQ, and robustness according to ICH Q2(R1) guidelines.
System suitability: To ensure the validity of the analytical procedure, the chromatographic system was subjected to a system suitability test. After injecting the standard preparation into the RP-HPLC 6 times in a replicate, the theoretical plate, resolution, tailing factor, and percentage Relative Standard Deviation (RSD) of peak area were all calculated.
Specificity: The specificity of the analytical method is its ability to differentiate between the analytes and the other elements of the sample matrix. By individually injecting a 20 µl solution of the sample, standard, and blank into the chromatographic apparatus, specificity was evaluated.
Linearity: A method's capacity to deliver test findings that are directly proportional to sample concentration over a specified range of 10, 20, 30, 40, and 50 g/ml of ENRO and 6, 12, 18, and 24 g/ml of KETO was investigated. In order to make this determination, the relationship between sample concentration and detector response was used. Each method calibration curves were plotted, and the resulting data were then put through a regression analysis.
Accuracy: Accuracy is a metric for how closely the experimental value corresponds to the real concentration of the chemical in the matrix. In order to conduct the accuracy studies, multiple-level recovery studies were carried out by analysing standard additions at 3 levels. A known quantity of standard KETO and ENRO was added to a fixed equivalent quantity of the marketed formulation at levels of 50 %, 100 %, and 150 %, respectively. The percentage recovery was calculated.
Precision: System and method precision were used to assess the reproducibility of the proposed method. Precision experiments were carried out by preparing six determinations at concentrations of 30 µg/ml of ENRO and 18 µg/ml of KETO. System and method precision results were represented as a percentage of RSD.
LOD and LOQ: The standard calibration curve and the residual Standard Deviation (SD) of the regression lines of the y-intercept were used to determine the LOD and LOQ independently. LOD=3.3×D/S, LOQ=10×D/S, where, D is the standard deviation of the intercept of the regression line and S is the slope of the calibration curve.
Robustness: An analytical procedure's robustness is a measure of its ability to remain unaffected by small but intentional changes to the method parameters and offers a clue to its dependability under normal circumstances. Variations in the flow rate and mobile phase ratios were used to test the robustness. The outcome is given in percentage RSD.
Assay: An assay can be referred to as a quantitative measurement of the product's active pharmaceutical ingredient. The formulation contains 100 mg of ENRO and 60 mg of KETO. The sample solution was treated the same as the standard solution. The solutions were injected into RP-HPLC.
Results and Discussion
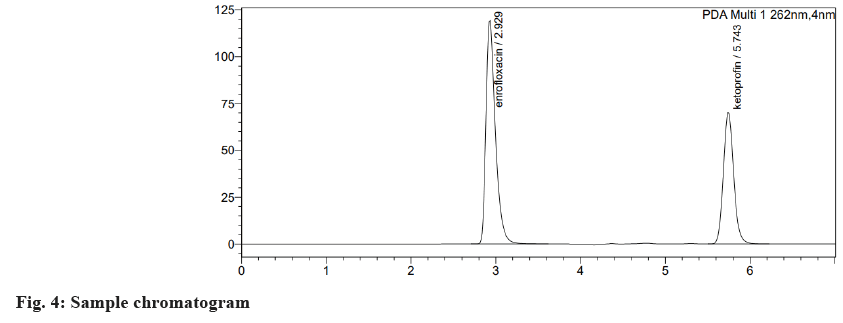
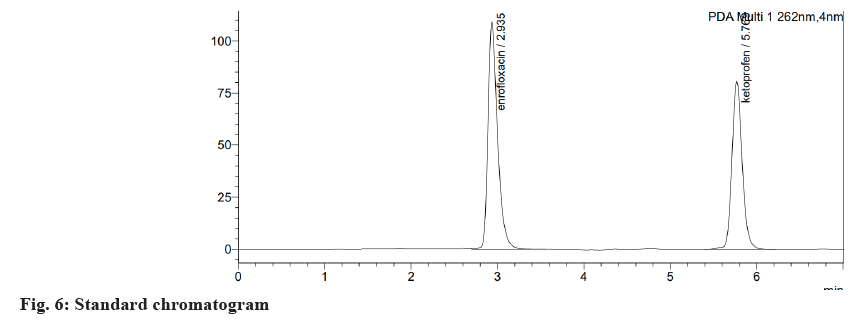
Table 1 and Table 2 shows the results of the system suitability test. According to ICH guidelines, all the system suitability parameters were within the acceptable range. Fig. 4 illustrates the specificity of the current RP-HPLC method of analysis without any interference in retention time, the entire and clear separation of ENRO and KETO was seen. As the blank chromatogram (fig. 5) did not show any peak at the retention time of the analyte and the retention time was identical for both the sample (fig. 4) and standard (fig. 6) chromatograms, the developed analytical method was said to be specific.
| S.no | ENRO | KETO |
|---|---|---|
| 1 | 3116073 | 1952984 |
| 2 | 3112573 | 1949552 |
| 3 | 3132460 | 1954507 |
| 4 | 3116073 | 1952984 |
| 5 | 3112573 | 1949552 |
| 6 | 3132460 | 1954507 |
| Mean | 3120369 | 1952348 |
| SD | 9495.799 | 2072.309 |
| % RSD | 0.30 | 0.11 |
Table 1: The System Suitability Test Results
| Parameters | ENRO | KETO | Acceptance criteria |
|---|---|---|---|
| Number of theoretical plates (N) | 3032 | 9831 | >2000 |
| Resolution (Rs) | - | 12.73 | >1.5 |
| Tailing factor (T) | 1.401 | 1.143 | <2.0 |
| RSD | 0.30 | 0.11 | <2 % |
Table 2: The System Suitability Parameters of ENRO and KETO
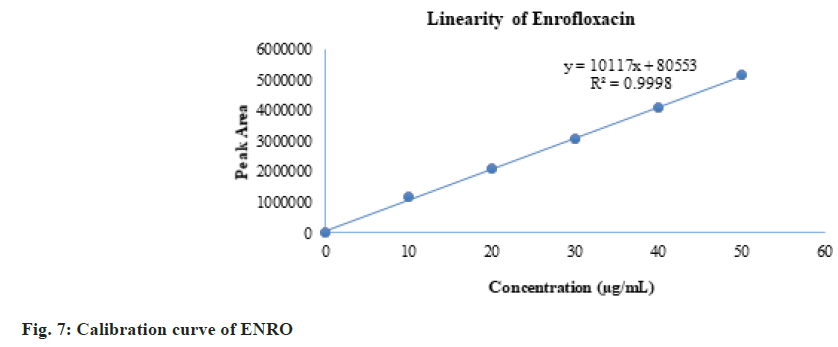
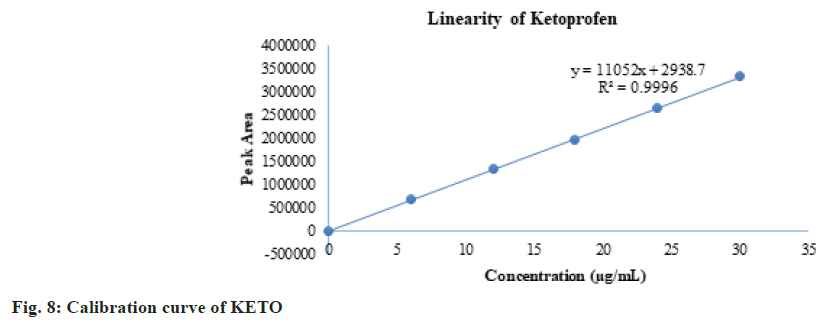
The linearity results are given in Table 3. The linearity ranges for ENRO and KETO were found to be 10-50 µg/ml and 6-30 µg/ml respectively. The calibration curve of ENRO is given in fig. 7, and that of KETO is given in fig. 8. The observed correlation coefficients for ENRO and KETO were found to be 0.9998 and 0.9996, respectively. Table 4 shows the HPLC area responses for accuracy determinations. For ENRO and KETO, the mean percentage recovery was found to be 99.79 % and 100.001 %, respectively. The results of the repeatability of system and method precision are given in Table 5. The developed analytical method was found to be precise, as the % RSD values of the system precision studies were 0.30 and 0.12 for ENRO and KETO, and the method precision study values were 0.29 and 0.13 for ENRO and KETO. Table 6 shows the LOD and LOQ study results. Serial dilutions of ENRO and KETO stock solutions were used for determining LOD.
| ENRO | KETO | ||
|---|---|---|---|
| Concentration (µg/ml) | Peak area | Concentration (µg/ml) | Peak area |
| 10 | 1200132 | 6 | 664091 |
| 20 | 2122510 | 12 | 1345125 |
| 30 | 3096827 | 18 | 1945510 |
| 40 | 4080939 | 24 | 2636046 |
| 50 | 5158677 | 30 | 3338760 |
| Correlation coefficient (r2) - 0.9998 | Correlation coefficient (r2) - 0.9996 | ||
Table 3: Linearity Results of KETO and ENRO
| % Level | ENTO | KETO | ||||||||
|---|---|---|---|---|---|---|---|---|---|---|
| Sample peak area | Standard peak area | % recovery (%) | Average % recovery (%) | Mean % recovery (%) | Sample peak area | Std peak area | % recovery (%) | Avg % recovery (%) | Mean % recovery (%) | |
| 50 % | 1045621 | 3120369 | 99.72 | 100.08 | 99.79 | 655416 | 1952348 | 100.25 | 100.21 | 100 |
| 1051256 | 3120369 | 100.26 | 654899 | 1952348 | 100.13 | |||||
| 1051489 | 3120369 | 100.28 | 655658 | 1952348 | 100.25 | |||||
| 100 % | 3135647 | 3120369 | 99.26 | 99.47 | 1956245 | 1952348 | 99.7 | 99.67 | ||
| 3132456 | 3120369 | 99.58 | 1954896 | 1952348 | 99.63 | |||||
| 3132789 | 3120369 | 99.59 | 1955891 | 1952348 | 99.68 | |||||
| 150 % | 5233694 | 3120369 | 99.83 | 99.84 | 3272514 | 1952348 | 100.07 | 100.12 | ||
| 5236211 | 3120369 | 99.88 | 3275689 | 1952348 | 100.17 | |||||
| 5233289 | 3120369 | 99.82 | 3274569 | 1952348 | 100.13 | |||||
Table 4: Accuracy Results for ENRO and KETO
| S. No | System precision | Method precision | ||
|---|---|---|---|---|
| ENRO | KETO | ENRO | KETO | |
| 1 | 3116132 | 1953232 | 3121132 | 1953691 |
| 2 | 3112637 | 1949613 | 3112741 | 1949824 |
| 3 | 3132506 | 1954601 | 3133631 | 1954839 |
| 4 | 3126147 | 1953016 | 3129293 | 1954822 |
| 5 | 3112653 | 1949621 | 3112925 | 1949371 |
| 6 | 3132489 | 1954521 | 3130721 | 1954628 |
| Average | 3122094 | 1952434 | 3123497 | 1952863 |
| S.D | 9455.214 | 2275.873 | 9181.299 | 2567.982 |
| % RSD | 0.30 | 0.12 | 0.29 | 0.13 |
Table 5: System and Method Precision Results for ENRO and KETO
| Detection wavelength (nm) | LOD (µg/ml) | LOQ (µg/ml) | ||
|---|---|---|---|---|
| ENRO | KETO | ENRO | KETO | |
| 262 | 1 | 0.6 | 3 | 1.8 |
Table 6: LOD and LOQ Results for ENRO and KETO
The linearity results are given in Table 3. The linearity ranges for ENRO and KETO were found to be 10-50 µg/ml and 6-30 μg/ml, respectively. The calibration curve of ENRO is given in fig. 7, and that of KETO is given in fig. 8. The observed correlation coefficients for ENRO and KETO were found to be 0.9998 and 0.9996, respectively. Table 4 shows the HPLC area responses for accuracy determinations. For ENRO and KETO, the mean percentage recovery was found to be 99.79 % and 100.001 %, respectively. The results of the repeatability of system and method precision are given in Table 5. The developed analytical method was found to be precise, as the % RSD values of the system precision studies were 0.30 and 0.12 for ENRO and KETO, and the method precision study values were 0.29 and 0.13 for ENRO and KETO. Table 6 shows the LOD and LOQ study results. Serial dilutions of ENRO and KETO stock solutions were used for determining LOD and LOQ. The LOD results were 1 µg/ml and 0.6 µg/ml for ENRO and KETO, and the LOQ results were 3 µg/ ml and 1.8 µg/ml for ENRO and KETO, respectively. Table 7 shows the results of the robustness analysis of the developed analytical method. All the parameters of the system suitability were not much affected, and the % RSD was within the accepted limit. As a result, the analytical technique would be considered robust.
| S. No | Condition | % RSD of ENRO | % RSD of KETO | |
|---|---|---|---|---|
| 1 | Decrease in flow rate-0.6 ml/min | 1.094 | 1.006 | |
| 2 | Increase in flow rate-0.8 ml/min | 0.436 | 0.850 | |
| 3 | Mobile phase ratios of 50:10:40 v/v/v of methanol, 0.1 % TFA, acetonitrile | 0.163 | 0.189 | |
| 4 | Mobile phase ratios of 40:10:50 v/v/v of methanol, 0.1 % TFA, acetonitrile | 0.496 | 0.329 | |
Table 7: Robustness Results for ENRO and KETO
The percentage assay of ENRO and KETO was found to be 99.55 % and 99.65 %, respectively, as shown in Table 8. The present method established showed that it was easy, specific, particular, and capable of producing results that were exact and precise. A column made of inertsil ODS C18 (4.6 mm×250 mm internal diameter, 5 µm particle size) was used for the separation. At a flow rate of 0.7 ml/min and a detection wavelength of 262 nm, the mobile phase of 0.1 % TFA, methanol, and acetonitrile in the ratio of 20:40:40 % v/v/v was fed into the column. Additionally, the method's efficiency was demonstrated by its faster analytical time and lower mobile phase consumption. The analysis's conclusion indicated that for all of the validation parameters, the % RSD would be less than 2, and recovery studies revealed that the results were within the predetermined bounds. Therefore, it was determined that the suggested method was effective and that it could be utilised for the routine examination of ENRO and KETO in their marketed formulation.
| Drugs | Formulation contain | % assay |
|---|---|---|
| ENRO | 100 mg | 99.58 |
| KETO | 60 mg | 99.65 |
Table 8: Assay of ENRO and KETO
Acknowledgements:
We would like to express my sincere gratitude to the Chalapathi Institute of Pharmaceutical Sciences for providing the necessary resources, support, and platform that enabled the successful completion of this research project. The facilities, guidance from faculty members, and access to the library greatly contributed to the quality of this work. We are thankful for the opportunities and environment provided by the Chalapathi Institute of Pharmaceutical Sciences, which fostered intellectual growth and encouraged the pursuit of knowledge.
Conflict of interest:
The authors declared no conflict of interests.
References
- Grabowski L, Gaffke L, Pierzynowska K, Cyske Z, Choszcz M, Węgrzyn G, et al. Enrofloxacin-the ruthless killer of eukaryotic cells or the last hope in the fight against bacterial infections? Int J Mol Sci 2022;23(7):3648.
[Crossref] [Google Scholar] [PubMed]
- Trouchon T, Lefebvre S. A review of enrofloxacin for veterinary use. Open J Vet Med 2016;6(2):40-58.
- Government of India. Ministry of health and family welfare, Indian Pharmacopoeia. 9th ed. 2022.
- Reyes VM, Martinez O, Hernandez GF. National center for biotechnology information. Plant Breeding. Antonio Narro Autonomous Agrarian University, Antonio Narro Causeway. 1923.
- Kantor TG. Ketoprofen: A review of its pharmacologic and clinical properties. Pharmacotherapy 1986;6(3):93-102.
[Crossref] [Google Scholar] [PubMed]
- Kormosh Z, Hunka I, Basel Y. Spectrophotometric determination of ketoprofen and its application in pharmaceutical analysis. Acta Pol Pharm 2009;66(1):3-9.
[Google Scholar] [PubMed]
- Vittal GV, Deveswaran R, Bharath S, Basavaraj BV, Madhavan V. Development of an analytical method for spectrophotometric estimation of ketoprofen using mixed co solvency approach. Int J Pharm Sci Res 2012;3(4):1053-6.
- Mostafa S, El-Sadek M, Alla EA. Spectrophotometric determination of enrofloxacin and pefloxacin through ion-pair complex formation. J Pharm Biomed Anal 2002;28(1):173-80.
[Crossref] [Google Scholar] [PubMed]
- EL Sherif ZA. Spectrophotometric determination of enrofloxacin through the formation of a binary complex with iron III, ion-pair and charge-transfer complexation in pure and dosage forms. Anal Lett 2008, 32(1), 65-78.
- Patel M. Development and validation of differential spectrophotometric method for assay of enrofloxacin in bulk and tablet formulation. GRIN Verlag 2023;8(7):98-103.
- Shahnaz M, Sharma S, Sharma A, Prasad DN. Analytical method development and validation of ketoprofen tablet by UV spectrophotometer. Int J Pharm Chem Anal 2020;7(1):39-50.
- Nikolaychuk PA. UV spectra of aqueous or ethanolic solutions of twenty-seven active pharmaceutical ingredients. Scr Sci Pharm 2022;9(1):7-20.
- ElmahadiI TO, Shantier SW, Adam ME. Development and validation of UV-spectrophotometric method for the determination of enrofloxacin in synthetic form and veterinary injectible dosage forms. Asian J Pharm Sci 2019;9(1):11-4.
- Hassan AA, Shantier SW, Gad-kariem EA. Development and validation of UV-visible spectrophotometric method for estimation of ketoprofen in capsule and tablet dosage forms. Indo Am J Pharm Res 2019;9(01):1865-70.
- El-Brashy A, Eid M, Talaat W. Kinetic spectrophotometric method for the determination of ketoprofen in pharmaceuticals and biological fluids. Int J Biomed Sci 2006;2(4):406.
[Google Scholar] [PubMed]
- Safra J, Pospisilova M. Separation and determination of ketoprofen, methylparaben and propylparaben in pharmaceutical preparation by micellar electrokinetic chromatography. J Pharm Biomed Anal 2008;48(2):452-5.
[Crossref] [Google Scholar] [PubMed]
- Othman N. IR Spectroscopy in qualitative and quantitative analysis. IntechOpen; 2022.
- Azeez AM, Fakhre NA. Determination of ketoprofen in tablet dosage forms by derivative IR spectroscopy. Egypt J Chem 2022;65(1):215-9.
- Rebouças CT, Kogawa AC, Salgado HR. A new green method for the quantitative analysis of enrofloxacin by fourier-transform infrared spectroscopy. J AOAC Int 2018;101(6):2001-5.
[Crossref] [Google Scholar] [PubMed]
- Blanco M, González J, Torras E, Valverde I. Enantiomeric purity determination of ketoprofen by capillary electrophoresis: Development and validation of the method. Anal Bioanal Chem 2003;375:157-63.
[Crossref] [Google Scholar] [PubMed]
- Barrón D, Jiménez-Lozano E, Cano J, Barbosa J. Determination of residues of enrofloxacin and its metabolite ciprofloxacin in biological materials by capillary electrophoresis. J Chromatogr B Biomed Sci Appl 2001;759(1):73-9.
[Crossref] [Google Scholar] [PubMed]
- Schmitt-Kopplin P, Burhenne J, Freitag D, Spiteller M, Kettrup A. Development of capillary electrophoresis methods for the analysis of fluoroquinolones and application to the study of the influence of humic substances on their photodegradation in aqueous phase. J Chromatogr A 1999;837(1-2):253-65.
- Farinotti R, Mahuzier G. High-performance liquid chromatographic determination of ketoprofen in blood and urine. J Pharm Sci 1979;68(4):484-5.
[Crossref] [Google Scholar] [PubMed]
- Dvorak J, Hajkova R, Matysova L, Novakova L, Koupparis MA, Solich P. Simultaneous HPLC determination of ketoprofen and its degradation products in the presence of preservatives in pharmaceuticals. J Pharm Biomed Anal 2004;36(3):625-9.
[Crossref] [Google Scholar] [PubMed]
- Bempong DK, Bhattacharyya L. Development and validation of a stability-indicating high-performance liquid chromatographic assay for ketoprofen topical penetrating gel. J Chromatogr A 2005;1073(1-2):341-6.
[Crossref] [Google Scholar] [PubMed]
- Mariana G, Bota S, Felicia G, Corina M, Laura V, Bojita M. The identification and assay of ketoprofen from solid pharmaceutical forms. Validation of HPLC method. Farmacia 2008;6(4):433-9.
- Allegrini A, Nuzzo L, Zucchelli M, Scaringi AT, Felaco S, Giangreco D, et al. Fast HPLC method for the determination of ketoprofen in human plasma using a monolithic column and its application to a comparative bioavailability study in man. Arzneimittelforschung 2009;59(03):135-40.
[Crossref] [Google Scholar] [PubMed]
- Tsvetkova B, Peikova L. HPLC determination of ketoprofen in tablet dosage forms. Trakia J Sci 2013;11(1).
- Zafar F, Shoaib MH, Naz A, Yousuf RI, Ali H. Determination of ketoprofen in human plasma by RP-HPLC. Am J Analyt Chem 2013;04(05):252-7.
- Tsvetkova B, Peikova LI. HPLC method for simultaneous determination of ketoprofen and preservatives in gel formulation. Int J Pharm Pharm Sci 2014;6:199-202.
- Kotthireddy K, Devi BR. Development of RP-HPLC method for the estimation of in vitro and in vivo samples of ketoprofen in bulk drug and transdermal dosage form. Int J Pharm Sci Res 2016;7(5):2152.
- Luo L, Tan M, Luo Y. Determination of related substances in ketoprofen injection by RP-HPLC method. Pak J Pharm Sci 2019;32(4):1607-15.
[Google Scholar] [PubMed]
- Shafique A, Alothman ZA, Akram S, Akram S, Sohail CS, Mushtaq M. An expedient and rapid high-performance liquid chromatographic method for the kinetic study of ketoprofen. J King Saud Univ Sci 2020;32(3):2212-8.
- Souza MJ, Bittencourt CF, Morsch LM. LC determination of enrofloxacin. J Pharm Biomed Anal 2002;28(6):1195-9.
[Crossref] [Google Scholar] [PubMed]
- Chakravarthy VA, Sailaja BB, Kumar AP. Stability‐indicating RP‐HPLC method for simultaneous estimation of enrofloxacin and its degradation products in tablet dosage forms. J Anal Methods Chem 2015;2015(1):735145.
[Crossref] [Google Scholar] [PubMed]
- Aswathy SR, Muhas C, Sruthy AS, Deviswapna PV, Gopinath U. Validation and application of RP-HPLC method for quantification of enrofloxacin in pure and veterinary dosage forms. Int J Pharm Pharm Sci 2022;14(2):42-7.
- Ozlu C, Basan H, Satana E, Ertas N, Goger NG. Quantitative determination of ketoprofen in gels and ampules by using flow-injection UV spectrophotometry and HPLC. J Pharm Biomed Anal 2005;39(3-4):606-11.
[Crossref] [Google Scholar] [PubMed]
- Zhuang Y, Song H. Sensitive determination of ketoprofen using flow injection with chemiluminescence detection. J Pharm Biomed Anal 2007;44(3):824-8.
[Crossref] [Google Scholar] [PubMed]
- Bannimath GV, Purohit MN, Pujar GV. Determination of Ketoprofen in tablet dosage form by gas liquid chromatography. World J Chem 2010;5(1):67-70.
- Eichhold TH, Bailey RE, Tanguay SL, Hoke SH. Determination of (R)‐and (S)‐ketoprofen in human plasma by liquid chromatography/tandem mass spectrometry following automated solid‐phase extraction in the 96‐well format. J Mass Spectrom 2000;35(4):504-11.
[Crossref] [Google Scholar] [PubMed]
- Abdel-Hamid ME, Novotny L, Hamza H. Determination of diclofenac sodium, flufenamic acid, indomethacin and ketoprofen by LC-APCI-MS. J Pharm Biomed Anal 2001;24(4):587-94.
[Crossref] [Google Scholar] [PubMed]
- Tettey-Amlalo RN, Kanfer I. Rapid UPLC–MS/MS method for the determination of ketoprofen in human dermal microdialysis samples. J Pharm Biomed Anal 2009;50(4):580-6.
[Crossref] [Google Scholar] [PubMed]
- Chan CL, Wai HK, Wu P, Lai SW, Chan OS, Tun HM. A universal LC-MS/MS method for simultaneous detection of antibiotic residues in animal and environmental samples. Antibiotics 2022;11(7):845.
[Crossref] [Google Scholar] [PubMed]
- Guideline IH. Validation of analytical procedures: Text and methodology. Q2 (R1). 2005;1(20):05.
