- *Corresponding Author:
- R. Sahu
Institute of Pharmaceutical Research
GLA University
Mathura
Uttar Pradesh 281406
India
E-mail: rakeshsahu1100@gmail.com
| Date of Submission | 29 November 2019 |
| Date of Revision | 02 July 2021 |
| Date of Acceptance | 04 November 2021 |
| Indian J Pharm Sci 2021;83(6):1094-1106 |
Abstract
Nuclear magnetic resonance spectroscopy has largely given way for most important routine analysis of natural, synthetic drug candidate and related molecules. The quality control and simultaneous quantitation of different residual solvents, analytes and impurities have led analysts to further exploit nuclear magnetic resonance as a viable quantitative technique. Hence, this review focuses on the use and feasibility of this technique for quantitative method validation of drug and related compounds. Validated quantitative nuclear magnetic resonance methods were simple, robust, accurate and selective for evaluating different natural and synthetic samples using various commercially accessible compounds as internal standards. In this review numerous examples are cited giving proof of advancement in nuclear magnetic resonance technology and also for precise evaluation of molecular structures of substances in solids and liquid. Studied examples of different concurrent validation methods in the review shows that the results obtained is precise with less standard deviation when compared with other chromatography techniques. Concluding the entire review, various methodologies used for quantification and validations were reflected that proved to be a specific, selective and alternative means of method validation and it can be summarized that nuclear magnetic resonance is as reliable as the chromatography-based technique for quantitative analysis providing accuracy.
Keywords
Quantitative nuclear magnetic resonance, validation, internal standard, relative standard deviation, solvent
Nuclear Magnetic Resonance (NMR) spectroscopy is an illustrious analytical technique for structure elucidation of simple as well as complex molecules and applied in various branches of bio-sciences, chemistry, physics and medical diagnosis. Purcell and Bloch in 1945, discovered the phenomenon of Proton Nuclear Magnetic Resonance (1H NMR) in solids and liquids [1-6], and its application in quantitative analysis was reported in the year of 1963 by Forbes and Jungnickel [7]. NMR has been considered as a rapid, convenient, reliable and non-destructive method for quantitative evaluations and is a crucial analytical tool for the structural determination of unknown synthetic as well as natural compounds [8-13]. Additionally, it has the inherent benefits of giving simultaneous access to both qualitative and quantitative evaluation; latter is defined by the foremost ratio rule: the signal intensity is directly proportional to the number of nuclei that give rise due to a specific resonance. Advancement in NMR instrumentation and technology for instance high field magnets, solvent suppression techniques, cryoprobes and versatile pulse sequences has been leading many analysts to further exploit NMR as viable quantitative techniques. Nowadays, quantitative NMR (qNMR) measurements are reliable and precise as those results obtained by the more commonly used chromatographybased techniques. NMR technique provides advantages like: simple development of method, ease of sample preparation, relatively less analysis times and multiple calibration possibility without the need for similar reference materials [14-23].
In the well-recognized magnetic resonance technique, for the determination of nuclei magnetic moments by energy transitions, molecular beams are induced between levels of energy which coincide with different orientations of the nuclear spin in applied constant, strong strength of magnetic fields. Experiments are accomplished in a consistent magnetic field B0 (various Tesla) aligned along with the z-axis. As an outcome of this field, the space is no more isotropic and nuclei spins interaction will depend on the alignment of the molecule with due regard to the magnetic field B0 [24-32].
The foremost claims of one dimensional (1D) quantitative 1H NMR (qH-NMR) are the purity evaluation of organic compounds and the determination of possible potential impurities and development of second frequency dimension in NMR spectroscopy leads to direct association with the identification of molar concentration in a provided sample. In one set of two-dimensional NMR (2D-NMR) experiments, the Hamiltonian is swapped between the evolution period and the detection period. As a result of the evolution period, resonances are expanding into a second dimension to disclose their origins [19,33-43].
High-resolution NMR methods have been implemented for spin quantum I=1/2 (1H, 19F, 31P, etc.) [44], ultrafast Magic Angle Spinning (MAS) up to 70 kHz at ultra-high field (23.3 T) and efficient homonuclear decoupling in the case of strongly coupled nuclei. In parallel, ingenious intense resolution approach have been implemented for quadrupolar nuclei (I>1/2: 17O, 23Na, 27Al, etc.) [45], for instance Dynamic-Angle Spinning (DAS), Double Rotation (DOR), Multiple-Quantum Magic-Angle Spinning (MQ-MAS) and Satellite-Transition Magic- Angle Spinning (ST-MAS). All of these approaches enable the analyst to determine the asymmetric unit of a desired structure and the isotropic distribution of chemical shifts and quadrupolar factors [46-51].
The NMR signals intensities (is equal to areas under specific signals) can be taken for quantitative evaluations as the signal intensity (I) is directly correlated to the number of nuclei (N) bringing the signal. The linear association between the intensity of signal (I) and the number of possible nuclei ((N) in case of single pulse excitation) is given by:
[I=CS×N]
The proportionality constant (CS) results from different parameters of the spectrometer termed as “spectrometer constant”. Further the validation of qNMR methods and the accuracy of the integrals measuring the correctness of quantitation depend on factors like; (a) the spectrum noise level (S/N ratio), (b) shimming quality, (c) the shape, (d) baseline, drift and phase corrections and (e) choice of the window functions [52,53].
Perhaps the main restraint of qNMR technique is the need of human intervention throughout processing operations that nearly impact integral values (e.g. the integrated signals choice, integral tails setting and phasing). The quantitative accuracy deviation in qNMR has been reported to be <2.0 %, which is an acceptable limit for accurate and precise quantification [54-56]. NMR spectroscopy is a well-recognized analytical technique for qualitative and quantitative method validation (e.g., precision, linearity, accuracy, robustness, reproducibility, specificity and selectivity) [57]. Unlike other approaches, qNMR spectroscopy has certain processing and acquisition parameters and referencing approaches that needs careful consideration in order to acquire certain intense degree of precision and accuracy. One must take care of sample preparation and experimental approaches as they may stimulate significant errors in quantitative determination, thereby reduces the accuracy and the precision of the observing data [58].
Solvents used in NMR and solvent locking concept:
In both 1H and Carbon-13 (13C) NMR techniques Tetramethylsilane (TMS) or related compounds, are used as an internal reference which gives proton signal at 0.0 ppm and the carbon signal at 0.0 ppm in the NMR spectrum. However, in current scenario of advancements in NMR spectroscopy “solvent lock” concept has been taken into consideration. By using this concept addition of internal reference in solvent is not required as spectrometers can "lock" on solvent signals. The 1H and 13C NMR chemical shifts have been compiled for common laboratory solvents often used for analysis of compounds or contaminants in samples (examples of various selected solvents are given in Table 1 and Table 2) [59-63].
| Solvent (Deuterated) | Solvent residual peak (ppm) | H2O/Deuterated water (HOD) |
|---|---|---|
| Deuterated chloroform (CDCl3) Acetone ((CD3)2CO) Dimethyl sulfoxide ((CD3)2SO) Benzene (C6D6) Acetonitrile (CD3CN) Methanol (CD3OD) 2,2,2-Trifluoroethanol (TFE-d3) Deuterium oxide (D2O) |
7.26 2.05 2.50 7.16 1.94 3.31 5.02, 3.88 4.79 |
1.56 2.84 3.33 0.40 2.13 4.87 3.66 |
Table 1: 1H Nmr Chemical Shift Data
| Solvent (Deuterated) | Solvent signal (ppm) |
|---|---|
| CDCl3 Acetone ((CD3)2CO) CD3)2SO Benzene (C6D6) Acetonitrile (CD3CN) Methanol (CD3OD) 2,2,2-Trifluoroethanol (TFE-d3) Deuterium oxide (D2O) |
77.16±0.06 29.84±0.01 39.52±0.06 128.06±0.02 1.32±0.02 49.00±0.01 61.50, 126.28 - |
Table 2: 13c Nmr Chemical Shift Data
Quantitative Method Validation of Drugs and Excipients Using Nmr Technique
NMR spectrometer is a quantitative spectroscopic device, because the intensity of a peak or resonance line is directly corresponding to the number of resonant nuclei (spins). This fact permits, for a precise determination of the quantity of compounds in liquids as well as solids. Due to use of stronger and high steady magnetic fields including enhanced electronics the distinguishing limits have been poked down remarkably. Sometimes due to contemplation of accuracy protocol, control of evaluation procedure aspects, spectral processing and assessment which are responsible for the quantitative investigations of similar samples in diverse laboratories may differ severely (deviations in up to 90 % relative to gravimetric reference values). It considers all issues regarding linearity, specificity, robustness, selectivity and accuracy as well as influences of instrument specific parameters and the data processing and evaluation routines [64-66].
Quantitative validation of a novel anti-fungal drug (RI76):
Validation of RI76 (a novel anti-fungal drug) was accomplished on a Bruker 400 MHz Avance spectrometer by utilizing both the internal standard (IS) and the Electronic Reference to Access In Vivo Concentrations (ERETIC-2) calibration methods. The parameters for the quantitative evaluation were as follows: 16 scans, single 30° pulse, acquisition time of 4.12 s, relaxation delay of 15 s, a Spectrum Width (SW) of 20 ppm with the transmitter offset set at 7 ppm.
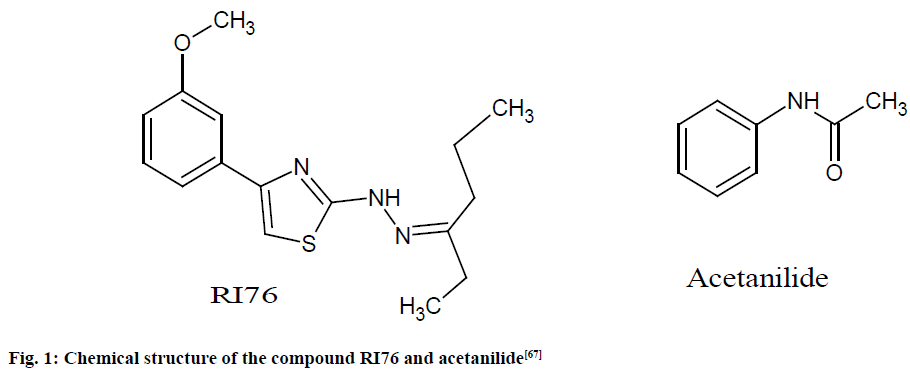
Acetanilide (99 %), Fumaric acids United States Pharmacopeia (USP) (100 %) were utilized as IS and as a reference for the ERETIC-2 calibration, respectively. In the experiment, 5 mg of acetanilide and 12 mg of RI76 (fig. 1) were accurately weighed and dissolved in 600 μl of Deuterated dimethyl sulfoxide (DMSO-d6), which was accurately transferred to NMR tubes for evaluating the purity of RI76 [67].
Fig. 1: Chemical structure of the compound RI76 and acetanilide [67]
For the quantitation study, the RI76 signal at 7.76 ppm (doublet, 2H) and the acetanilide reference signal at 2.04 ppm (singlet, 3H) were considered. Purities ranging from 60 to 70 % and relative standard deviation (RSD) 1.91 % were observed. The remaining 30 % of the mass comprises impurities. The study revealed that equivalent results were observed with both IS and ERETIC-2 calibration approaches yield the same result [67].
Quantitative validation of alpha (α) bisabolol:
Validation of α-bisabolol was done by using Varian Mercury 300 MHz and Bruker Avance III 400 MHz spectrometer for quantitation in essential oils of Eremanthus erythropappus which was suitable for most of the samples evaluated (E1, E2, E3, E4, E5, E7, E10 and E11).
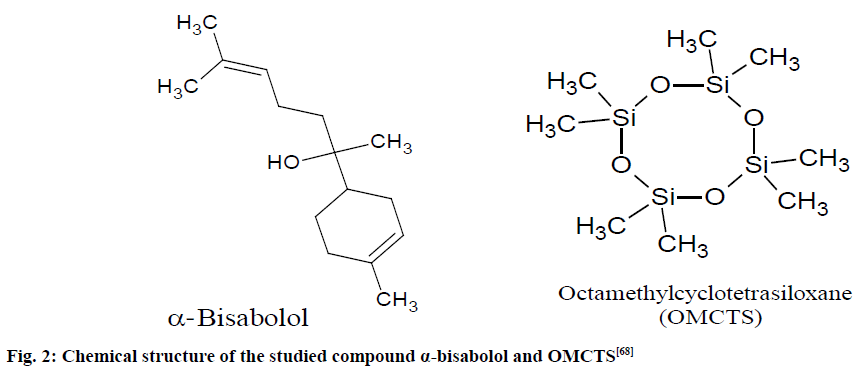
A stock solution of α-bisabolol (105.0 mg/ml) and octamethylcyclotetrasiloxane (OMCTS; 1.9 mg/ml) were prepared to measure linearity, accuracy, precision and stabilities of α-bisabolol and OMCTS in solution (fig. 2).
Fig. 2: Chemical structure of the studied compound α-bisabolol and OMCTS [68]
Taken essential oil comprise of small quantities of other constituents hence the signal at 5.13 and 5.36 ppm of α-bisabolol is not overlapped with signals from the other constituents present in the essential oil. Through the 1H-NMR spectral signals at 5.36 and 5.13 ppm, the Limit Of Detection (LOD) and Limit Of Quantification (LOQ) were observed as 0.26 and 2.59 mg, respectively. The study revealed that purity of α-bisabolol was 95.5 % and RSD or coefficient of variation (CV) was <1.75 %. The method for quantitative validation of α-bisabolol was found rapid, efficient and appropriate [68].
Quantitative validation of α-pinene:
α-Pinene is a natural terpene isolated from Corymbia, Eucalyptus and turpentine oils and its validation was accomplished on Varian Mercury 300 MHz spectrometer which was equipped with a 5 mm 1H-13C dual probe head. The acquisition parameters for the quantitative measurement considered were 16 scans, pulse breadth 45° (pb45), 25 temperature of the samples in the spectrometer, 5 min acquisition time and automatically shimming was carried out.
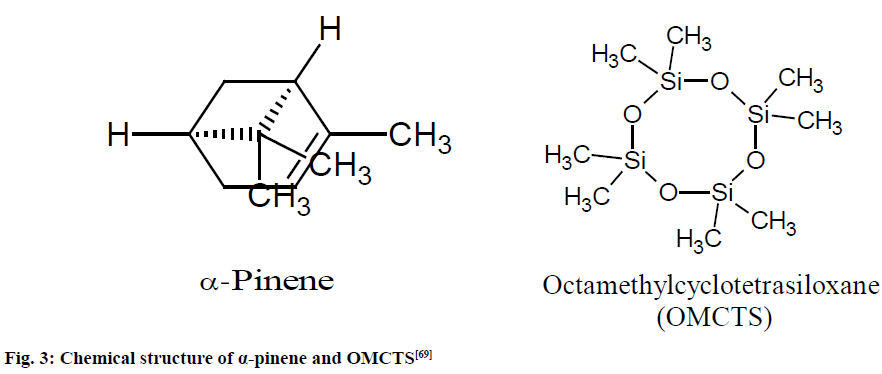
A stock solution of α-pinene (98.0 mg/ml) and OMCTS; 2.2 mg/ml) were prepared in Deuterated chloroform (CDCl3) to determine linearity, robustness and stability of the NMR method (fig. 3). An exact amount (from 22.0 to 46.0 mg) of each essential oil sample was weighed directly into the NMR tube in which 310 μl of the OMCTS stock solution was added.
Fig. 3: Chemical structure of α-pinene and OMCTS [69]
The 1H NMR spectra were observed and the signal of OMCTS at 0.10 ppm was integrated. The signals at 5.17-5.23 ppm were integrated in all samples and the values of the integrations were used to calculate the amount of α-pinene which lies in between 98-102 %. The LOD and LOQ were 0.1 and 2.5 mg, respectively and RSD or CV was observed <0.76 %.
The quantitation method developed by using 1H NMR was adequate for α-pinene quantification from Corymbia and Eucalyptus since various sources of essential oils were successfully measured. The study revealed that method used for quantification of α-pinene was efficient and precise [69].
Quantitative validation of cellulose in tobacco:
Bruker Avance III 400 MHz spectrometer was used in the study for efficient and rapid quantitative validation of cellulose in tobacco which was equipped with 7 mm 1H-13C double resonance MAS probe head. Commercially tobacco samples with inconsistent cellulose content were collected from Guizhou, China.
Evaluation of cellulose in tobacco was done by employing 13C cross polarization/MAS (13C CP/MAS) with following parameters: the initial proton/2 pulses was 5 s, the 90° pulse length, contact time was 2 min for all tobacco sample, the recycle delay was 2 s and the acquisition time was 25 min. Sample cells were cylindrical zirconium-dioxide rotors of 7 mm diameter with silicon tube inserts as an IS and cell spun at 4 kHz. The weight of each tobacco sample was noted during sample loading and ranged from 100 to 300 mg.
13C CP/MAS NMR spectra of tobacco samples were processed with spectral deconvolution to acquire the area of the C-1 resonance at 105.5 ppm and the IS at 0 ppm. The spectra of untreated tobacco sample and standard cellulose are compared.
The results unfolded that the average value for five measurements was 8.62 % with the absolute value of the RSD was <1.49 %. These data suggest that the proposed method can be used for quantitative analysis of cellulose in tobacco with a quite high degree of consistency among the results under the same conduction [70].
Quantitative validation of amygdalin:
Validation of amygdalin content in Persicae semen, Armeniacae semen and Mume fructus were accomplished on JEOL JMN-ECA-500 MHz spectrometer with the following parameters for each sample: 8 scans were recorded with pulse angle 90° and 60 s pulse delay time which was greater than the spin- lattice relaxation time (>5×T1).
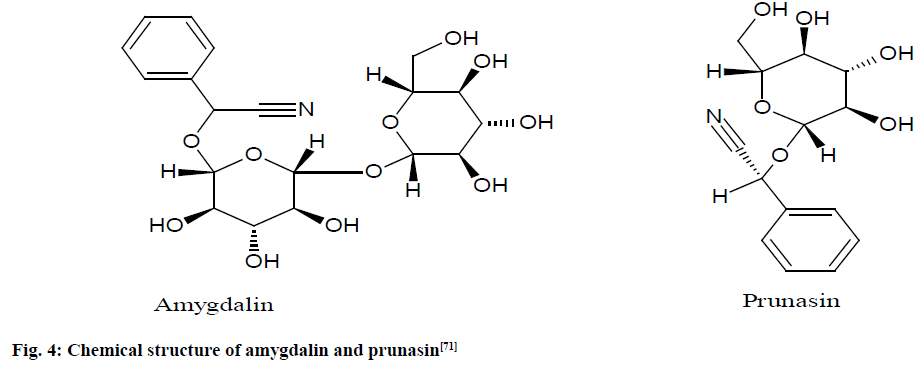
A stock solution of hexamethyldisilane (HMD) (10.0 mg) in pyridine-d5 (10.0 ml) was prepared for quantitative determination of amygdalin (fig. 4) and its concentration was determined using quantitative 1H NMR with reference bisphenol-A (10.0 mg in 1 ml stock solution).
Fig. 4: Chemical structure of amygdalin and prunasin [71]
The amygdalin purity was precisely calculated from the ratio of the intensity of the amygdalin H-2 signal at 6.50 ppm in pyridine-d5 to that of the HMD signal at 0 ppm is shown. The study revealed the amygdalin contents to be 2.72 and 3.13 % in 2 lots of Persicae semen, 0.23 % in Mume fructus and 3.62 and 5.19 % in 2 lots of Armeniacae semen [71].
Quantitative validation of a generic natural product (Ginkgolides):
Validation of complex natural products (Ginkgolide-B and Ginkgolide-A) were completed on Bruker Avance III 400 MHz spectrometer which was equipped with a 5 mm TXI cryoprobe with the following parameters: spin-lattice relaxation times (T1) were measured by an inversion recovery experiment (T1-IR; 12 increments from 50 min to 60 s) for Dimethyl Sulfone (DMSO2) (2.480 s), Dimethyl Sulfoxide (DMSO-d5) (12.658 s) and caffeine (doublet H 8.000 ppm: 2.973 s; doublet H 3.868 ppm: 1.756 s) is shown here.
The caffeine and DMSO2 were used as calibrants for External Calibration (EC) and the residual solvent signal DMSO-d5 was used for Internal Calibration (IC). Samples were prepared by mixing and diluting stock solutions (cDMSO2=24.5 mg/ml; cCaffeine=27.5 mg/ ml) with six different sample concentrations were separately weighed (concentration range 3.3-40.4 mM) into the NMR tubes and dissolved in 0.6 ml DMSO-d5. The DMSO-d5 concentration was evaluated using the calibration curve for y=1 as 65.0 mM (0.54 %).
The spectra represent the highest S/N for the respective window function: (A) Caffeine spectra (H-8) were used in DMSO-d5 (600 MHz), applying exponential multiplication (EM, line broadening factor (LB)=3), Gaussian multiplication (GM, LB=3) and Lorentzian Gaussian multiplication (LG, LB=0.3, GF=0.05) in NMR Utility Transform Software (NUTS). (B) The DMSO-d5 residual solvent signal (J=1.7 Hz) under the same processing conditions as (A).
The spectral region having the H-12 was used for quantitative evaluation of the four terpene lactones exist in the mixture. The ECIC method yielded data that revealed the absolute measurement of Ginkgolide-B as 2.87 mM in a 5.66 mM sample by weight, revealing a purity of only 51.3 %. The data as well allowed for the identification of 0.45 % Ginkgolide-A purity at a S/N of about 13 in the 2.87 mM sample of Ginkgolide-B [72].
Quantitative validation of medicinal plant extracts and herbal products:
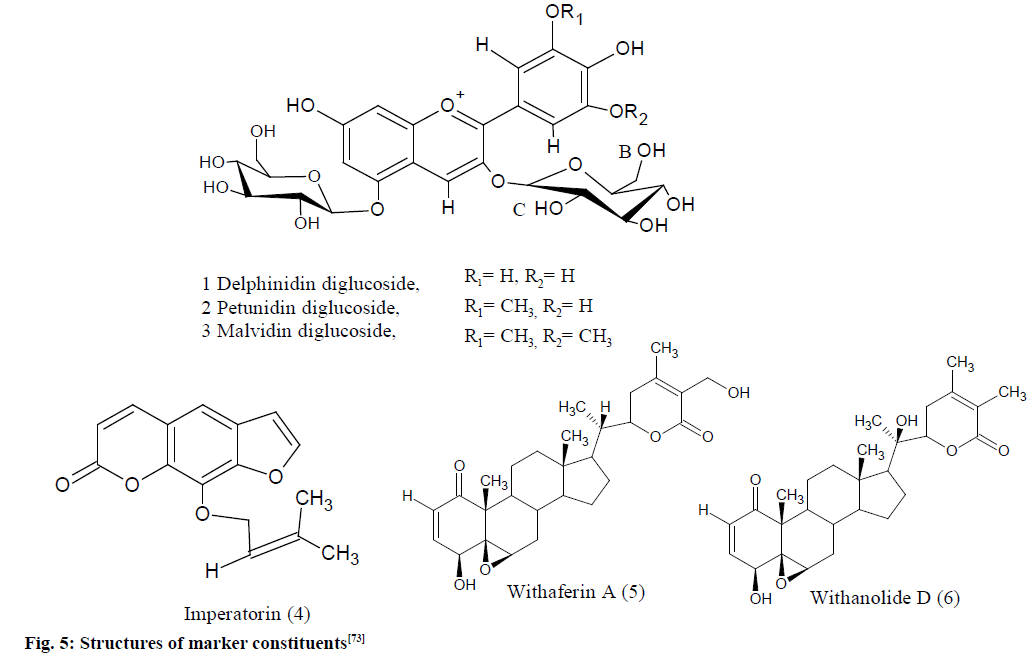
Validation of extracts from medicinal plants Eugenia jambolana (E. jambolana), Aegle marmelos (A. marmelos) and Withania somnifera (W. somnifera) and their herbal products (as mentioned in fig. 5) were done using Bruker Avance III 400 MHz spectrometer which was equipped with a 5 mm multinuclear inverse probe head with the following parameters: pre-acquisition delay of 6 min, acquisition time of 4.0 s, recycle delay of 5.0 s and a flip angle of 30°.
Fig. 5: Structures of marker constituents [73]
1,3,5-Trimethoxybenzene (TMB 1.94, 3.23 mg) was utilized as an IS for evaluation of E. jambolana and A. marmelos, while 2,4-diformyl phloroglucinol (1.42 mg) was utilized for W. somnifera. Both these standards are freely soluble in CDCl3 solvents. TMB had shown two singlets in the spectra, the methoxy proton resonance at d 3.7 and aromatic protons at d 6.09 while 2,4-diformyl phloroglucinol had shown two singlets, for the formyl proton at d 10.05 and for aromatic proton at d 5.89. The reference signals at 9.11, 9.04 and 9.07 for H-4 protons of malvidin, delphinidin and petunidin diglucosides with integrals of 0.37, 0.22 and 0.27, respectively, were utilized for analysis of anthocyanin with the IS, TMB having an integral of 10.0 for three protons of aromatic.
The crude extracts of W. somnifera (IS 2,4-diformyl phloroglucinol) had shown a distinct signal for olefinic proton (H-2) at d 6.19 and for the formyl protons at d 10.05 of 2,4-diformylphloroglucinol. The proton spectra of A. marmelos crude extract (IS, TMB) had also shown a distinct signal for olefinic proton at d 5.61 of imperatorin and for the three aromatic protons at d 6.09 of TMB.
The qH-NMR gave a linear response for the marker constituents, anthocyanins, imperatorin and withaferin-A utilizing the described approach, the amount of anthocyanins in Sephadex enriched extracts and XAD of E. jambolana was 3.77 % and 9.57 % (delphinidin-3,5-diglucoside), 6.55 % and 15.70 % (malvidin 3,5-diglucoside), 4.72 % and 12.0 % (petunidin 3,5-diglucoside), respectively. The imperatorin content was 0.424 % in A. marmelos fruit and 0.090 % and 0.114 % in sharbat and candies. Total with anolides content was 0.191 % in the chloroform extract and 0.234 % in the capsule extract [73].
Quantitative validation of paralytic shellfish toxins (PSTs) and characterization of Gonyautoxin-5 (GTX5) and Gonyautoxin-6 (GTX6):
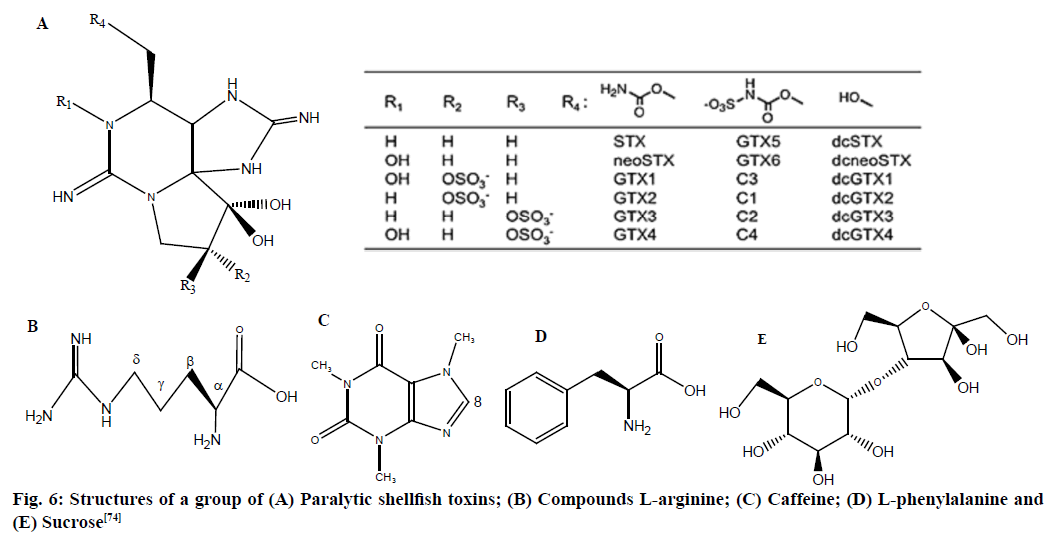
Validation of PSTs were accomplished using INOVA 600 MHz spectrometer which was equipped with 5 mm indirect probe that has 1H coil inside X nuclei coils with the following parameters: acquisition time of 2.2 s, 90° pulse width (9.4 min), 64 transients and relaxation delay time of 11 s. Paralytic shellfish poisoning (PSP) is a human ailment caused by consumption of crabs and shellfish contaminated with PSTs as mentioned in fig. 6.
Fig. 6: Structures of a group of (A) Paralytic shellfish toxins; (B) Compounds L-arginine; (C) Caffeine; (D) L-phenylalanine and (E) Sucrose [74]
Tertiary butanol was used as an IS which was prepared by mixing of tert-butanol/deuterated acetic acid (CD3COOD)/Deuterium Oxide (D2O) with dilution (as 100 µl/1 ml/10 g), for the quantitation validation.
The signal from the mixture tert-butanol, CHD2COOD and deuteroacetic acid (CH3COOD) were observed at 1.24, 2.03 and 2.05 ppm, respectively and the signal of a tert-butanol at 1.24 ppm (singlet, 9H) was used as an IS. The signals around 3.35 and 2.72 ppm might be methanol and impurity, respectively. The LOQ at 5 % RSD was calculated to be 0.16 mM, which corresponded to 67 mg/ml as Saxitoxin (STX) diacetate form, while the LOD was 0.04 mM.
GTX5 and GTX6 isolated from mussels were quantified by method and the toxicities of GTX6 and GTX5 were obtained by the Mouse Bio Assay (MBA) in which mice was standardized by STX. The particular toxicities of GTX6 and GTX5 calculated by the MBA were 105 milli-unit (MU)/mmol (25 mg STX equivalents/mmol) and 120 MU/mmol (29 mg STX equivalents/mmol), respectively [74].
Quantitative validation of the fluoxetine:
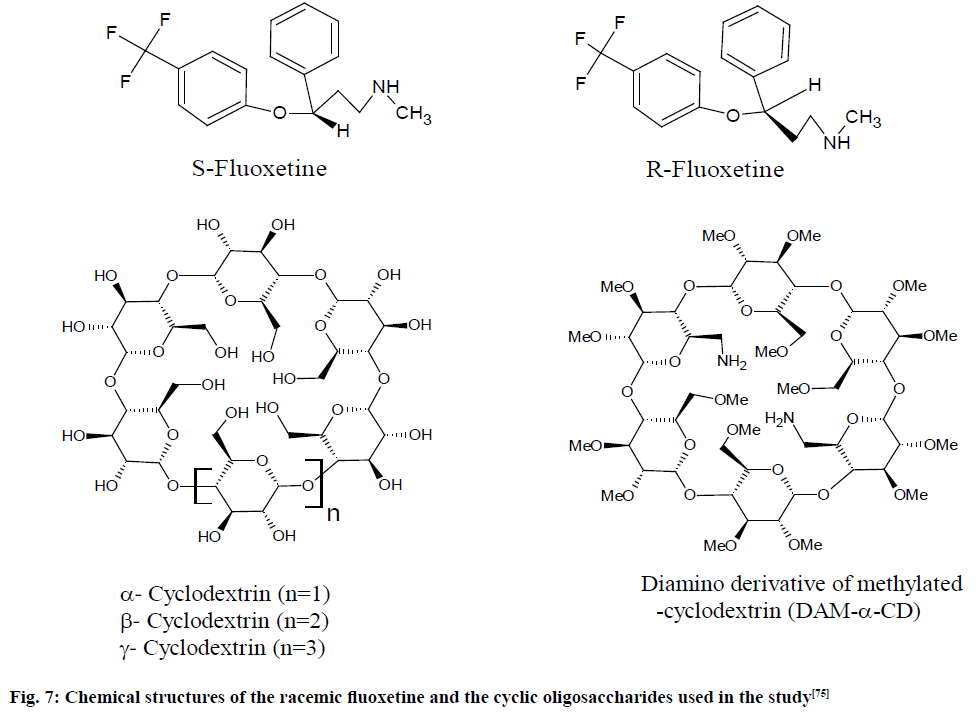
Validation of racemic fluoxetine (S-fluoxetine and R-fluoxetine) were accomplished on Bruker DRX 500 MHz Avance spectrometer which was equipped with a dedicated 5 mm Query Node Patterns (QNP) probe with the following parameters: 90° pulses with 16-64 scans collected and the acquisition time was 0.53 s followed with a relaxation delay of 3.0 s. Quantitative 19F NMR spectroscopy was applied for the evaluation of fluoxetine enantiomers using various chiral recognition agents in pharmaceutical.
The standard stock solutions of sodium fluoride (NaF) used as an IS and racemic fluoxetine (as shown in fig. 7) were prepared in double distilled de-ionized water by weighing 12.5 mg NaF and 25.0 mg fluoxetine. A range of 0.25-3.90 mg of diamino Derivative of Methylated α-Cyclodextrin (DAM-α-CD) was utilized as the suitable chiral selector by dissolving in diluted standard solutions into the NMR tube.
Fig. 7: Chemical structures of the racemic fluoxetine and the cyclic oligosaccharides used in the study [75]
Four Cyclo Dextrins (CDs), specifically α, beta (β), gamma (γ) CD and DAM-α-CD, were utilized for enantio-separation of fluoxetine. Evaluations were performed with solutions containing 0.5 mg/ml fluoxetine and having various concentrations of CDs. The changes detected in the successive 19F NMR spectra of fluoxetine upon addition of the chiral recognitions. The calibration curve was found linear for (R) and (S)- fluoxetine over the range 0.10-1.35 mg/ml, the LOD (S/N=3) being 5.9 and 7.5 µg/ml for the pure (R) and (S)-fluoxetine, respectively.
The correlation coefficients were found >0.9980 for both enantiomers, which suggested a linear response within the studied range of concentration. The LOD was taken as the concentration of analyte where signal-to-noise (S/N)=3 and it was found to be 5.9 and 7.5 g/ml for the pure (R) and (S)-fluoxetine, respectively. The recoveries of (R) and (S)-fluoxetine from pharmaceuticals lie in between 91.2 and 109.6 % in all cases and the obtained RSD values were less than 8 %. The results showed that the method is rapid, accurate and precise [75].
Quantitative validation of fenfluramine, sertraline and paroxetine:
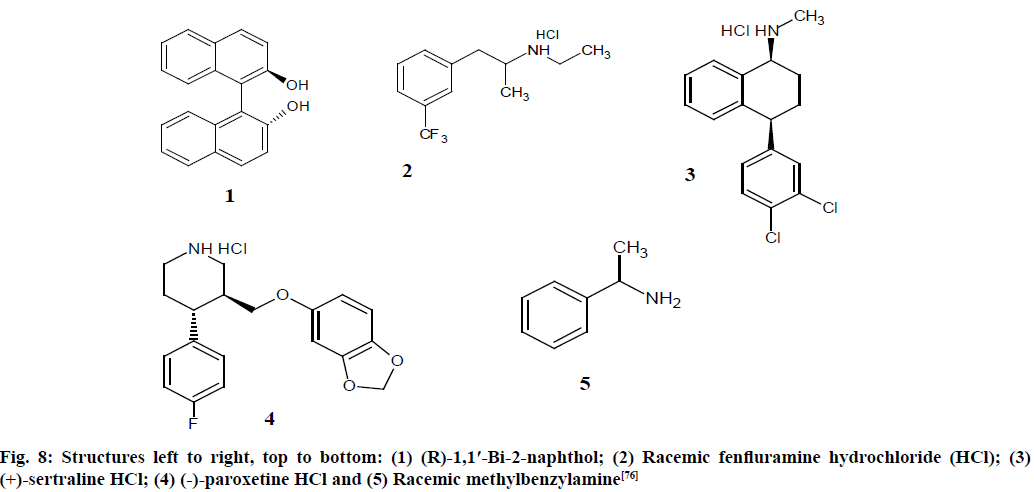
Enantiomeric purity of fenfluramine, sertraline and paroxetine were validated using Bruker 500 MHz Avance spectrometer which was equipped with a 5 mm Broadband Observe (BBO) probe with the following parameters: spectra acquired with 64 transients, 30° pulse with a delay of 1 s and line broadening of 0.30 Hz was used. The evaluation of the enantiomeric purity of three Active Pharmaceutical Ingredients (APIs) were developed using the Chiral Solvating Agent (CSA) (R)-1,1′-Bi-2-naphthol (as shown in fig. 8). Chemical shifts were referenced using internal reference TMS in CDCl3 (99 %) solvent.
Fig. 8: Structures left to right, top to bottom: (1) (R)-1,1′-Bi-2-naphthol; (2) Racemic fenfluramine hydrochloride (HCl); (3) (+)-sertraline HCl; (4) (-)-paroxetine HCl and (5) Racemic methylbenzylamine [76]
Samples were prepared by weighing roughly around 1-4 mg of sample and an appropriate molar ratio of (R)- 1,1′-Bi-2-naphthol (1) was added to induce separation of enantiomers when dissolved in CDCl3 solvent.
The resonance at ~2.15 ppm is due to an impurity in (R)-1,1′-Bi-2-naphthol (1) and at 1.6 ppm is due to water (2) in the spectra. The LOQ is <1 % minor component based on a percent error of <5 % at this level. The enantiomer purity of APIs were found as fenfluramine 50.2 %±0.4 %, sertraline 8.0 %±0.2 % and paroxetine 4.5±0.1 %. Chiral NMR using CSA was revealed to be an alternative or complimentary approach to chiral High-Performance Liquid Chromatography (HPLC) and optical rotation for the evaluation of enantiomeric purity [76].
Quantitative validation of levofloxacin and rifampicin:
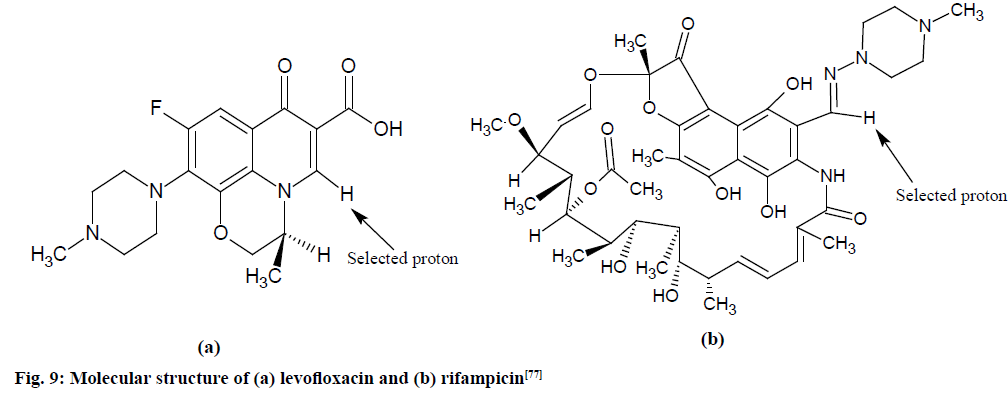
Validation of pure levofloxacin and rifampicin (as shown in fig. 9) and urine’s extracts were done on JEOL-NM-LA 300 MHz, Fourier Transform NMR (FT- NMR) spectrometer with the following parameters: delay time of 1.55 s, 500 free-induction decays (FIDs) were collected for each samples into 32 768 data points using a spectral width of 6009.6 Hz and maintained temperature of 40° throughout.
Fig. 9: Molecular structure of (a) levofloxacin and (b) rifampicin [77]
Spectra of pure drugs and urine’s extracts were acquired and successive quantities of pure rifampicin (0.9 -43.0 mg) or levofloxacin (0.8-54.0 mg) were rigorously mixed with suitable quantities of maleic acid (2.0 -24.0 mg) as IS and dissolved in DMSO-d6.
The spectrum shows doublet at 7.57 and 7.61 ppm could be attributed to the splitting of 5H proton due to the coupling with 19F nucleus at the adjacent position. The spectrum shows the NH and OH protons gave broad signals in between 12.0 and 13.0 ppm. The methoxy group (OCH3) protons at C-37 gave a sharp singlet at 3.04 ppm whereas the methyl group (CH3) at C-13 gave a signal at 1.85. Methylene protons at carbon 4, 5, 7 and 8 gave signals at 2.5-3.3 ppm.
Maleic acid signal at 6.2 ppm was utilized as the reference signal. Integration of signals at 8.2 and 8.9 ppm were utilized for evaluating the concentration of rifampicin and levofloxacin drugs per unit dose, respectively. Recoveries of pure rifampicin and levofloxacin were obtained (98.3-99.7)±1.08 and (97.0-99.4)±0.5 %, respectively and recoveries in urine samples were obtained 96.8-100.0. RSD values <2.7 % were observed for pure drugs and urine samples [77].
Thus, above given examples reflects diverse methodologies used for quantification and validations which provided to be a fast and efficient alternative, providing results with less standard deviation. All evaluated parameters regarding linearity, robustness, specificity, selectivity and accuracy, as well as influences of instrument specific parameters and stability of analyte and IS in solution shown satisfactory results. The various parameters observed in above mentioned examples are given in Table 3.
| Quantitation compound | Residual solvent used (Deuterated) | IS reference used | Quantity utilized for stock solution/reference | Percentage/ RSD found |
|---|---|---|---|---|
| RI76 | DMSO-d6 | Acetanilide (99 %) | Acetanilide (5 mg) and (RI7612 mg) | Observed RSD values was 1.91 % |
| α-Bisabolol | CDCl3-d | OMCTS | α-Bisabolol (105.0 mg/ml) and OMCTS (1.9 mg/ml) | Observed RSD values was <1.75 % |
| α-Pinene | CDCl3-d | OMCTS | α-Pinene (98.0 mg/ml) and OMCTS (2.2 mg/ml) | RSD <0.76 % followed chromatographic methods (SD<2 %) |
| Cellulose in tobacco | As a solid used | Silicon tube | Tobacco sample Ranged from 100 to 300 mg | Observed RSD values was <1.49 % |
| Amygdalin | Pyridine-d5 | HMD | HMD (10.0 mg) and bisphenol-A (10.0 mg in 1 ml stock solution) | Purity was Persicae semen 2.72 and 3.13, Armeniacae semen 3.62 and 5.19 and Mume fructus 0.23 % |
| Ginkgolide-B and Ginkgolide-A | DMSO-d5 | Caffeine and DMSO2 | DMSO2 (24.5 mg/ml) and Caffeine (27.5 mg/ml) | Purity was Ginkgolide-B 51.3 % and 0.45 % for Ginkgolide-A |
| E. jambolan,A. marmelos, and W. somnifera | CDCl3-d | 1,3,5-TMB and 2,4-diformyl phloroglucinol | TMB (1.94, 3.23 mg) and 2,4-diformyl phloroglucinol (1.42 mg) | E. jambolana contents 9.57 % (delphinidin), 15.70 % (malvidin), 12.0 % (petunidin) and imperatorin was 0.424 % in A. marmelos fruit and with anolides was 0.234 % (capsule extract) |
| PSTs | Acetic acid-d4 and water (CD3COOD and D2O) | Tertiary butanol | Tert-butanol/CD3COOD/D2O as 100 µl/1 ml/10 g | Observed RSD value was <5 % in all the cases |
| Fluoxetine | D2O | NaF | NaF (12.5 mg) and fluoxetine (25.0 mg) | Observed RSD values was <8 % |
| Fenfluramine, sertraline and paroxetine | CDCl3-d | TMS | TMS added in µl in CDCl3 | Purity was fenfluramine 50.2 %±0.4 %, sertraline 8.0 %±0.2 % and paroxetine 4.5±0.1 % |
| Rifampicin and levofloxacin | DMSO-d6 | Maleic acid | Maleic acid (2.0-24.0 mg), rifampicin (0.9-43.0 mg) and levofloxacin (0.8-54.0 mg) | Observed RSD values was <2.7 % for pure drugs and urine samples |
Table 3: Observed Parameters from the Mentioned Quantitative Method Validation
Conclusion
NMR spectroscopy has largely given way to the most important routine analyzes of natural synthetic drug candidates and related molecules. Quality control and simultaneous quantification of different residual solvents, analytes and impurities have led analysts to further exploit NMR as a viable quantitative technique. In this review we describe the different qNMR method that is utilized for qualitative, quantitative and purity studies. The validated qNMR methods were simple, robust, precise and selective for determining different natural as well as synthetic drugs sample using several commercially accessible compounds (like TMS, maleic acid, TMB, OMCTS etc.) as IS. Since NMR quantitative analysis is suggested as a USP standard technique, the described methods can be proposed as a standard as International Council for Harmonisation (ICH) tripartite guideline. The different studied examples suggested that obtained values were in concurrence with chromatography results directing that qNMR is as reliable as chromatography-based technique for quantitative analysis.
Conflicts of interest:
The authors declared no conflict of interest.
References
- Bharti SK, Roy R. Quantitative 1H NMR spectroscopy. Trends Analyt Chem 2012;35:5-26.
- Cabeca LF, Pickholz M, de Paula E, Marsaioli AJ. Liposome-Prilocaine interaction mapping evaluated through STD NMR and molecular dynamics simulations. J Phys Chem B 2009;113(8):2365-70.
- Van Halbeek H. NMR developments in structural studies of carbohydrates and their complexes. Curr Opin Struct Biol 1994;4(5):697-709.
- Morris GD. β-NMR. In: ISAC, ARIEL, editors. The TRIUMF radioactive beam facilities and the scientific program. 1st ed. Dordrecht: Springer; 2013. p. 173-82.
- Roberts GC. Applications of NMR in drug discovery. Drug Discov Today 2000;5(6):230-40.
- Brunner DO, De Zanche N, Frohlich J, Paska J, Pruessmann KP. Travelling-wave nuclear magnetic resonance. Nature 2009;457(7232):994-8.
- Jungnickel JL, Forbes JW. Quantitative measurement of hydrogen types by integrated nuclear magnetic resonance intensities. Anal Chem 1963;35(8):938-42.
- Gawrisch K, Eldho NV, Polozov IV. Novel NMR tools to study structure and dynamics of biomembranes. Chem Phys Lipids 2002;116(1):135-51.
- Burns DT, Lewis RJ. Analysis and characterisation of nitroglycerine based explosives by proton magnetic resonance spectrometry. Anal Chim Acta 1995;300(1):221-5.
- Mozzhukhin GV, Kupriyanova GV, Mamadazizov SS, Maraşlı A, Rameev BZ. Low-field 14N nuclear magnetic resonance for detection of dangerous liquids. Chem Phys 2018;513:129-34.
- Kleinberg RL, Horsfield MA. Transverse relaxation processes in porous sedimentary rock. J Magn Reson 1990;88(1):9-19.
- Sahu R, Mishra R, Majee C, Kumar A, Mazumder R. Obeticholic acid: An insight into a quantitative determination and methodological validation through nuclear magnetic resonance. Int J Appl Pharm 2020:179-90.
- Carr RA, Congreve M, Murray CW, Rees DC. Fragment-based lead discovery: Leads by design. Drug Discov Today 2005;10(14):987-92.
- Bonhomme C, Gervais C, Babonneau F, Coelho C, Pourpoint F, Azais T, et al. First-principles calculation of NMR parameters using the gauge including projector augmented wave method: a chemist’s point of view. Chem Rev 2012;112(11):5733-79.
- Pan Z, Raftery D. Comparing and combining NMR spectroscopy and mass spectrometry in metabolomics. Anal Bioanal Chem 2007;387(2):525-7.
- Wells RJ, Hook JM, Al-Deen TS, Hibbert DB. Quantitative nuclear magnetic resonance (QNMR) spectroscopy for assessing the purity of technical grade agrochemicals: 2, 4-dichlorophenoxyacetic acid (2, 4-D) and sodium 2, 2-dichloropropionate (Dalapon sodium). J Agric Food Chem 2002;50(12):3366-74.
- Mahajan S, Singh IP. Determining and reporting purity of organic molecules: Why qNMR. Magn Reson Chem 2013;51(2):76-81.
- Holzgrabe U, Deubner R, Schollmayer C, Waibel B. Quantitative NMR spectroscopy-applications in drug analysis. J Pharm Biomed Anal 2005;38(5):806-12.
- Kupče E. NMR with multiple receivers. In Modern NMR Methodology, editor. 1st ed. Berlin: Springer; 2011. p. 71-96.
- Wells RJ, Cheung J, Hook JM. The use of qNMR for the analysis of agrochemicals. In NMR spectroscopy in pharmaceutical analysis. Elsevier; 2008. p. 291-315.
- Moura S, Carvalho FG, de Oliveira CD, Pinto E, Yonamine M. qNMR: An applicable method for the determination of dimethyltryptamine in ayahuasca, a psychoactive plant preparation. Phytochem Lett 2010;3(2):79-83.
- Bayer E, Albert K, Nieder M, Grom E, Wolff G, Rindlisbacher M. On-line coupling of liquid chromatography and high-field nuclear magnetic resonance spectrometry. Anal Chem 1982;54(11):1747-50.
- Albert K. Liquid chromatography-nuclear magnetic resonance spectroscopy. J Chromatogr A 1999;856(1):199-211.
- Marion D. An introduction to biological NMR spectroscopy. Mol Cell Proteomics 2013;12(11):3006-25.
- Bayer JV, Jaeger F, Schaumann GE. Proton nuclear magnetic resonance (NMR) relaxometry in soil science applications. Open Magn Reson J 2010;3(1):15-26.
- Hamans BC, Andreychenko A, Heerschap A, Wijmenga SS, Tessari M. NMR at earth’s magnetic field using para-hydrogen induced polarization. J Magn Reson 2011;212(1):224-8.
- Purcell EM, Torrey HC, Pound RV. Resonance absorption by nuclear magnetic moments in a solid. Phys Rev 1946;69(1-2):37.
- Gossert AD, Jahnke W. NMR in drug discovery: A practical guide to identification and validation of ligands interacting with biological macromolecules. Prog Nucl Magn Reson Spectrosc 2016;97:82-125.
- Blumich B. Introduction to compact NMR: a review of methods. Trends Anal Chem 2016;83:2-11.
- Korb JP, Freiman G, Nicot B, Ligneul P, inventors; Schlumberger Technology Corp, assignee. Method of determining formation parameter. United States patent, US 9,459,370; 2016.
- Workman J, Koch M, Veltkamp DJ. Process analytical chemistry. Anal Chem 2003;75(12):2859-76.
- Pellecchia M, Sem DS, Wüthrich K. NMR in drug discovery. Nat Rev Drug Discov 2002;1(3):211-9.
- Szantay Jr C, Beni Z, Balogh G, Gati T. The changing role of NMR spectroscopy in off-line impurity identification: a conceptual view. Trends Analyt Chem 2006;25(8):806-20.
- Pauli GF, Jaki BU, Lankin DC. Quantitative 1H NMR: Development and potential of a method for natural products analysis. J Nat Prod 2005;68(1):133-49.
- Simmler C, Napolitano JG, McAlpine JB, Chen SN, Pauli GF. Universal quantitative NMR analysis of complex natural samples. Curr Opin Biotechnol 2014;25:51-9.
- Johnson Jr CS. Diffusion ordered nuclear magnetic resonance spectroscopy: principles and applications. Prog Nucl Magn Reson Spectrosc 1999;34(3):203-56.
- Mandelshtam VA, Taylor HS, Shaka AJ. Application of the filter diagonalization method to one-and two-dimensional NMR spectra. J Magn Reson 1998;133(2):304-12.
- Song YQ. Novel NMR techniques for porous media research. Cem Concr Res 2007;37(3):325-8.
- Mahrous EA, Farag MA. Two dimensional NMR spectroscopic approaches for exploring plant metabolome: A review. J Adv Res 2015;6(1):3-15.
- Michalik M, Hein M, Frank M. NMR spectra of fluorinated carbohydrates. Carbohydr Res 2000;327(1-2):185-218.
- Ross A, Schlotterbeck G, Klaus W, Senn H. Automation of NMR measurements and data evaluation for systematically screening interactions of small molecules with target proteins. J Biomol NMR 2000;16(2):139-46.
- Huang T, Li H, Zhang W, Numata M, Mackay L, Warren J, et al. Advanced approaches and applications of qNMR. Metrologia 2020;57(1):014004.
- Koskela H, Kilpeläinen I, Heikkinen S. Some aspects of quantitative 2D NMR. J Magn Reson 2005;174(2):237-44.
- Lesage A. Recent advances in solid-state NMR spectroscopy of spin I=1/2 nuclei. Phys Chem Chem Phys 2009;11(32):6876-91.
- Ashbrook SE. Recent advances in solid-state NMR spectroscopy of quadrupolar nuclei. Phys Chem Chem Phys 2009;11(32):6892-905.
- Middleton DA, Patching SG. Solid‐state NMR spectroscopy in drug design and discovery. In: Andrushko V, Andrushko N editors. Stereoselective synthesis of drugs and natural products. Wiley Inc; 2013. p. 1-20.
- Fan TW, Lane AN. Applications of NMR spectroscopy to systems biochemistry. Prog Nucl Magn Reson Spectrosc 2016;92:18-53.
- Hanson BE, Lisic EC, Petty JT, Iannaconne GA. Variable-temperature magic-angle-spinning carbon-13 NMR of solid dodecacarbonyltriiron. Inorg Chem 1986;25(22):4062-4.
- Martin RW, Paulson EK, Zilm KW. Design of a triple resonance magic angle sample spinning probe for high field solid state nuclear magnetic resonance. Rev Sci Instrum 2003;74(6):3045-61.
- Takegoshi K, Nakamura S, Terao T. 13C-1H dipolar-assisted rotational resonance in magic-angle spinning NMR. Chem Phys Lett 2001;344(5-6):631-7.
- Blümich B, Blümich, Pauly. Essential NMR. 1st ed. Switzerland: Springer International Publishing; 2019.
- Szantay Jr C, Demeter A. 2.4. NMR spectroscopy. In: Progress in Pharmaceutical and Biomedical Analysis. Elsevier; 2000;4:109-45.
- Bernstein MA, Stefinovic M, Sleigh CJ. Optimising reaction performance in the pharmaceutical industry by monitoring with NMR. Magn Reson Chem 2007;45(7):564-71.
- Malz F, Jancke H. Validation of quantitative NMR. J Pharm Biomed Anal 2005;38(5):813-23.
- Hoult DI, Chen CN, Eden H, Eden M. Elimination of baseline artifacts in spectra and their integrals. J Magn Reson 1983;51(1):110-7.
- Rizzo V, Pinciroli V. Quantitative NMR in synthetic and combinatorial chemistry. J Pharm Biomed Anal 2005;38(5):851-7.
- Elipe MV. Advantages and disadvantages of nuclear magnetic resonance spectroscopy as a hyphenated technique. Anal Chim Acta 2003;497(1-2):1-25.
- Westphal F, Junge T, Rösner P, Sönnichsen F, Schuster F. Mass and NMR spectroscopic characterization of 3, 4-methylenedioxypyrovalerone: a designer drug with α-pyrrolidinophenone structure. Forensic Sci Int 2009;190(1-3):1-8.
- Gottlieb HE, Kotlyar V, Nudelman A. NMR chemical shifts of common laboratory solvents as trace impurities. J Org Chem 1997;62(21):7512-5.
- Fulmer GR, Miller AJ, Sherden NH, Gottlieb HE, Nudelman A, Stoltz BM, et al. NMR chemical shifts of trace impurities: common laboratory solvents, organics, and gases in deuterated solvents relevant to the organometallic chemist. Organometallics 2010;29(9):2176-9.
- Babij NR, McCusker EO, Whiteker GT, Canturk B, Choy N, Creemer LC, et al. NMR chemical shifts of trace impurities: Industrially preferred solvents used in process and green chemistry. Org Process Res Dev 2016;20(3):661-7.
- Hoffman RE. Standardization of chemical shifts of TMS and solvent signals in NMR solvents. Magn Reson Chem 2006;44(6):606-16.
- Kotowycz G, Lemieux RU. Nuclear magnetic resonance in carbohydrate chemistry. Chem Rev 1973;73(6):669-98.
- Walker GS, Ryder TF, Sharma R, Smith EB, Freund A. Validation of isolated metabolites from drug metabolism studies as analytical standards by quantitative NMR. Drug Metab Dispos 2011;39(3):433-40.
- Hatzakis E. Nuclear magnetic resonance (NMR) spectroscopy in food science: A comprehensive review. Compr Rev Food Sci Food Saf 2019;18(1):189-220.
- Klages J, Coles M, Kessler H. NMR-based screening: a powerful tool in fragment-based drug discovery. Mol Biosyst 2006;2(6):318-32.
- Franco PH, Braga SF, de Oliveira RB, César IC. Purity determination of a new antifungal drug candidate using quantitative 1H NMR spectroscopy: Method validation and comparison of calibration approaches. Magn Reson Chem 2020;58(1):97-105.
- Cerceau CI, Barbosa LC, Alvarenga ES, Ferreira AG, Thomasi SS. A validated 1H NMR method for quantitative analysis of α-bisabolol in essential oils of Eremanthus erythropappus. Talanta 2016;161:71-9.
- Cerceau CI, Barbosa LC, Filomeno CA, Alvarenga ES, Demuner AJ, Fidencio PH. An optimized and validated 1H NMR method for the quantification of α-pinene in essentials oils. Talanta 2016;150:97-103.
- Jiang J, Hu Y, Tian Z, Chen K, Ge S, Xu Y, et al. Development of a rapid method for the quantification of cellulose in tobacco by 13C CP/MAS NMR. Carbohydr Polym 2016;135:121-7.
- Tanaka R, Nitta A, Nagatsu A. Application of a quantitative 1 H-NMR method for the determination of amygdalin in Persicae semen, Armeniacae semen, and Mume fructus. J Nat Med 2014;68(1):225-30.
- Gödecke T, Napolitano JG, Rodríguez‐Brasco MF, Chen SN, Jaki BU, Lankin DC, et al. Validation of a generic quantitative 1H NMR method for natural products analysis. Phytochem Anal 2013;24(6):581-97.
- Chauthe SK, Sharma RJ, Aqil F, Gupta RC, Singh IP. Quantitative NMR: an applicable method for quantitative analysis of medicinal plant extracts and herbal products. Phytochem Anal 2012;23(6):689-96.
- Watanabe R, Suzuki T, Oshima Y. Development of quantitative NMR method with internal standard for the standard solutions of paralytic shellfish toxins and characterisation of gonyautoxin-5 and gonyautoxin-6. Toxicon 2010;56(4):589-95.
- Shamsipur M, Dastjerdi LS, Haghgoo S, Armspach D, Matt D, Aboul-Enein HY. Chiral selectors for enantioresolution and quantitation of the antidepressant drug fluoxetine in pharmaceutical formulations by 19F NMR spectroscopic method. Anal Chim Acta 2007;601(1):130-8.
- Salsbury JS, Isbester PK. Quantitative 1H NMR method for the routine spectroscopic determination of enantiomeric purity of active pharmaceutical ingredients fenfluramine, sertraline, and paroxetine. Magn Reson Chem 2005;43(11):910-7.
- Salem AA, Mossa HA, Barsoum BN. Quantitative determinations of levofloxacin and rifampicin in pharmaceutical and urine samples using nuclear magnetic resonance spectroscopy. Spectrochim Acta A Mol Biomol Spectrosc 2005;62(1):466-72.
