- *Corresponding Author:
- Elisabeta Antonescu
Lucian Blaga University of Sibiu, Faculty of Medicine, Sibiu 550169, Romania
E-mail: bety_antonescu@yahoo.com
| Date of Submission | 06 January 2017 |
| Date of Revision | 12 May 2017 |
| Date of Acceptance | 20 January 2018 |
| Indian J Pharm Sci 2018;80(2):268-273 |
This is an open access article distributed under the terms of the Creative Commons Attribution-NonCommercial-ShareAlike 3.0 License, which allows others to remix, tweak, and build upon the work non-commercially, as long as the author is credited and the new creations are licensed under the identical terms
Abstract
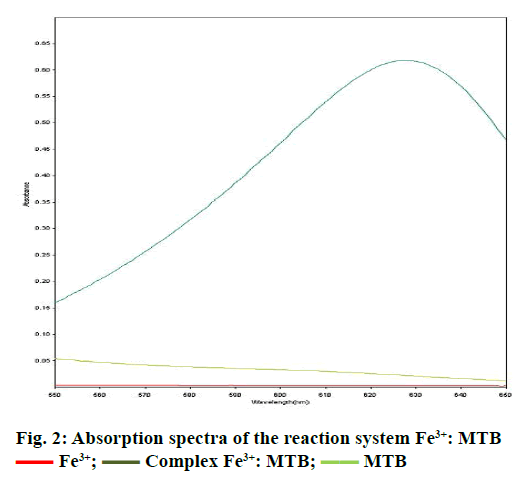
The aim of this investigation was to develop a spectrophotometric method in the visible range for quantitative determination of Fe3+ in a pharmaceutical formulation based on complexation with methylthymol blue. The reaction occurred at a temperature of 30° and the absorbance remains constant after 25-30 min; the blue-colored resulting complex had a maximum absorption at 628 nm. The combination ratio was established through the Job’s method of continuous variations. In acetate buffer (pH=5), Fe3+ forms a complex of 1:1 with methylthymol blue. Lambert-Beer law was obeyed to the concentration area of (2-6) µg/ml; the calibration curve is described by the regression line A= 0.1025° (µg/ml) -0.0013 with a correlation coefficient of R2= 0.9997. For the validation of the method the following parameters were studied, linearity, accuracy, limit of detection, limit of quantification and retrieval. Confidence interval of the average retrieval ranged from 98.79 to 101.13 %. The non-interference of excipients in the solution makes the method suitable for routine dosage of iron in polymaltose complexes. This visible spectrophotometric method was applied to determine Fe3+ concentration in polymaltose iron complex. The validation parameters confirmed that this method could serve to determine Fe3+.
Keywords
Fe3+, methylthymol blue, spectrophotometry, iron polymaltose solution, quantitative
Iron is an essential trace element; the adult human body contains 3-4 g iron [1,2]. Most of it is found in hemoglobin. The most important function of this protein is to transport O2 and CO2 between the lungs and different tissues and to regulate blood pH [3,4]. Iron has various well-established clinical uses, such as the prevention and treatment of iron-deficiency anaemia. The occurrence of iron in two oxidation states (Fe2+, Fe3+), as well as the balance between these two forms are important for the biological systems that use iron in the metabolic processes [5]. Also, iron oxides are materials used as inorganic dyes, pigments for cosmetics and food additives [6,7]. Although various methods have been developed for quantitative determination of iron, spectrophotometry is most frequently used due to multiple advantages such as sensitivity, fidelity, rapidness, simplicity and low cost [8-10].
Kinetic methods based on catalytic reactions for iron determination (in traces) have been applied because they present high sensitivity and the procedures and equipment are relatively simple [11,12]. In the field of pharmaceutical analysis, an important element is the determination of metal ions. There are sensitive and selective methods for their determination, but they have the disadvantage of involving expensive instruments [13]. Several analytical methods have been developed for quantitative analysis of iron. These include spectrophotometry [14-16], flux injection analysis [17], voltammetry [6,18], chromatography [12], capillary electrophoresis, atomic absorption and emission spectrometry [11].
Materials and Methods
Spectrophotometer UV/Vis T80, 190-800 nm. Software UV Win5, version 5.0.5, pH-meter Mettler Toledo with combined electrode, Analytical balance MS 105 DU/M, Mettler Toledo. Standard FeCl3 (Merck, Germany), sample solution of iron (III) polymaltose solution (50 mg/l), concentrated hydrochloric acid and concentrated nitric acid (Merck, Germany), methylthymol blue (MTB, Merck, Germany) were used.
Preparation of samples
All solutions were prepared from chemical reagents of analytical purity. Acetate buffer solution (1 M) was prepared from glacial acetic acid and sodium acetate (pH= 5). Stock solution of Fe3+ was prepared by weighing the amount of FeCl3 (0.8125 g) corresponding to 5×10⁻³ mol in a 100 ml volumetric flask, dissolved in double-distilled water (solution A). Stock solution B was prepared by diluting 0.4 ml of solution in a 50 ml volumetric flask, then it was filled to the mark with buffer solution pH= 5.
Stock solution MTB was prepared by weighing an amount of MTB (3.22389 g) corresponding to 5×10⁻³ mol in a 100 ml volumetric flask, dissolved in double-distilled water (solution C). 0.4 ml is taken from this solution and diluted with buffer solution pH= 5 in a volumetric flask at 50 ml (solution D). Calibration solutions were prepared through the dilution of stock solutions in 50 ml volumetric flasks. Sample stock solutions (0.005 M): Fe3+ sample solutions were prepared from polymaltose iron solution (1 ml sample contains 50 mg polymaltose iron).
Sample stock solution was prepared by measuring with precision 1 ml of polymaltose iron solution and boiling it for 5 min in a water bath in the presence of concentrated HNO3 (1 ml) and concentrated HCl (5 ml). After cooling, the solution obtained was quantitatively transferred in a 100 ml volumetric flask and the volume was made up to the mark with double-distilled water. An aliquot of 0.4 ml was taken from this solution and diluted with pH= 5 buffer solution in a volumetric flask at 50 ml. All solutions were prepared daily.
Spectral recording
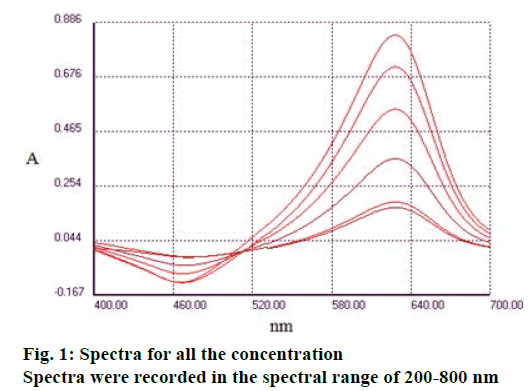
Spectra were recorded in the spectral range of 200-800 nm (Figure 1). The analysis of UV/Vis spectra of Fe3+, MTB and Fe3+:MTB complex solutions revealed that only the Fe3+:MTB complex was absorbed at 628 nm (Figure 2).
Combination ratio
Isomolar solutions were used for establishing the combination ratio. Job's [10] method was used, in which the complex combination is formed between Fe3+ and MTB. Eleven series of solutions were prepared, which contained a volume V1 ml of metallic cation solution (with mole fractions between 0 and 1), a volume V2 ml of added solution (with mole fraction between 1 and 0), where V1+V2= constant.
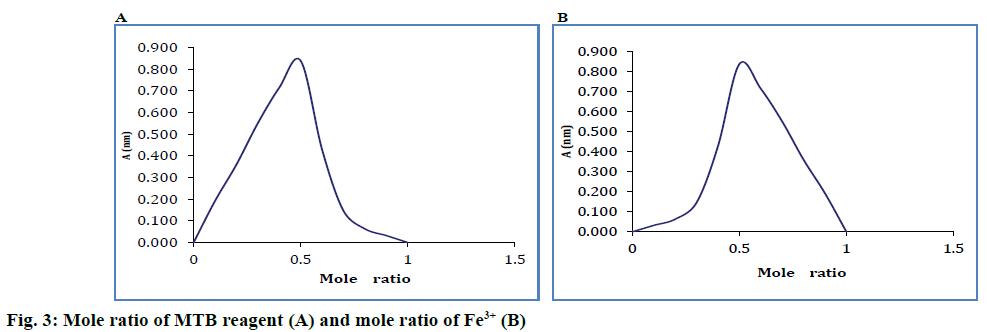
Sample absorbencies were determined at 628 nm against a blank solution containing all reagents except for Fe3+ ions. The data obtained were used for the graphic representation of the absorbance against the mole fraction. Absorbencies were graphically represented according to the respective reagent mole fraction of the metallic cation. The combination ratio was 1:1. Job's curves are shown graphically-absorbance variation measured at the maximum of the spectrum for the complex 1:1, absorbance according to the mole ratio of the reagent and the mole ratio of the cation (Figure 3).
Formation kinetics of the Fe3+:MTB complex
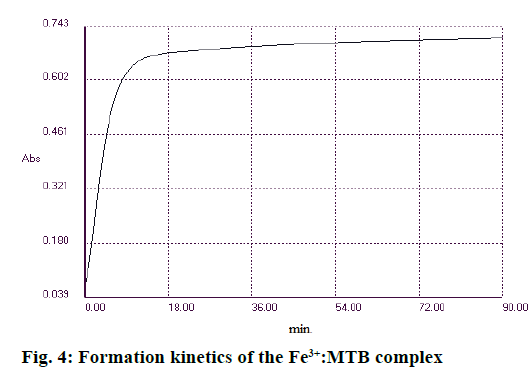
In order to find optimal complex formation conditions, the influence of pH, buffer concentration, reaction time and temperature were monitored separately. The absorption spectre of the complex at different pH levels of 3.6, 5 and 6 was aimed at. Similarly, concentration of the buffer solution (0.1, 0.5, 1 and 2 M) at different temperatures (25, 30 and 37°) was monitored. The optimum conditions for the reaction to occur were, pH 5, buffer solution (1 M), minimum reaction time of 25-30 min and a temperature of 30°. The absorbance remained constant for 90 min (Figure 4).
Quantitative determination
After establishing the conditions for the formation of the complex (pH, buffer concentration, reaction time, temperature) series of solutions were prepared containing equal standard/sample volumes and MTB; they were kept at 30° in water bath for 30 min. Absorbencies of the sample (As) and absorbencies of the standard (Ast) were measured at 628 nm. The quantity of Fe3+ in pharmaceutical formulation (M iron) was calculated according to the dilutions performed with the following Eqn., M iron = 25 000×As×Cst/Ast (mg/ml), where, 25 000 is the dilution coefficient, As- absorbance of the sample, Cst- concentration of the standard (mg/ml), Ast- absorbance of the standard.
Results and Discussion
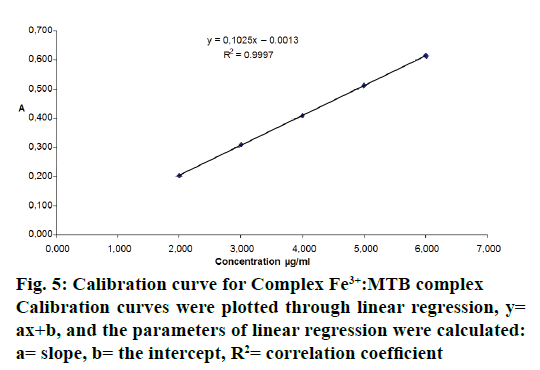
Validation was performed according to the guidelines of ICH Q2(R1) [19]. The linearity of the visual spectrophotometric method was checked by means of the calibration line method. The calibration line consisted of five points and it was computed in Microsoft Excel. The calibration curve obtained by applying the spectrophotometric method in the visual was linear regarding the studied concentration ranges. Calibration curves were plotted through linear regression, y= ax+b, where y represents the absorbance and x is the concentration (μg/ml). The parameters of linear regression were calculated: a= slope, b= the intercept, R2= correlation coefficient (Figure 5).
In order to study the linearity and accuracy, five samples were prepared with the following concentration levels i.e. 60, 80, 100, 120 and 140 %. The calibration curve obtained by applying the spectrophotometric method in the Vis is linear on the 2-6 μg/ml concentration range. Within this interval, the correlation coefficient had the value of 0.9997. Also, for determining the linearity of the method, other parameters were evaluated, such as, the homogeneity of variances, the existence of a significant slope, the validation of regression lines and the comparison of intercepts with 0. Table 1 presents the statistical parameters that were evaluated for determining the linearity of the spectrophotometric method.
| Parameter - Fe3+ | Standard values | Pharmaceutical formulation | Theoretical values | Test-imposed conditions |
|---|---|---|---|---|
| Correlation coefficient | 0.9997 | 0.9981 | - | - |
| Intercept | –0.00128 | –0.0018 | - | - |
| Slope | 0.1025 | 0.1657 | - | - |
| Cohran test-homogeneity variances | C= 0.2803 | C= 0.54 | Ctheoretical= 0.68 | C<Ctheoretical |
| Fisher test-significant slope | F= 54150.29 | F= 43625.16 | Ftheoretical= 4.67 | F>Ftheoretical |
| Fisher test-regression line validity | F= -3.22 | F= -2.94921 | Ftheoretical= 3.71 | F<Ftheoretical |
| Student test-comparison of the intercept with 0 | t= 1.4773 | t= 1.530 | ttheoretical= 2.16 | - |
| Student test-comparison of the slopes of regression lines | - | t= 0.321 | ttheoretical= 2.056 | t<ttheoretical |
| Student test-comparison of the intercepts | - | t= -0.851 | ttheoretical= 2.056 | t<ttheoretical |
Table 1: The statistical parameters for determining the linearity of the spectrophotometric method
Correlation coefficient is 0.9997 (Table 1) and the Student test-intercept presented t<ttheoretical in both cases (standard and pharmaceutical formulation) for Fe3+. The variances of the five groups of determinations (k= 5) need to be homogeneous for a probability of error of 5 % for the calibration line. This was checked through the application of the Cohran test. Table 1 showed that Ccalculated= 0.280 is lower than Ctheoretical= 0.540; variances are considered homogeneous. The existence of a significant slope was verified with the help of the Fisher statistical test. The value Fcalculated= 43625.16 is higher than the value Ftheoretical= 4.67; the regression line presents significant slope. The validation of the regression line was verified through the application of the Fisher test, where Fcalculated= – 2.94 is lower than Ftheoretical= 3.71; the regression line for the analysis of the Fe3+ standard is valid.
The comparison of the intercepts with 0 was carried out by means of the Student t test. The calibration line can be used in quantitative calculations if the intercept differs considerably from 0. If it does not differ significantly from 0, the 100 % standard solution will be used as reference (the sample contains the analyte in the expected concentration).
Accuracy shows how close the results obtained are to the reference values. The accuracy of the method was verified for the whole range of linearity and for all the five levels of concentration. The absorbance represents the average of three determinations for each concentration level. The results presented in Table 2 showed that accuracy was 98.79-101.13 %.
| Parameter - Fe3+ | Calculated values | Theoretical values | Test-imposed conditions |
|---|---|---|---|
| Cohran test-homogeneity of in-group variances | C= 0.45 | Ctheoretical= 0.69 | C<Ctheoretical |
| Fisher test-validity of the average results | F= 0.89 | Ftheoretical= 3.48 | F<Ftheoretical |
| Confidence interval of the average found | 98.79-101.13 | - | - |
Table 2: The accuracy of the spectrophotometric method
For determining accuracy, the homogeneity of ingroup variances (the Cohran test) and the validity of the average found were evaluated. The interpretation of the values obtained for these parameters is done by comparing the calculated values to the theoretical ones. The method is considered exact if in-group variations are homogenous Ccalculated<Ctheoretical (0.45<0.69). The validation of the average found is done by means of the Fisher test (the comparison of in-group errors to intergroup errors). The validation of the repeatability of the method was performed on different days, on six samples that had been individually prepared (pharmaceutical formulation), situated at a concentration level of 100 % (Table 3).
| Retrieval % | |||
|---|---|---|---|
| 1 d | 2 d | 3 d | |
| l= 628 nm | l= 628 nm | l= 628 nm | |
| Concentration level : 100 % | 99.105 | 99.231 | 100.087 |
| 99.180 | 99.368 | 99.889 | |
| 100.100 | 99.456 | 98.890 | |
| 99.874 | 99.869 | 99.880 | |
| 100.120 | 100.062 | 98.988 | |
| 99.980 | 99.935 | 100.100 | |
| Mean | 99.7265 | 99.653 | 99.639 |
| Standard deviation | 0.462 | 0.344 | 0.551 |
| Relative Standard deviation (%) | 0.463 | 0.345 | 0.553 |
Table 3: The fidelity of the spectrophotometric method
Table 4 presented the fidelity of the spectrophotometric method-results and statistical evaluation. The Cohran test was applied for verifying the in-group variances of results in order to study the fidelity of the method. For the in-group variances to be homogenous Ccalculated needs to be lower than Ctheoretical. In this case, Ccalculated= 0.39˂Ctheoretical= 0.68, so in-group variances were considered homogenous for the spectrophotometric method. The variation quotients corresponding to the two precisions were also calculated. The analytical method could be considered precise if the variation coefficients values were below 2 %, so the method could be considered precise, the repeatability variation coefficient CVr= 0.51 % and the reproducibility variation coefficient CVR= 1.42 % for the error probability taken into consideration. In conclusion, the developed UV spectrophotometric method (λ= 628 nm) was validated and proved to be linear, exact and precise and it can be used for the quantitative determination of iron in pharmaceutical formulations. The limit of detection (LOD) and the limit of quantification (LOQ) were evaluated on the basis of signal to noise ratio. The values obtained within the study are presented in Table 5. LOD= 3×Scmin/a, where: Scmin= represents the standard deviation of ground level concentration, a= slope of the calibration. LOQ= 10×Scmin/a, where: Scmin= represents the standard deviation of ground level concentration, a= slope of the calibration. Table 5 presents the LOD and the LOQ for determining Fe3+.
| Parameter - Fe3+ | Calculated values, % | Test-imposed conditions |
|---|---|---|
| Cohran test-homogeneity of variances | C= 0.39 | C<Ctheoretical |
| Repeatability/reproducibility variation coefficient | 0.51/2.42 | - |
Table 4: The fidelity of the spectrophotometric method statistical evaluation
| Analyte | SCMIN | A | LOD (µg/ml) | LOQ (µg/ml) |
|---|---|---|---|---|
| Fe3+ | 0.0012 | 0.1025 | 0.0351 | 0.1170 |
LOD: limit of detection and LOQ: limit of quantification
Table 5: The limit of detection and quantification for determining Fe3+
The non-interference of excipients in the solution made the method suitable for routine dosage of iron in polymaltose complexes. Visual spectrophotometry also allowed for quantitative determination of Fe3+ in pharmaceutical formulations, which represented the main aim of the study performed. The Fe3+:MTB complex presents a combination ratio of 1:1 and displays corresponding stability.
The visual spectrophotometric method developed and validated in this way was applied for Fe3+ dosage in polymaltose iron complexes. The validation of the visual spectrophotometric method for the determination of Fe3+ in iron polymaltose solution was carried out through the study of the following parameters: linearity, accuracy, repeatability and reproducibility. The validation parameters confirm the applicability of the method with the pursued aim. The method proposed is simple, adequate for laboratory practice and it has been successfully used for quantitative determination of polymaltose iron in commercial pharmaceutical products.
Conflicts of interest
There are no conflicts of interest.
Financial support and sponsorship
Nil.
References
- Fuqua BK, Vulpe CD, Anderson GJ. Intestinal iron absorption. J Trace Elem Med Bio 2012;26:115-19.
- de Montalembert M, Bresson JL, Brouzes C, Ruemmele FM, Puy H, Beaumon C. Exploration d’une anémie microcytaire chez l’enfant. Arch Pediatr 2012;19:295-304.
- Hasani M, Rezaei A, Abdollahi H. Kinetic spectrophotometric determination of Fe (II) in the presence of Fe (III) by H-point standard addition method in mixed micellar medium. Spectrochim Acta A Mol Biomol Spectrosc 2007;68:414-19.
- Hussain F, Arayne MS, Sultana NAJMA. Spectrophotometric method for quantitative determination of iron (III) from iron polymaltose complex in pharmaceutical formulations. Pak J Pharma Sci 2006;19:299-303.
- Thabit Al-Ghabsha S, Amal Saeed M, Usra Al-Neaimy I. Spectrophotometric assay of iron (II) in pharmaceutical formulation using Alizarin Red Sulphonate reagent. J Edu Sci 2012;25:1-10.
- Merli D, Profumo A, Dossi C. An analytical method for Fe (II) and Fe (III) determination in pharmaceutical grade iron sucrose complex and sodium ferric gluconate complex. J Pharm Anal 2012;2:450-3.
- Tanaka Y, Ueyama H, Ogata M, Daikoku T, Morimoto M, Kitagawa A, et al. Evaluation of nanodispersion of iron oxides using various polymers. Indian J Pharm Sci 2014;76:54-61.
- Ahmed MJ, Roy UK. A simple spectrophotometric method for the determination of iron (II) aqueous solutions. Turk J Chem 2009;33:709-26.
- Devi OZ, Basavaiah K, Ramesh PJ, Vinay KB. Simple and sensitive UV spectrophotometric methods for determination of famotidine in tablet formulations. Farmacia 2011;59:647-58.
- Singh CL, Singh A, Kumar S, Kumar M, Sharma PK, Majumdar DK. Development and validation of different ultraviolet-spectrophotometric methods for the estimation of besifloxacin in different simulated body fluids. Indian J Pharm Sci 2015;77:399-404.
- Bagherian G, Chamjangali MA, Berenji Z. Determination of iron (II) in pharmaceuticals based on its catalytic effect on the bromate-crystal violet reaction by spectrophotometric detection. Eurasian J Anal Chem 2009;4:285-93.
- Pradhan KK, Mishra US, Patnaik S, Panda CK, Sahu KC. Development and validation of a stability-indicating UV spectroscopic method for Candesartan in bulk and formulations. Indian J Pharm Sci 2011;73:693-6
- Alula MT, Mohamed AMI, Bekhit AA. Simultaneous spectrophotometric determination of iron (II) and copper (II) in tablets by chemometric methods. Thai J Pharm Sci 2010;34:93-106.
- Garole DJ. Application of UV spectrophotometric method for estimation of iron in tablet dosage form. Int J Pharm Tech Res 2012;4:309-10.
- Chanda SA, Tuhin TI, Muslim T, Rahman MA. Estimation of iron and metronidazole content from respective oral dosage forms available in local market. Dhaka Univ J Sci 2012;60:289-90.
- Hoshino M, Yasui H, Sakurai H, Yamaguchi T, Fujita Y. [Improved spectrophotometric determination of total iron and iron(III) with o-hydroxyhydroquinonephthalein and their characterization]. Yakugaku Zasshi 2011;131:1095-101.
- Kukoc-Modun L, Radic N. Flow injection spectrophotometric determination of tiopronin based on coupled redox-complexation reaction. Chem Aanal-Warsaw 2009;54:871.
- Al-Ghamdi AF. A study of adsorptive stripping voltammetric behavior of ofloxacine antibiotic in the presence of Fe (III) and its determination in tablets and biological fluids. J Saudi Chem Soc 2009;13:235-41.
- https://www.ich.org/fileadmin/Public_Web_Site/ICH_Products/Guidelines/Q uality/Q2_R1/Step4/Q2_R1__Guideline.pdf.
 Fe3+;
Fe3+;  Complex Fe3+: MTB;
  MTB
MTB