- *Corresponding Author:
- S. Kumar
Department of Pharmaceutical Sciences and Drug Research, Punjabi University, Patiala-147 002, India
E-mail: thakur_pu@yahoo.com
| Date of Submission | 30-Sep-2015 |
| Date of Decision | 03-Mar-2016 |
| Date of Acceptance | 26-Apr-2016 |
| Indian J Pharm Sci 2016;78(2):287-290 |
Abstract
Abies pindrow Royle (Himalayan Fir; Pinaceae) has been traditionally used in the treatment of various ailments and reported to contain cyclic polyols as major class of phytoconstituents. But no work has ever been carried out to standardize A. pindrow on the basis of cyclic polyols. Thus, it was considered worthwhile to determine quantitatively contents of main cyclic polyols, i.e., shikimic acid and pinitol in A. pindrow aerial parts using TLC densitometry. Shikimic acid and pinitol were resolved on TLC plates using solvent systems – chloroform:methanol:formic acid (14:6:1) and chloroform:methanol (3:2) respectively. The shikimic acid and pinitol were derivatized with anisaldehyde-sulphuric acid reagent and ammonical silver nitrate reagent respectively. The spots of shikimic acid and pinitol were visualized by heating derivatized plates. The plates were then scanned in TLC scanner at 500 nm. The contents of shikimic acid and pinitol were estimated to be 0.0511% and 0.0987% w/w, respectively, in A. pindrow aerial parts. The developed TLC densitometric methods for estimation of cyclic polyols in A. pindrow aerial parts were found to be precise, accurate and specific on the basis of validation parameters.
Keywords
Abies pindrow, Pinitol, Shikimic acid, TLC densitometry.
Abies pindrow Royle (Silver Fir; family: Pinaceae) is an Indian traditional plant, which is distributed throughout Western Himalayas [1]. The plant has long history of use as anxiolytic, analgesic, antidiabetic and antiinflammatory [2]. The traditional uses of A. pindrow have been validated by scientific studies, but these studies employed crude uncharacterized extracts [3-5]. Sporadic phytochemical work has been carried out on the plant. Chalcone glycosides, flavonoids, fatty acids, hydrocarbons and terpenoids have been isolated from A. pindrow [6-9]. As the case with most plant drugs, A. pindrow has not been standardized on the basis of marker compounds. Marker-based standardization is important for reproducibility of therapeutic efficacy and safety of the plant. High Performance Thin Layer Chromatography (HPTLC) has gained popularity in standardizing plants by estimating the content of, preferably, bioactive constituents. Thus, the present investigation was undertaken to estimate the contents of two main cyclic polyols constituents of A. pindrow using TLC densitometry.
Abies pindrow aerial parts were manually collected from Gulaba Kothi, region of Manali, Himachal Pradesh, India in September, 2012. Identity of the plant was confirmed by Dr. Sunita Garg, Chief Scientist and Head, Raw Materials Herbarium and Museum, National Institute of Science Communication and Information Resources (NISCAIR), New Delhi (Reference no. – NISCAIR/RHMD/Consult/ 2013/2242/23, dated 21/05/2013).
Methanol, chloroform (E-Merck, Delhi, India), and formic acid (Ranbaxy Laboratory Chemicals, Mumbai, India), of AR grade, sulphuric acid, glacial acetic acid (E-Merck Ltd., Mumbai), sodium hydroxide, silver nitrate, ammonia solution and anisaldehyde (S.D. Fine Chemicals, Mumbai) were used in present investigations. Shikimic acid and pinitol, isolated from A. pindrow aerial parts, were used as marker compounds. The isolated compounds have been characterized by 1HNMR and 13CNMR spectral analysis.
The stock solutions of marker compounds were prepared by separately dissolving accurately weighed 5 mg of each compound in 5 ml of methanol. The coarsely powdered plant material, 10 g of aerial parts, was exhaustively extracted with methanol in a Soxhlet apparatus. The methanol extract was filtered, concentrated under reduced pressure and reconstituted to 25 ml with methanol.
The methanol extract and shikimic acid (10 μl each) were applied on pre-coated TLC plate (E Merck, Mumbai, India; 0.2 mm; aluminum base) using CAMAG Linomat 5 applicator. The plate was developed using the solvent system- chloroform:methanol:formic acid (14:6:1) in a CAMAG TLC chamber, saturated for 10 min, to a distance of 8 cm. The plate was dried and then derivatized by spraying with 0.5 % anisaldehyde-sulphuric acid reagent. The spots were observed on TLC plate after heating at 110° for 2 min. Similarly, TLC plate of methanol extract with pinitol was developed using solvent system, chloroform:methanol (3:2). The plate was dried and visualized after derivatization by spraying with ammonical silver nitrate reagent followed by heating at 110° for 2 min.
The stock solution of each marker compound was diluted separately with methanol to get six dilutions of different concentrations (0.3, 0.4, 0.5, 0.6, 0.7 and 0.8 mg/ml). Each dilution (10 μl) was loaded on precoated TLC plate. The plates were developed, derivatized in similar manner as mentioned above and scanned in TLC scanner at 500 nm. The area under the curve (AUC) of the peak corresponding to marker compound was noted in each track.
A fixed volume, 10 μl, of test solutions prepared from methanol extract was loaded in triplicate on two separate pre-coated TLC plates (5×10 cm). The plates were developed separately using respective solvent systems for shikimic acid and pinitol. The AUC of the peak corresponding to shikimic acid and pinitol was noted at 500 nm in the methanol extract. The content of each marker compound in the plant was calculated from the regression equations of the respective standard plots.
The developed methods were validated for the parameters described in ICH guidelines such as linearity, range, limit of detection (LOD), limit of quantification (LOQ, inter day precision, intra-day precision, accuracy, repeatability and specificity [10].
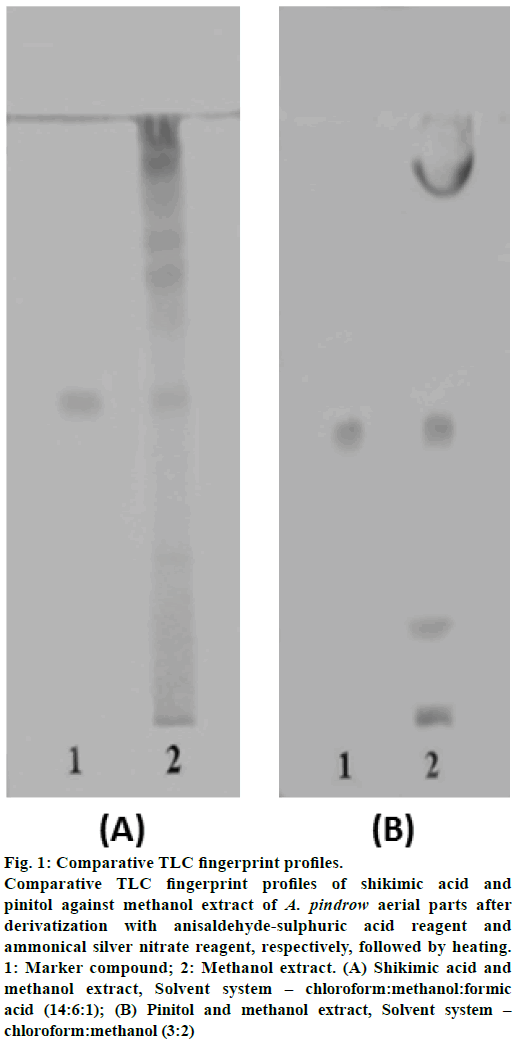
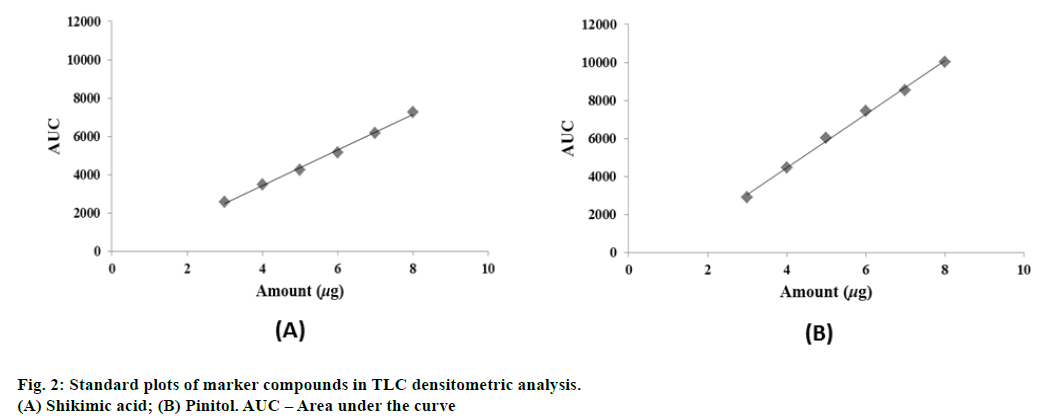
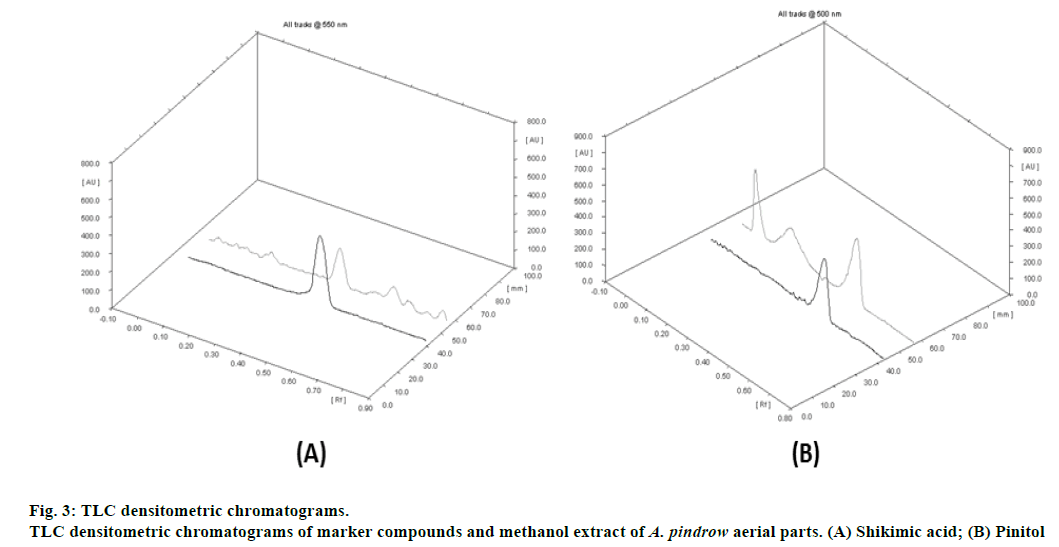
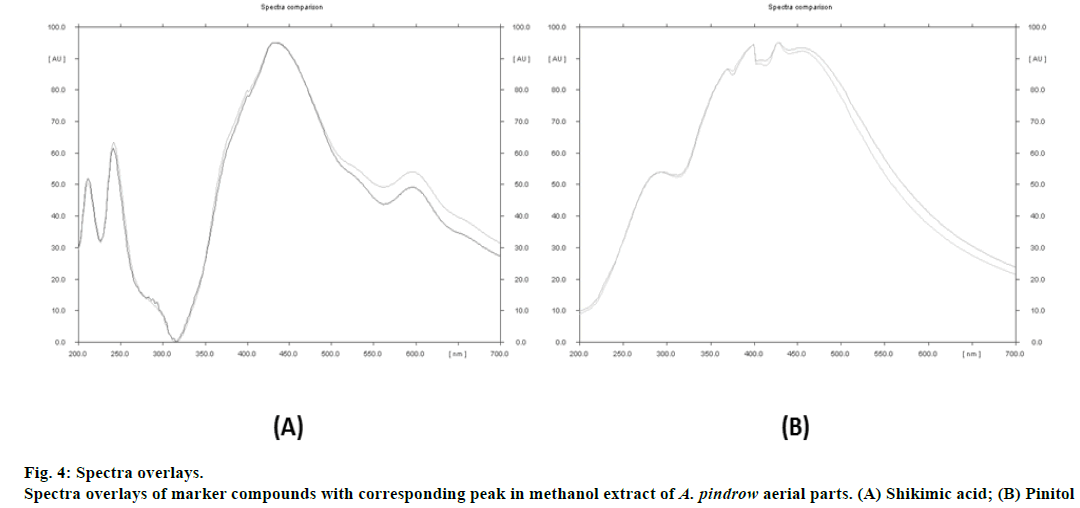
TLC fingerprint profiles of shikimic acid and pinitol against methanol extract are shown in fig. 1. Standard plots were prepared between different concentrations of shikimic acid and pinitol versus their peak areas (fig. 2). The quantitative determination of shikimic acid and pinitol was made (in triplicate) from the regression equations of their respective standard plots. The regression equation for shikimic acid was y = 924.34x - 259.55 and for pinitol was y = 1406.4x - 1167.9. The contents of shikimic acid and pinitol in A. pindrow aerial parts were found to be 0.0511±0.00000% and 0.0987±0.00001% w/w, respectively. The results have been expressed as mean±S.D. ICH guidelines have been followed to validate TLC densitometric methods developed for estimation of shikimic acid and pinitol. The instrumental precision, repeatability, linearity range, coefficient of determination (r2), intra-day precision, inter-day precision, LOD, LOQ and accuracy of marker compounds are shown in Table 1. The ultraviolet spectra and thin layer chromatogram overlays of standard compounds and sample did not show any interference in quantitative analysis of TLC densitometric methods for estimation of shikimic acid and pinitol (fig. 3 and 4).
| Parameter | Shikimic acid | Pinitol |
|---|---|---|
| Instrumental precision (% CV, n=7) | 0.55 | 0.52 |
| Repeatability (% CV, n=5) | 0.64 | 0.25 |
| Linearity (coefficient of determination) |
0.996 | 0.996 |
| Range (ng) | 3000-8000 | 3000-8000 |
| LOD (ng) | 400 | 300 |
| LOQ (ng) | 1100 | 1000 |
| Intra-day precision (% CV, n=9) | 0.91 | 1.01 |
| Inter-day precision (% CV, n=9) | 1.71 | 1.61 |
| Accuracy (average % recovery±S.D., n=3) |
98.71±0.66 | 99.18±0.39 |
| Specificity | Specific | Specific |
Table 1: Method validation parameters in TLC-Densitometric analysis of markers in A. Pindrow aerial parts
Fig. 1: Comparative TLC fingerprint profiles. Comparative TLC fingerprint profiles of shikimic acid and pinitol against methanol extract of A. pindrow aerial parts after derivatization with anisaldehyde-sulphuric acid reagent and ammonical silver nitrate reagent, respectively, followed by heating. 1: Marker compound; 2: Methanol extract. (A) Shikimic acid and methanol extract, Solvent system – chloroform:methanol:formic acid (14:6:1); (B) Pinitol and methanol extract, Solvent system – chloroform:methanol (3:2)
The available literature reveals that shikimic acid and pinitol possess immunomodulatory and antidiabetic activities respectively [11,12]. Thus, shikimic acid and pinitol (isolated from A. pindrow aerial parts) were taken as bioactive markers to standardize the plant material. TLC densitometric methods were developed and validated as per ICH guidelines for the quantitative determination of shikimic acid and pinitol in A. pindrow aerial parts. Based on results of validation parameters, it is concluded that developed methods for the estimations of shikimic acid and pinitol in A. pindrow aerial parts were precise, reproducible, accurate and specific.
Financial Assistance
The financial assistance provided by University Grants Commission, New Delhi to Dr Suresh Kumar (F. No. 41-735/2012 (SR), dated 23/07/2012) for the present research work is duly acknowledged.
Conflict of Interests
None declared.
References
- Kirtikar KR, Basu BD. Indian Medicinal Plants. Allahabad, India: International Book Distributors; 1975. p. 13.
- Quattrocchi U. CRC World Dictionary of Medicinal and Poisonous Plants: Common Names, Scientific Names, Eponyms, Synonyms and Etymology. Boca Raton: CRC Press; 2012, p. 5.
- Singh RK, Pandey BL. Further study of anti-inflammatory effects of Abiespindrow. Phytother Res 1997;2:535-7.
- Kumar D, Kumar S. Screening of antianxiety activity of AbiespindrowRoyle aerial parts. Indian J Pharm Educ Res 2015;49:66-70.
- Singh RK, Bhattacharya SK, Acharya SB. Pharmacological activity of Abiespindrow. J Ethnopharmacol 2000;73:47-51.
- Tiwari KP, Minocha PK. A chalcone glycoside from A. pindrow. Phytochemistry 1980;19:2501-3.
- Tripathi M, Jain L, Pandey VB, Ray AB, Rucker G. Pindrolactone, a lanostane derivative from the leaves of Abiespindrow. Phytochemistry 1996;43:853-5.
- Burdi, DK, Samejo MQ, Bhanger MI, Khan KM. Fatty acid composition of Abiespindrow (West Himalayan Fir). Pak J Pharm Sci 2007;20:9-15.
- Samejo MQ, Burdi DK, Bhanger MI, Talpur FN, Khan KM. Identification of hydrocarbons from Abiespindrow leaves. Chem Nat Compd 2010;46:132-4.
- Randhawa K, Kumar D, Jamwal A, Kumar S. Screening of antidepressant activity and estimation of quercetin from Cocciniaindica using TLC densitometry. Pharm Biol 2015;53:1867-74.
- Bertelli AA, Mannari C, Santi S, Filippi C, Migliori M, Giovannini L. Immunomodulatory activity of shikimic acid and quercetin in comparison with oseltamivir (Tamiflu) in an in vitro model. J Med Virol 2008;80:741-5.
- Poongothai G, Sripathi SK. A review on insulinomimeticpinitol from plants. Int J Pharm Bio Sci 2013;4:992-1009.


