- *Corresponding Author:
- Madhuri D. Game
Vidyabharati college of pharmacy, C. K. naidu road, Camp, Amravati - 444 602
E-mail: game_madhuri@yahoo.co.in
| Date of Submission | 16 January 2010 |
| Date of Revision | 15 September 2010 |
| Date of Acceptance | 25 November 2010 |
| Indian J Pharm Sci, 2010, 72 (6): 825-828 |
Abstract
A simple, accurate and precise spectrophotometric method has been developed for simultaneous estimation of clopidogrel bisulphate and aspirin by employing first order derivative zero crossing method. The first order derivative absorption at 232.5 nm (zero cross point of aspirin) was used for clopidogrel bisulphate and 211.3 nm (zero cross point of clopidogrel bisulphate) for aspirin.Both the drugs obeyed linearity in the concentration range of 5.0 μg/ml to 25.0 μg/ml (correlation coefficient r 2 <1). No interference was found between both determined constituents and those of matrix. The method was validated statistically and recovery studies were carried out to confirm the accuracy of the method.
Keywords
Aspirin, Clopidogrel bisulphate, Drug analysis, Derivative spectrophotometry
Clopidogrel bisulphate (CPS) (methyl-2-chlorophenyl- (4,5,6,7-tertrahydrothienol[3,2-c]pyridine-5yl) acetate bisulphate) and aspirin (ASP) are used in the treatment of cardiovascular diseases. CPS is used as a platelet inhibitor and aspirin as a cyclooxygenase inhibitor [1]. CPS is not official in any of the pharmacopoeias [2-4]. Literature survey revealed several Spectrophotometric [5] and HPLC [6-9] methods for estimation of aspirin, whereas only a few HPLC [10-12] methods are available for clopidogrel bisulphate. A spectrophotometric method [13] was reported recently for simultaneous analysis of ASP and CPS after hydrolyzing the drugs
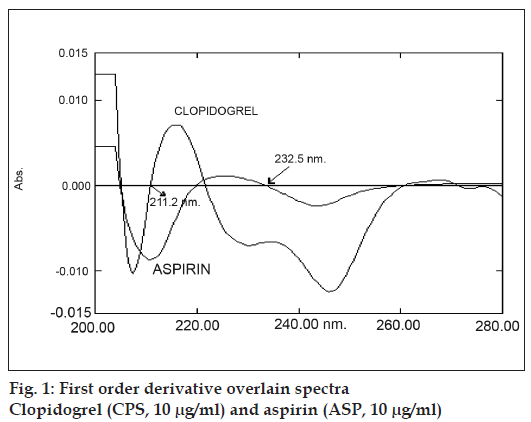
Reference standards of CPS and ASP were obtained as gift samples from Lupin Laboratories SIDCO industrial Complex Jammu. AR grade methanol from Qualigens, Mumbai was used as solvent for preparing solutions. The solution of 0.1N HCl was prepared in double distilled water as per IP 1996 procedure. A Shimadzu UV/Vis 1601 double beam spectrophotometer with a fixed slit width (2 nm) and 1 cm matched quartz cells was used for all the spectral measurements. Standard stock solutions (100 μg/ml) of CPS and ASP were prepared by separately dissolving 10mg each of CPS and ASP, respectively in 100 ml methanol. Suitable aliquot of standard stock solutions were diluted with 0.1N HCl. to obtain solutions of CPS (10 μg/ml) and ASP (10 μg/ml) and scanned in spectrum mode against solvent blank over the range of 200 to 400 nm. The absorption spectra thus obtained were derivatised from first to fourth order. First order derivative spectrum was selected for analysis of both the drugs. From the overlain spectra of both the drugs (fig.1) wavelengths selected for quantitation were 232.5 nm (zero cross point of ASP) for CPS and 211.3 nm (zero cross point of CPS) for ASP.
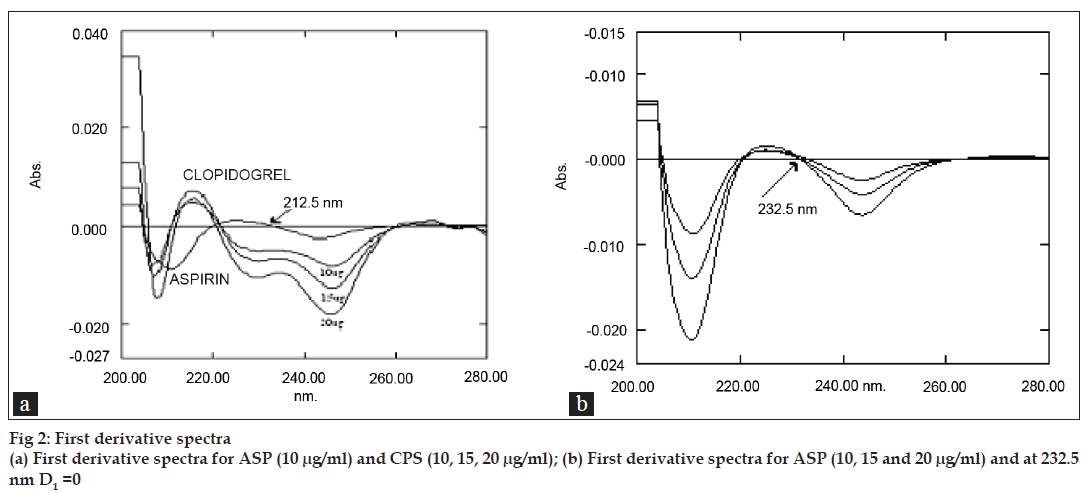
The standard stock solutions of CPS and ASP were diluted with 0.1N HCl to obtain concentration range of 2-30 μg/ml. For all solutions the derivative spectra were obtained over 200 to 400 nm range. At 232.5 nm there were well developed first order derivative absorption spectra for varying concentrations of CPS for its determination (fig. 2a) and no ASP interferences was observed as D1=0 (fig. 2b). So any change in ASP concentration has no effect on quantitative determination of CPS.
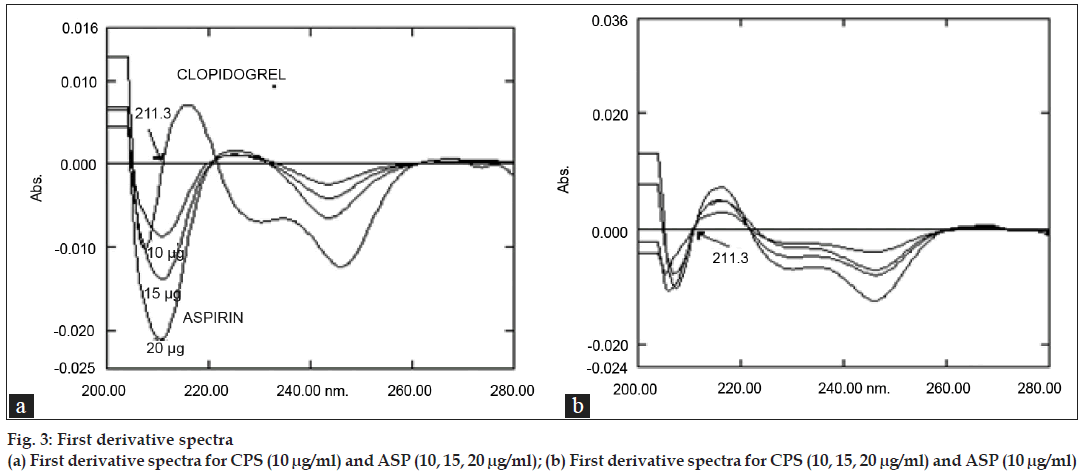
To determine ASP the first order derivative spectra were used by making measurements at 211.3 nm (fig. 3a) at which D1=0 for CPS. No CPS interferences were found even at different concentrations (fig. 3b) for quantitative determination of ASP.
The calibration curves were constructed by plotting drug concentration versus the absorbance values of first derivative spectrum (D1) 232.5 nm for CPS and 211.3 nm for ASP. Statistical data for calibration curves is depicted in (Table 1) The concentration of individual drugs present in the mixture was determined from the calibration curves in quantitation mode.
| Parameters | CPS | ASP |
|---|---|---|
| ASP Wavelength (nm) | 232.5 | 211.3 |
| Beer’s law limit | 5-25 | 5-25 |
| Regression equation* | Y=0.0006 ×-0.0015 | Y=0.0013-0.0042 |
| Correlation coefficient | 0.9862 | 0.9914 |
| LOD (µg/ml) | 2 | 5 |
| LOQ (µg/ml) | 5 | 10 |
y=mx+c; where x is the concentration of drug in µg/ml, y is the amplitude at specified wavelength, m is the slope and c is the intercept
Table 1: Statistical data of calibration curve
Twenty tablets of brand (Clopivas AP Cipla Ltd, Mumbai) containing 75 mg of CPS and 75 mg of ASP per tablet were weighed accurately, average weight determined and finely powdered. The powder equivalent to 10 mg of CPS and 10 mg of ASP was weighed accurately and transferred to 100 ml volumetric flask. Twenty milliliters of methanol was added to the flask and sonicated for 20 min. The solution was filtered through Whatman filter paper (No. 41) and the volume was adjusted up to the mark with methanol. This solution is expected to contain 100 μg/ml CPS and 100 μg/ml ASP. One millilitre of this solution was transferred to a 10 ml volumetric flask and volume was made up the mark with 0.1N HCl to obtain final concentration of CPS (10 μg/ml) and ASP (10 μg/ml). The concentration of both CPS and ASP were determined by measuring the absorbance at 232.5 nm and 211.3 nm in first order spectrum mode and the results of tablets analysis were calculated from the calibration curve in quantitation mode.
The method was validated statistically as per ICH/ USP16 guidelines for all the parameters like accuracy, linearity, precision, ruggedness and specificity. Accuracy of the method was ascertained on the basis of recovery studies, carried out by standard addition method in which pre-analyzed samples were taken and standard drug was added at three different levels. (80%, 100% and 120% of the test concentration). The % recovery±SD lies in the range of 99.68±0.2097 to 99.77±0.3842 for CPS and 99.39±0.7425 to 100.18±0.6286 for ASP (Table 2). The linearity of the method was established from the first derivative spectra by measurement of absorbance of standard solutions containing varying concentrations of each compound in the presence of constant concentrations of other one. Linearity was constructed in the range of 5-25 μg/ml (r2<1). CPS and ASP in tablets were found to be linear in the range ±20 % of test conc. Precision was studied by analyzing five replicates of sample solutions and concentrations were calculated. Ruggedness was established by carrying out experiment at different conditions like intra-day, inter-day and by different analyst. Specificity of the method was ascertained by analysing standard drug and sample. There was no interference of the excipients present in the formulation. By observing validation parameter (Table 3) the method described was found to be specific, accurate, precise and economical and can be successfully applied to analyze commercially available tablets containing CPS and ASP. The results obtained are in good agreement with the labeled content, summarized in (Table 4).
| Level of standardaddition (%) | % Recovery± SD* | |
|---|---|---|
| CPS | ASP | |
| 80 | 99.68±0.2097 | 99.39±0.7425 |
| 100 | 99.77±0.3842 | 100.18±0.6286 |
| 120 | 99.72±0.8015 | 100.08±0.5211 |
*Mean of three determinations, SD is standard deviation
Table 2: Recovery study data.
| Parameters | CPS | ASP |
|---|---|---|
| Linearity | ±20 % of test conc | ±20 % of test conc Precision (% Label |
| Precision (% Label Claim±SD, n=5) |
100.66±0.5211 | 98.55±0.152 |
| Ruggedness (% Label Claim, n=3) |
||
| Intraday | 100.23 | 98.69 |
| Interday | 100.52 | 99.23 |
| DifferentAnalyst | 99.92 | 99.15 |
| Specificity | Specific | Specific |
SD is standard deviation
Table 3: Result of validation studies of proposed method.
| Drug | % Label claim *(mg) | ±SD* |
|---|---|---|
| CPS | 100.09 | 0.5799 |
| ASP | 99.87 | 0.2317 |
*Mean of three determinations. SD is standard deviation
Table 4: Result of analysis of commercial formulations.
Acknowledgements
The authors are grateful to Lupin Laboratories SIDCO industrial Complex Jammu for providing CPS and ASP, pure drugs as gift samples. Authors are also thankful to Vidyabharati College of Pharmacy, Amaravati for providing necessary facilities for the research work.
References
- Budavari S, editor. The Merck Index. 13th ed. Whitehouse Station, NJ: Merck and Co. Inc; 2001. p. 315.
- Budavari S, editor. The Merck Index, 13th ed. Whitehouse Station, NJ: Merck and Co. Inc; 2001. p. 886.
- Indian Pharmacopoeia. Vol. 1. Government of India, Delhi: The Controller of Publication; 1996, p. 69.
- The United State Pharmacopoeia, 26th Revision. Rockville MD: US Pharmacopoeial convention Inc; 2003.
- Sethi PD, editors. Quantitative analysis of drugs in pharmaceutical formulation. 3rd ed. New Delhi: CBS Publisher; 1997. p. 105.
- Maulding DL, Young JF. HPLC analysis of salicylic acid, salicyluricacid and gentisic acid in biological matrixes. J Pharm Sci 1980;69:1224-45.
- Harrison LI, Funk ML, Ober RE. HPLC determination of salicylsalicylic acid, aspirin and salicylic acid in human Plasma and urine. J Pharm Sci 1982;69:1268-71.
- Lo LY, Bye A. Specific and sensitive method for determination of aspirin and salicylic acid in plasma using RP- HPLC. J Chromatogr 1980;181:473-7.
- Amick EN, Mason WD. Determination of aspirin, salicylic acid, salicyluric acid and gentisic acid in human plasma and urine. Anal Lett 1979;12:620-40.
- Gomez Y, Adams E, Hoogmartens J. Analysis of purity of 19 drug product tablets containing clopidogrel: 18 copies versus the original brand. J Pharm Biomed Anal 2004;34:341-8.
- Agrawal H, Kaul N, Paradkar AR, Mahadik KR. Stability indicating HPTLC determination of clopidogrel bisulphate as bulk drug and in pharmaceutical dosage form. Talanta 2003;61:581-9.
- Koradia V, Bansal AK. Quantitative and qualitative analysis of clopidogrel bisulphate polymorphs. Acta Pharma 2004;54:193-5.
- Mishra P, Dolly A. Spectrophotometric methods for determination of clopidogrel in tablets. Indian J Pharm Sci 2006;68:491-2.


