- *Corresponding Author:
- S. R. Yarraguntla
Department of Pharmaceutical Analysis, Vignan Institute of Pharmaceutical Technology, Duvvada, Visakhapatnam 530049, Andhra Pradesh, India
E-mail: ysrvignan@gmail.com
| Date of Received | 03 July 2021 |
| Date of Revision | 28 February 2023 |
| Date of Acceptance | 07 June 2023 |
| Indian J Pharm Sci 2023;85(3):753-760 |
This is an open access article distributed under the terms of the Creative Commons Attribution-NonCommercial-ShareAlike 3.0 License, which allows others to remix, tweak, and build upon the work non-commercially, as long as the author is credited and the new creations are licensed under the identical terms
Abstract
An efficient, rapid, sensitive, validated stability-indicating ultraviolet spectrophotometric method was developed for flurbiprofen in eye drops. Methanol was employed as the solvent in this proposed process, and detection was carried out at a wavelength of 248 nm. The validation parameters linearity, limit of detection and limit of quantitation, accuracy, precision and specificity were all the subject of experiments according to International Council on Harmonisation guidelines. The stability of flurbiprofen was examined under acidic, alkaline, thermal, and photolytic conditions. The kinetics in the concentration range of 2-10 ug/ml were defined as linear with a correlation value of 0.992. The percentage of relative standard deviation for both intra-day and inter-day accuracy was under less than 2 % and 99.6 %-100.4 % of the drug was retrieved from the study. The system was able to identify variations related to stress conditions although the stress condition of degradation products hadn't been determined. The proposed approach can be employed as a stability indicating method for flurbiprofen screening in conventional pharmaceutical analysis of eye drops with a significant level of linearity, accuracy and precision. The method was found to be both affordable and convenient. This method can therefore be used to study flurbiprofen stress degradation behaviour in small industries without access to sophisticated equipment.
Keywords
Stability indicating, ultraviolet spectrophotometric method, flurbiprofen eye drops, method, validation, International Council on Harmonisation guidelines
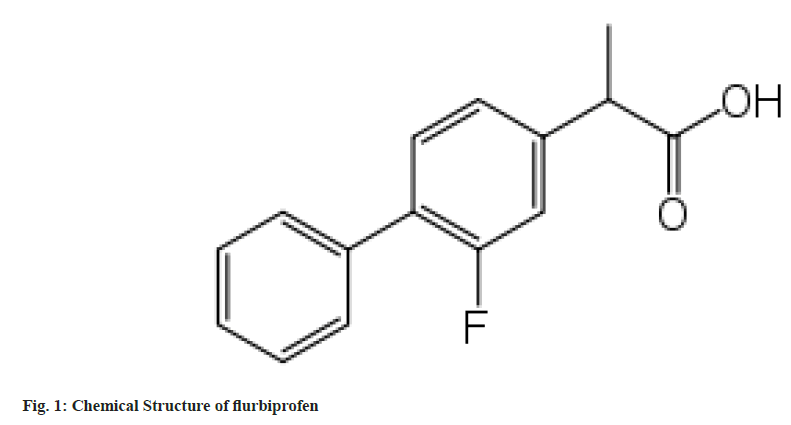
The chemical name for flurbiprofen (fig. 1) is 2-(2-fluorobiphenyl-4-yl)propanoic acid[1-3]. It is a Non-Steroidal Anti-Inflammatory Drug (NSAID) of the propionic acid class that shares structural and physiological similarities with fenoprofen, ibuprofen and ketoprofen. It articulates the same pharmacological characteristics as other wellknown NSAIDs. Anti-inflammatory, analgesic, and antipyretic effects are all present in flurbiprofen. Commercially available flurbiprofen may be a racemic mixture of (+) S and (-) R enantiomers. Although both enantiomers might have analgesic qualities, the S-enantiomer often possesses the greatest anti-inflammatory potentials.
Rheumatoid arthritis, osteoarthritis and Marie- Strumpell disease are all chronic conditions that are treated with flurbiprofen. Moreover, it will be utilised to lessen mild to severe inflammation-related discomfort and pain from dysmenorrhea (bursitis, tendonitis and soft tissue trauma). Topical ophthalmic preparations could be applied beforehand to stop intraoperative miosis. Alzheimer's disease is also treated with it[4]. It might also have anti-thrombic properties[5] in the d-isomer. Moreover, vernal keratoconjunctivitis and herpetic stromal keratitis can both be treated topically with flurbiprofen[6,7]. A review of the literature revealed that spectrophotometric[8-10], High-Performance Liquid Chromatography (HPLC) [11-20], Gas Chromatography-Mass Spectrometry (GC-MS)[21], and Liquid Chromatography-Mass Spectrometry (LC-MS)[22] techniques have all been established for quantifying flurbiprofen from bulk items, pharmaceutical formulations and biological fluids. However, a stability-indicating method for spectrophotometric flurbiprofen quantification in pharmaceutical dosage forms has yet to be reported. Because the technology is less expensive and requires little maintenance, spectrophotometry is frequently employed, especially by small firms. Ultraviolet (UV) spectrophotometry can be used to study of flurbiprofen and its degraded components under stress conditions. According to ICH recommendations[23-26], determination of flurbiprofen in various synthetic and di ester mixture analysis including characterization[27,28]. The active pharmaceutical ingredient is compelled to degrade in a number of conditions, including acidic, basic and oxidative degradation. Forced degradation should be used as a strategy early in the production method to ensure that the system is discriminating before a lot of time, effort and money has been invested. It's critical to establish the causes of medication degradation. The estimation of flurbiprofen in eye drops using a UV spectrophotometric method that would be reliable and applicable to everyday laboratory research is presented in this current proposed work.
Materials and Methods
All spectrophotometric measurements were performed with 10 mm quartz cells using an Elico SL210 double beam UV/Visible (Vis) spectrophotometer with spectral treats software. An electronic balance was used for all weighings (APEX, INDIA). Elite Scientific Equipments included a sonicator, which was used for sonication. An Elico SL210 double beam UV/Vis spectrophotometer having spectral treats. Every procedure's glassware was thoroughly washed with detergent, rinsed with double-distilled water and dried in a hot air oven. Flurbiprofen was obtained as a pure drug sample from RA Chem in Hyderabad, India. The rest of the chemicals and reagents were of analytical quality. Qualigens Chemicals Ltd., Mumbai, India, given methanol, sodium hydroxide (NaOH), and hydrochloric acid (HCl). Sunways India Pvt Ltd's flubifen eye drops with 0.3 mg flurbiprofen/ml were purchased from a nearby pharmacy.
Preperation of standard solution:
100 mg of flurbiprofen was dissolved in 50 ml of methanol to make the flurbiprofen standard medication solution. The resultant was a stock solution with a concentration of 1 mg/ml that was transferred to a 100 ml volumetric flask and filled to the mark with methanol.
Preperation of sample solution:
Identifying the amount of flurbiprofen is present in a commercially available formulation (label claim: Flurbiprofen (0.3 mg/ml)). A 100 ml volumetric flask with 50 ml of methanol was filled with a 20 ml solution of flurbiprofen eye drops. After being sonicated for 10 min, it was 100 ml diluted in methanol. The liquid supernatant was collected after the contents underwent a 5 min, 3000 rpm centrifugation cycle. 10 ml of the solution and 100 ml of methanol were combined in a 100 ml volumetric flask. The absorbance of the resultant solution was estimated at 248 nm and compared to a methanol blank. The regression equation for the calibration plot was used to calculate the flurbiprofen concentration.
Linearity:
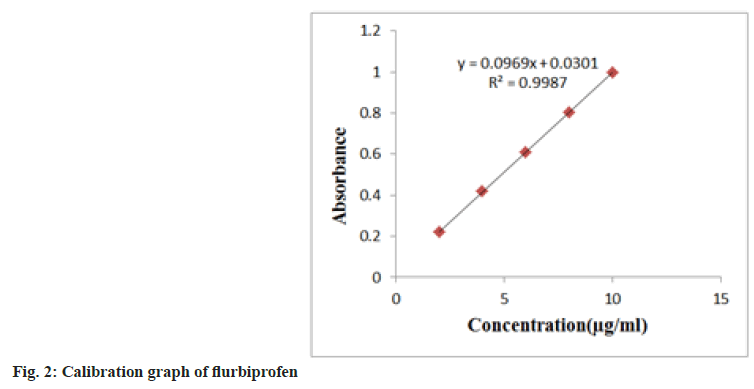
During the linearity tests, aliquots of 0.2-1.0 ml of stock solutions were transferred to a series of 100 ml volumetric flasks, and the volume was rounded off with methanol. In the 200-400 nm range, solutions were scanned in contrast to a blank. The absorption maxima values were discovered at 248 nm in comparison to a null. Plotting a calibration curve was done. The Limit Of Detection (LOD) and Limit Of Quantitation (LOQ) were separately determined using the standard deviation of the Y-intercept and the slope of the calibration curve. LOD=3.3×σ/s, LOQ=10×σ/s Where, s=slope of calibration curve and σ=standard deviation of y intercept of regression lines (fig. 2).
Accuracy:
The accuracy of the procedure was evaluated using the recovery experiment. Five concentration ranges, ranging from 80 %-120 % of the nominal concentration, were used in this experiment. Three duplicate samples were generated for each concentration level and the percentage recovery at each level was calculated (n=6).
Precision:
By analysing with intra-day and inter-day variations, precision was attained. The sample was examined for inter-day variation over the course of 3 d, and for intra-day variation, the absorbances were measured 3 times in a single day. The percentage of Relative Standard Deviation (RSD), was calculated (n=6).
Specificity:
Specificity of method was evaluated using flurbiprofen sample under the presence of UV light at 254 nm, for 72 h interval time, acidic and basic conditions performed (0.1 N HCl and 0.1 N NaOH) for 3-4 d at 65° and also thermolytic, photolytic conditions, considerable degradation was observed. But in the case of photolytic conditions considerable degradation was observed.
LOD and LOQ
The detection and quantification limits of drug substance were determined by series of dilutions of stock solutions of each to attain an average signal-to-noise ratio of 3:1 and 10:1, respectively .
Forced degradation studies:
In forced degradation trials, the drug sample was subjected to thermal, photolytic and acid and base mediated degradation. To illustrate the stabilityindicating ability and specificity of the proposed approach, only the compound's solid state was employed for thermal degradation tests, while the solution was used for forced degradation in the other degradation environments. The drug material was dissolved in aqueous HCl/NaOH solution and diluted with methanol to a concentration of 50 ug/ ml, with a final concentration of 5 μg/ml.
Finally, a spectrum scan from 200 to 400 nm was carried out on a UV/Vis spectrophotometer to quantify the absorbance on several days to track degradation. In each test for drug degradation, the substance's absorbance was identified, and the amount of medication that had been degraded was assessed. The drug substance in solution was subjected through acid hydrolysis with 0.1 N HCl at 60° for 8 d. The drug material was kept in solution at 60° for 4 d and subjected to base hydrolysis using a 0.1 N NaOH solution.To replicate thermal stress, strong chemical substance samples were placed in a controlled-temperature oven at 80° for 4 d. A suitable aliquot of the stock solution was exposed to UV light with a flux strength of 1.4 for 48 h in a UV chamber.
Results and Discussion
The established approach has been validated for linearity, accuracy and precision. The analysis employed flurbiprofen at a nominal concentration of 5 ug/ml. The proposed method was discovered to be linear with a linear correlation coefficient of 0.999 and the linear regression equation y=0.0965x+0.0301; statistical parameters are presented in Table 1. Flurbiprofen may be accurately measured (LOD) and quantified (LOQ) at concentrations as low as 0.11 and 0.42 μg/ml, respectively. The mean recoveries between 99.60 %-100.03 % served as evidence of the method's accuracy (Table 2).
| Parameters | |
|---|---|
| λmax (nm) | 248 |
| Beer’s law limits (µg/ml) | 02-10 |
| Molar absorptivity ( Lit mol-1 cm-1) | 2.5×10⁴ |
| Limit of Detection (LOD/µg/ml) | 0.11 |
| Limit of quantification(LOQ/µg/ml) | 0.42 |
| Sandell’s sensitivity (µg/cm2/0.001 A.U.) | 0.0095 |
| Regression equation (Y*) | |
| Slope (b) | 0.0969 |
| Intercept (a) | 0.0301 |
| Correlation coefficient (r2) | 0.9987 |
| % Range of errors | |
| Confidence limits with 0.05 level | 0.2453 |
| Confidence limits with 0.01 level | 0.4865 |
Note: *Y=bX+a, where X is the concentration of flurbiprofen in μg/ml and Y is the absorbance at respective λmax
Table 1: Optical Characteristics and Analytical Parameters of the Proposed Methods
| % Level | Sample conc. (µg/ml) (n=6) | Standard conc. added (µg/ml) (n=6) | Total conc. (µg/ml) (n=6) | Amount recovered (µg/ml) | % Recovery | Mean % Recovery±% RSD |
|---|---|---|---|---|---|---|
| 80 % | 6 | 4.8 | 10.8 | 10.73 | 99.38 | 99.6±0.42 |
| 6 | 4.8 | 10.8 | 10.82 | 100.2 | ||
| 6 | 4.8 | 10.8 | 10.71 | 99.22 | ||
| 100 % | 6 | 6 | 12 | 12.01 | 100.1 | 100.03±0.15 |
| 6 | 6 | 12 | 12 | 100.05 | ||
| 6 | 6 | 12 | 11.99 | 99.95 | ||
| 120 % | 6 | 7.2 | 13.2 | 13.2 | 100.04 | 99.88±0.23 |
| 6 | 7.2 | 13.2 | 13.13 | 99.5 | ||
| 6 | 7.2 | 13.2 | 13.21 | 100.1 |
Table 2: Recovery Studies (Accuracy)
When the repeatability, intra-day assay precision (RSD), and inter-day assay precision (RSD) were less than 1 % and less than 2 %, respectively, the suggested approach was proven to be accurate (Table 3). Specificity is the capacity of a system to accurately calculate the analytical response in the presence of all significant determinants. The stress analysis of the material further supports the specificity of the suggested approach. The investigation was done to confirm the established method's ability to predict stability and to pinpoint the primary variables that will have an impact on drug stability. A sample solution and solid were submitted to accelerated degradation under acidic/ alkaline/ photolytic, and thermal stress conditions in accordance with International Council on Harmonisation (ICH) guidelines to investigate the role of degradation products in the quantification of flurbiprofen.
| Con. taken (µg/ml) | Intraday | Interday | ||
|---|---|---|---|---|
| Con. found* (µg/ml) | % RSD | Con. found* (µg/ml) | % RSD | |
| 4 | 4.02 | 0.46 | 3.89 | 0.48 |
| 6 | 5.98 | 0.51 | 5.91 | 0.45 |
| 8 | 7.89 | 0.48 | 7.85 | 0.45 |
Note: *Average of six determinations(n=3)
Table 3: Intraday and Interday Precision
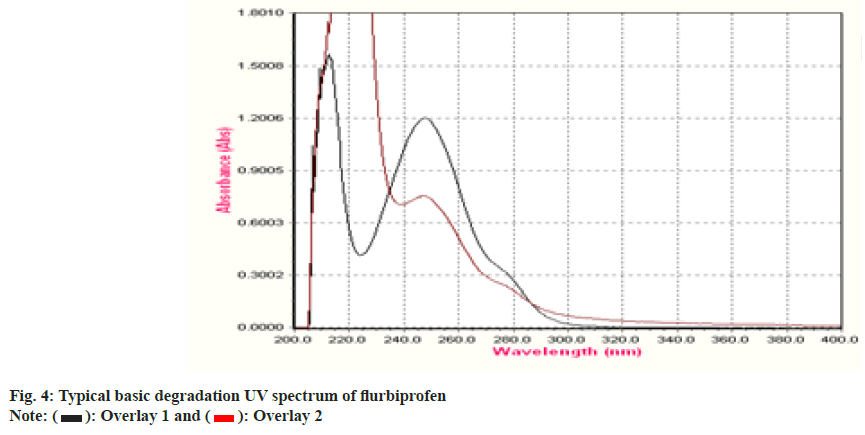
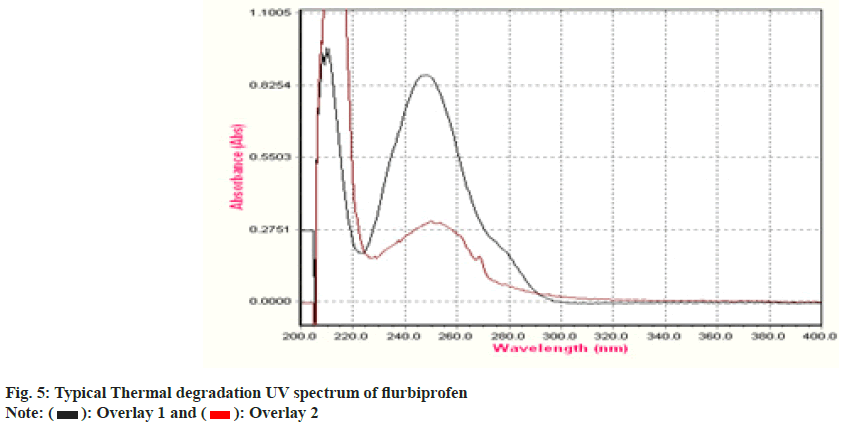
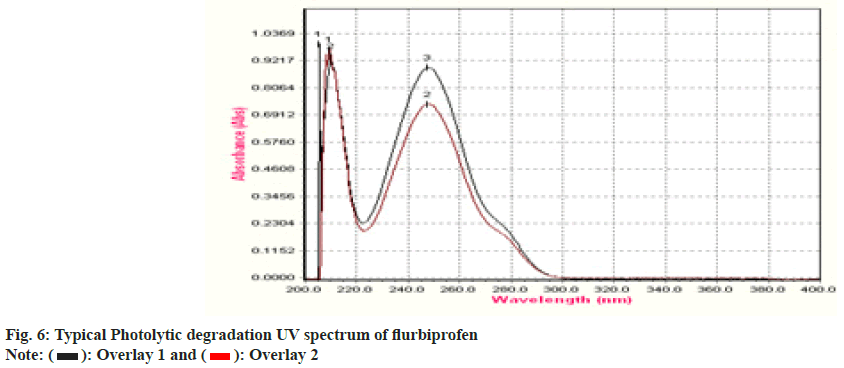
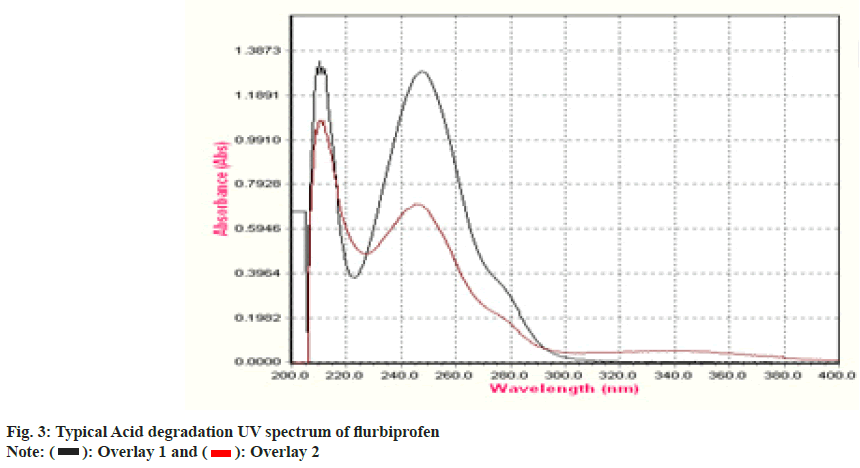
To establish the stability indicating technique, the UV spectrums of flurbiprofen under diverse stressful settings were examined. Using 0.1 N HCl, the acid degradation was completed. An overlay graph of flurbiprofen and flurbiprofen that has been acid-degraded is shown in fig. 3. It was calculated how much of the flurbiprofen substance has been degraded. 0.1 N NaOH was used to carry out the alkali degradation. An overlay graph of flurbiprofen and flurbiprofen that has been alkali-degraded is shown in fig. 4. It was calculated how much of the medication has been degraded. After 10 d of observation, the percentage of assay flurbiprofen normal in thermally stressful circumstances at 80° was measured (fig. 5). The photolytic degradation was accomplished in a photostability chamber by exposing the samples to light.
An overlay graph of flurbiprofen and flurbiprofen that has been photolytically degraded is shown in fig. 6. It was calculated how much of the substance has been degraded. Table 4 displays the findings of studies on deterioration. The medication is stable under photolytic conditions, but it rapidly deteriorates under the other circumstances, specifically under acid hydrolysis and thermal circumstances. The system could detect changes brought on by stress even while the degradation products were unknown. Following chromatographic separation of the degradants, the degradation product can be examined using relevant spectroscopic methods including mass spectroscopy and nuclear magnetic resonance spectroscopy.
| Degradation Type | Experimental Conditions | Maximum Degradation(d) | % Assay of standard |
|---|---|---|---|
| Acid Hydrolysis | 0.1 N HCl at 60° | 8 | 44 |
| Base Hydrolysis | 0.1 N NaOH at 60° | 4 | 72 |
| Thermal | 80° | 4 | 25 |
| Photolytic | 1.4 flux intensity | 2 | 86 |
Table 4: Forced Degradation Study
The present proposed results assist in understanding the mechanism of flurbiprofen's degradation as well as stability indications for method development. The assay outcomes for the commercial formulations are displayed in (Table 5). The label claim and the established procedure agreed extremely well. The proposed UV/Vis spectrophotometric approach was successfully validated in accordance with ICH requirements. Based on the analysis of samples that were forced to deteriorate using the suggested method and the UV spectral data, it can be said that the method is specific for identifying flurbiprofen in the presence of degradants.The approach is found to be accurate and exact, with decreased LOD and LOQ values and a linear response in the desired range. The method shown here can be used to assess flurbiprofen's stability in ophthalmic formulations.
| Formulation | Labeled amount | Mean Amount found(mg/ml)*±SD | Mean % Recovery*±SD |
|---|---|---|---|
| Flubifen (Eye Drops) | 0.3 mg/ml | 0.298 ±0.79 | 99.33± 0.77 |
Note: (*): Average of three determinations(n=3)
Table 5: Assay Table
In conclusion, an efficient, rapid, sensitive, validated stability-indicating UV spectrophotometric assay method was developed for flurbiprofen in eye drops. Methanol was employed as the solvent in this proposed process, The validation parameters linearity, LOD and LOQ, accuracy, precision, and specificity were all the subject of experiments according to ICH guidelines.
The system was able to identify variations related to stress conditions although the stress condition of degradation products hadn't been determined. The proposed approach can be employed as a stability indicating method for flurbiprofen screening in conventional pharmaceutical analysis of eye drops with a significant level of linearity, accuracy, and precision. The method was found to be both affordable and convenient. The proposedmethod can be used to study flurbiprofen stress degradation behaviour in small industries without access to sophisticated equipment.
Acknowledgments
The authors are grateful to Dr. L. Rathaiah, Chairman of Lavu educational society for providing necessary facilities to carry out the above research work.
Conflict of interests:
The authors declared no conflict of interests.
References
- Rockville. United States Pharmacopoeia Convention. Monograph on flurbiprofen, in United States Pharmacopoeia (USP); 2000:748-50.
- British Pharmacopoeia. British Pharmacopoeia Commission; 2008:612-13.
- The Pharmacopoeia of India, Indian Pharmacopoeia Commission, New Delhi; 1996: 328-9.
- Galasko DR, Graff-Radford N, May S, Hendrix S, Cottrell BA, Sagi SA, et al. Safety, tolerability, pharmacokinetics, and Aβ levels after short-term administration of R-flurbiprofen in healthy elderly individuals. Alzheimer Dis Assoc Disord 2007;21(4):292-9.
[Crossref] [Google Scholar] [PubMed]
- Townsend KP, Praticò D. Novel therapeutic opportunities for Alzheimer's disease: Focus on nonsteroidal anti‐inflammatory drugs. FASEB J 2005;19(12):1592-601.
[Crossref] [Google Scholar] [PubMed]
- Sud RN, Greval RS, Bajwa RS. Topical flurbiprofen therapy in vernal keratoconjunctivitis. Indian J Med Sci 1995;49(9):205-9.
[Google Scholar] [PubMed]
- Brooks PM, Day RD. Nornal anti-inflammatory drugs: Differences and similarities. N Eng J Med 1991;324:1716-25.
- Bilal Y, Emrah A. Spectrofluorometric and UV spectrophotometric methods for the determination of flurbiprofen in pharmaceutical preparations. J Pharm Anal 2015;4(4):1-8.
- Chauhan CS, Singhvi I, Choudhury PK. Spectrophotometric Determination of flurbiprofen sodium in biological fluid. Asian J Chem 2007;19(4):3286.
- Sajeev C, Jadhav PR, RaviShankar D, Saha RN. Determination of flurbiprofen in pharmaceutical formulations by UV spectrophotometry and liquid chromatography. Anal Chim Acta 2002;463(2):207-17.
- Akhlaq M, Khan GM, Wahab A, Khan A, Hussain A, Nawaz A, et al. A simple high-performance liquid chromatographic practical approach for determination of flurbiprofen. J Adv Pharm Technol Res 2011;2(3):151.
- Yilmaz B, Erdem AF. Determination of flurbiprofen in human plasma by high-performance liquid chromatography. J Chromatogr Sci 2015;53(9):1443-8.
[Crossref] [Google Scholar] [PubMed]
- Geisslinger G, Menzel-Soglowek S, Schuster O, Brune K. Stereoselective high-performance liquid chromatographic determination of flurbiprofen in human plasma. J Chromatogr 1992;573(1):163-7.
[Crossref] [Google Scholar] [PubMed]
- Foda NH, Gohary OA. High performance liquid chromatographic determination of flurbiprofen in pharmaceutical dosage forms. Anal Lett 1994;27(13):2523-34.
- Chandran S, Saha RN. Simple rapid validated RP-LC method for the estimation of flurbiprofen in rabbit serum and Aqueous Humor. Anal Lett 2008;41(8):1318-34.
- Geisslinger G, Menzel-Soglowek S, Schuster O, Brune K. Stereoselective high-performance liquid chromatographic determination of flurbiprofen in human plasma. J Chromatogr 1992;573(1):163-7.
[Crossref] [Google Scholar] [PubMed]
- Johnson VA, Wilson JT. Flurbiprofen analysis in plasma and breast milk by high-performance liquid chromatography. J Chromatogr 1986;382:367-71.
[Crossref] [Google Scholar] [PubMed]
- Berry BW, Jamali F. Stereospecific high-performance liquid chromatographic (HPLC) assay of flurbiprofen in biological specimens. Pharm Res 1988;5:123-5.
[Crossref] [Google Scholar] [PubMed]
- Knadler MP, Hall SD. High-performance liquid chromatographic analysis of the enantiomers of flurbiprofen and its metabolites in plasma and urine. J Chromatogr 1989;494:173-82.
[Crossref] [Google Scholar] [PubMed]
- Mathew M, Gupta VD, Bethea C. Quantitation of flurbiprofen in tablets using high performance liquid chromatography. Drug Dev Indu Pharm 1993;19(4):493-8.
- Yilmaz B, Sahin H, Akba V, Erdem AF. Determination of flurbiprofen in human plasma by gas chromatography with mass spectrometry and its pharmacokinetics. J AOAC Int 2014;97(4):1061-6.
[Crossref] [Google Scholar] [PubMed]
- Mei C, Li B, Yin Q, Jin J, Xiong T, He W, et al. Liquid chromatography-tandem mass spectrometry for the quantification of flurbiprofen in human plasma and its application in a study of bioequivalence. J Chromatogr B 2015;993:69-74.
[Crossref] [Google Scholar] [PubMed]
- ICH Q2 (R1). Validation of Analytical Procedures: Text and Methodology: USA; 2005.
- International Conference on Harmonisation guideline. Q1B Photostability Testing of New Drug Substances and Products, IFPMA, Geneva, Switzerland. 1996.
- International Conference on Harmonisation guideline, Q1A (R2) Stability Testing of New Drug Substances and Products, IFPMA, Geneva, Switzerland. 2003.
- Schmidt P, Kolb C, Godejohann M, Reiser A, Philipp M, Müller HC, et al. Separation and identification of a complex flurbiprofen-polyethylene glycol mono-and diester mixture via a hyphenated HPLC-DAD-HRMS/SPE NMR system. J Pharm Biomed Anal 2023;222:115068.
[Crossref] [Google Scholar] [PubMed]
- Challa GN, Ramisetti NR, Nimmu NV. Chemical stability and spectroscopic characterization of Balofloxacin and its stress degradation products by LC-PDA, LC-MS/MS, NMR and FT-IR. Anal Chem Let 2019;9(4):535-51.
- Alam A, Ali M, Rehman NU, Latif A, Shah AJ, Wazir NU, et al. Synthesis and characterization of biologically active flurbiprofen amide derivatives as selective prostaglandin-endoperoxide synthase II inhibitors: In vivo anti-inflammatory activity and molecular docking. Int J Biol Macromol 2023;228:659-70.
[Crossref] [Google Scholar] [PubMed]
 : Overlay 1 and
  : Overlay 2