- *Corresponding Author:
- Sanghamitra Nayak
Centre for Biotechnology,
Siksha O Anusandhan (Deemed to be University),
Bhubaneswar, Odisha 751003,
India
E-mail: sanghamitran24@gmail.com
| Date of Received | 10 November 2020 |
| Date of Revision | 30 June 2021 |
| Date of Acceptance | 08 September 2021 |
| Indian J Pharm Sci 2021;83(6):1129-1143 |
This is an open access article distributed under the terms of the Creative Commons Attribution-NonCommercial-ShareAlike 3.0 License, which allows others to remix, tweak, and build upon the work non-commercially, as long as the author is credited and the new creations are licensed under the identical terms
Abstract
Andrographis paniculata (Burm. f.) Nees is a potential medicinal herb used to treat a wide range of diseases. Various geographical origins of this herb might lead to the diversity of the herbal quality. The research aims to establish the chemical fingerprint for quality control of Andrographis paniculata and to find out the chemical markers for discrimination from different origin through the chemometrics approach. A high performance liquid chromatography photo diode array method was developed for simultaneous quantiï¬cation of ï¬ve marker compounds and for establishing the chemical fingerprint of Andrographis paniculata from 28 different locations of Eastern India. Chemometrics techniques including hierarchical cluster analysis, principal component analysis and partial least squares discriminant analysis were used. The similarities between each fingerprint of the sample and the simulative mean chromatogram were greater than 0.90. The relative standard deviation of relative retention time and relative peak area of precision, stability and repeatability of 12 characteristic peaks in these samples were less than 1 % and 3 %, respectively. The andrographolide content in the Odisha region varied in the range of 2.68-5.47 %. The results of hierarchical cluster analysis, principal component analysis and partial least squares discriminant analysis showed that Andrographis paniculata could be successfully grouped into two groups in accordance with the origin. Andrographolide (variable importance in projection score >1.5) was the key discriminatory marker for discriminating the samples. The high performance liquid chromatography fingerprint combined with chemometric approaches could be used as an effective tool for discriminating the herb from different origins and quality control of Andrographis paniculata.
Keywords
Andrographis paniculata, chemometrics, discriminatory marker, high performance liquid chromatography fingerprint, similarity analysis, quality control
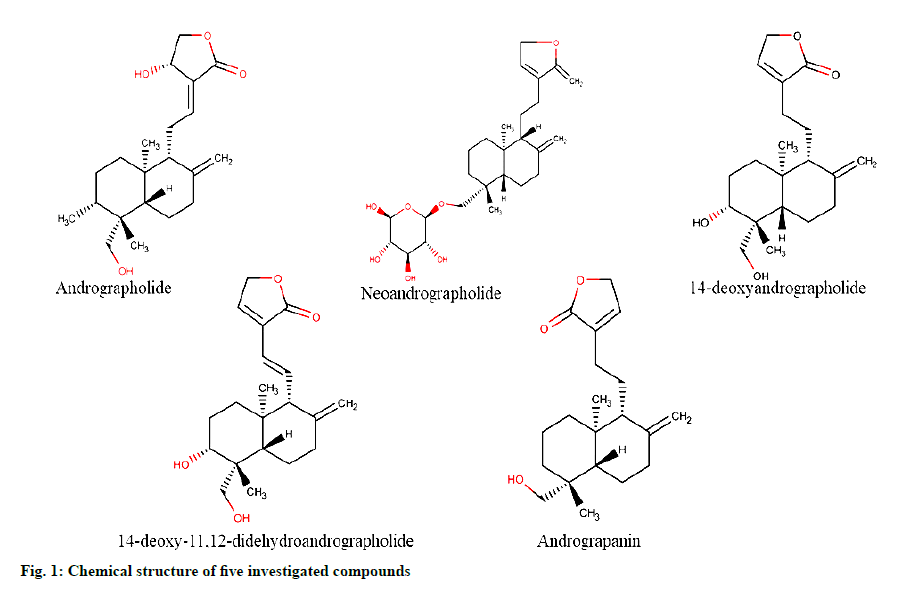
Andrographis paniculata (Burm. f.) Nees (A. paniculata) commonly known as the ‘king of bitters’ belongs to the Acanthaceae family [1,2]. It is native to India, Taiwan and China and is also distributed throughout Southern and South Eastern Asia [2,3]. A. paniculata is used as an important herbal constituent in about 26 different Ayurvedic formulations [4-7]. Similarly, A. paniculata is an important component in several Chinese medical preparations such as nemone chinensi, chuanxinlian, xiaoyan lidan and qinghuo zhimai [8,9]. The juice extracted from leaves of A. paniculata is used in Indian Pharmacopoeia as a febrifuge [10]. The aerial parts of the plant are being traditionally used for the treatment of several ailments such as liver disorders, diabetes, bronchitis, influenza, high blood pressure, dyspepsia, ulcer, rheumatoid arthritis, skin diseases, flatulence, colic, dysentery and malaria [2,11]. The modern pharmacological studies showed A. paniculata had good anti-inflammatory, antioxidant, anticancer and immune-stimulatory activity [12-15]. The potential health benefits of A. paniculata are mainly attributed due to the presence of active constituents including diterpene lactones (andrographolide, dehydroandrographolide, neoandrographolide, deoxyandrographolide, 14-deoxy- 11,12-didehydroandrographide, andrograpanin and isoandrographolide) and flavonoids (andrographidine, apigenin and luteolin) [16-18].
As specified in the various pharmacopoeia, herbal industries measure the quality of A. paniculata based on a single active constituent i.e., andrographolide. However, due to the complex components in A. paniculata, monitoring only the andrographolide content cannot offer comprehensive quality control for A. paniculata.
Previously reported analytical methods for quantitative analysis of A. paniculata samples considered only one or two marker constituents [17,19-21]. None of these reports have carried out a simultaneous separation and determination of multiple bioactive components of A. paniculata. In light of this, a multiple marker based High Performance Liquid Chromatography (HPLC) fingerprint in combination with chemometric approaches seems to be suitable for the quality assessment of A. paniculata. Moreover, studies have shown that the internal quality of A. paniculata is related to its habitat/geographical region [17]. Geographical origin and environmental factors affect the production and accumulation of secondary metabolites [22,23]. For this reason, it is necessary to establish a fingerprint that could discriminate and distinguish between samples of different geographical origins.
Nowadays, the chromatographic fingerprint has become a most rational and powerful approach for authentication, quality assessment and consistency of the herbal product and has been accepted by World Health Organisation [24], Food and Drug Administration [25] and European Medicines Agency [26]. Various analytical methods such as High Performance Thin Layer Chromatography (HPTLC), HPLC, Gas Chromatography (GC) and Capillary Electrophoresis (CE) have been recognized for the identification and quantification of herbal products. However, HPLC has been extensively applied in fingerprint analysis due to its simplicity and cost-effectiveness [27-34]. Fingerprint pattern is a complex dataset due to the complex matrix of herbs and it is difficult to baseline and isolate all compounds [35]. Therefore, multivariate chemometric method including Hierarchical Cluster Analysis (HCA), Principal Component Analysis (PCA), Partial Least Square Method-Discriminant Analysis (PLS-DA), Artificial Neural Networks (ANNs) and Discriminant Analysis (DA) have been successfully applied in combination with chemical fingerprint to find out the discriminatory chemical markers and reasonable pattern recognitions for identification and quality control of herbal medicines [36-40].
As far as we know, there are hardly any reports on the development of the effective method for differentiating A. paniculata from different geographical regions of India by integrating HPLC fingerprinting with chemometric methods. Thus, the purpose of the current study was to develop an efficient HPLC fingerprint method for the quality assessment of A. paniculata in combination with chemometric methods. Additionally, semi-quantitative estimation of five biomarkers in extracts of A. paniculata collected from 28 different habitats was also carried out. Supervised and unsupervised techniques such as HCA, PCA and PLSDA were successfully used to classify and differentiate A. paniculata samples of different geographical origins.
Materials and Methods
Plant material and reagents:
A total of 28 batches of A. paniculata aerial parts were collected across different geographical locations of Odisha and West Bengal provinces from September to November, 2019. Specifically, a total of 10 healthy mature plants of A. paniculata with similar growth stature were collected from each geographical location. All the plants were identified and authenticated by Dr. Pratap Chandra Panda, Principal Scientist, Regional Plant Resource Centre, Bhubaneswar, Odisha, India and the voucher specimens were deposited at the herbarium of the same institute (Table 1).
| S. No. | Place | Province | Content (%) | Voucher Specimen | ||||
|---|---|---|---|---|---|---|---|---|
| C1 | C2 | C3 | C4 | C5 | ||||
| S1 | Gajapati | Odisha | 3.77 | 0.18 | 1.70 | 0.22 | 3.75 | 12532 |
| S2 | Gajapati | Odisha | 5.19 | 0.22 | 2.20 | 0.29 | 2.92 | 12533 |
| S3 | Gajapati | Odisha | 5.39 | 0.30 | 1.70 | 0.70 | 4.46 | 12534 |
| S4 | Gajapati | Odisha | 3.96 | 1.15 | 0.50 | 0.99 | 3.99 | 12535 |
| S5 | Gajapati | Odisha | 3.07 | 1.13 | 3.47 | 0.77 | 3.15 | 12536 |
| S6 | Gajapati | Odisha | 4.29 | 0.23 | 0.71 | 0.76 | 4.07 | 12537 |
| S7 | Gajapati | Odisha | 3.14 | 0.11 | 0.35 | 0.64 | 2.55 | 12538 |
| S8 | Khordha | Odisha | 5.01 | 0.57 | 1.67 | 0.61 | 4.19 | 12545 |
| S9 | Khordha | Odisha | 2.85 | 0.18 | 1.91 | 0.69 | 2.19 | 12546 |
| S10 | Khordha | Odisha | 5.47 | 0.39 | 1.47 | 0.83 | 4.03 | 12547 |
| S11 | Khordha | Odisha | 4.45 | 0.55 | 0.48 | 0.41 | 3.79 | 12548 |
| S12 | Khordha | Odisha | 2.78 | 0.32 | 1.81 | 0.74 | 2.03 | 12549 |
| S13 | Khordha | Odisha | 2.68 | 0.23 | 0.74 | 0.99 | 2.34 | 12550 |
| S14 | Barrackpore | West Bengal | 0.57 | 0.54 | 1.25 | 1.08 | 0.33 | 12556 |
| S15 | North 24 Parganas | West Bengal | 0.65 | 0.26 | 1.42 | 1.05 | 0.36 | 12557 |
| S16 | Bankura | West Bengal | 0.34 | 0.30 | 0.59 | 1.68 | 0.26 | 12558 |
| S17 | Bankura | West Bengal | 1.32 | 0.30 | 0.24 | 2.67 | 0.47 | 12559 |
| S18 | Nadia | West Bengal | 1.40 | 0.06 | 0.94 | 0.30 | 0.29 | 12560 |
| S19 | North 24 Parganas | West Bengal | 0.36 | 0.17 | 1.32 | 0.97 | 0.25 | 12561 |
| S20 | North 24 Parganas | West Bengal | 0.41 | 0.39 | 1.31 | 0.85 | 0.35 | 12562 |
| S21 | North 24 Parganas | West Bengal | 0.46 | 0.23 | 1.10 | 0.84 | 0.34 | 12563 |
| S22 | Nadia | West Bengal | 1.46 | 0.06 | 0.98 | 0.39 | 0.39 | 12570 |
| S23 | North 24 Parganas | West Bengal | 1.22 | 0.81 | 1.19 | 2.60 | 0.34 | 12564 |
| S24 | Birbhum | West Bengal | 0.80 | 0.35 | 0.14 | 0.89 | 0.56 | 12569 |
| S25 | Purba Medinipur | West Bengal | 0.91 | 0.45 | 0.17 | 0.85 | 0.52 | 12568 |
| S26 | Maldah | West Bengal | 1.49 | 0.16 | 0.77 | 0.33 | 0.46 | 12567 |
| S27 | North 24 Parganas | West Bengal | 0.79 | 1.22 | 0.23 | 0.83 | 0.43 | 12565 |
| S28 | Paschim Bardhaman | West Bengal | 1.34 | 0.41 | 0.56 | 1.80 | 0.33 | 12566 |
Note: C1-Andrographolide, C2-Neoandrographolide, C3-14-deoxyandrographolide, C4-14-deoxy-11,12-didehydroandrographolide and C5-Andrograpanin
Table 1: Content (%) of Five Compounds in A. paniculata Samples Collected from Different Locations
Potassium dihydrogen phosphate, ortho-phosphoric acid, HPLC grade methanol, acetonitrile and water were procured from Merck Life Science Pvt. Ltd., Mumbai, India. Reference standards including andrographolide, 14-deoxyandrographolide, andrograpanin and 14-deoxy-11,12-didehydroandrographolide (fig. 1) of purity >99 % were procured from Natural Remedies Pvt. Ltd., Bangalore, India and Neoandrographolide (fig. 1) from Cayman chemical company, Ann Arbor, Michigan, United States.
Preparation of sample and standard solution:
The aerial parts were shade dried after harvest and finely powdered using a homogenizer. The powdered samples were passed through a 250 μm sieve to obtain a fine powder. Each sample was accurately weighed to 25 mg, kept in a volumetric flask and extracted with 50 ml methanol in an ultrasonic bath for 20 min at 60°. After extraction, the sample containing solution was filtered through 0.22 μm syringe-driven filter into an HPLC vial for HPLC analysis. Stock solutions of five reference standards were prepared in methanol and kept at 4° before HPLC analysis.
HPLC instrumentation and chromatographic conditions:
A Shimadzu HPLC system (Kyoto, Japan) comprising of a binary LC-20 AD pump, an SPD-20A diode array detector, CT0-20AC column oven, CBM-20A controller and a Rheodyne 8125 injector was used for HPLC analysis. The chromatographic separation was carried out on Shimadzu Shimpak C18 column (250×4.6 mm, 5 μm) using solvent A (orthophosphate buffer, pH 2.4) and solvent B (acetonitrile) as a mobile phase with a gradient flow from pump A as 95 % for 0-17 min, 55 % for 18-24 min, 20 % for 25-34 min, 55 % for 35-39 min, 95 % for 40-45 min subsequently. The flow rate was kept at 1.5 ml/min. The injection volumes of the samples and the standard solutions were set as 20 μl. The total run time was 45 min. The PDA detector was set at 223 nm for acquiring chromatograms; the UV spectra were recorded between 190-800 nm. Before HPLC analysis, the freshly prepared HPLC mobile phase was passed through a 0.45 μm membrane filter and degassed using a sonicator. Different extraction techniques (heat reflux and ultrasonication) and extracting solvents (methanol, ethanol and water), solvent volume (10, 20 and 50 ml), extraction temperature (20, 40 and 60°) and extraction time (10, 15 and 20 min) were assessed to optimize sample preparation and extraction condition using a single factor experiment.
Method validation of HPLC fingerprint and quantitative analysis:
The developed HPLC fingerprint method was validated in terms of precision, stability and repeatability of sample solution (sample 13) as per the guidelines of State Food and Drug Administration (SFDA) of China [41]. The precision test was carried out by analysing a sample (S13) and injecting it at three different times within a day at a regular time interval and expressing the result as the relative standard deviation of Relative Retention Time (RRT) and Relative Peak Areas (RPA) of 12 common peaks with respect to reference peak 1. The stability of the sample solution was done by preparing a sample (S13) at once and injecting it at 0, 24 and 48 h. The repeatability of the sample was determined by injecting biological replicates of a sample solution (sample 13). Three replicates were injected for repeatability analysis. The method validation of quantitative analysis was carried out for linearity, Limit of Detection (LOD) and Limit of Quantification (LOQ), precision, stability, repeatability and recovery test as per the guidelines set by the International Conference on Harmonization (ICH) [42]. The LOD is the minimum concentration of an analyte at which the peak area of the signal is at least three times greater than the signal-to-noise ratio (S/N≥3). The LOQ is the lowest concentration of an analyte at which the peak area is at least ten times greater than the signal by noise ratio (S/N≥10). The precision was determined by injecting the replicate solution of each standard three times within a day. The stability test of the standard was determined by injecting the same solution of each standard for two consecutive days (0, 24, 48 h). The repeatability of each compound was determined by independently preparing three replicates of each reference standard solution. The recovery test was determined by the method of standard addition, which was done by adding a known amount of standard to the analysed sample and then reanalysing.
Establishment of HPLC fingerprint and chemometric analysis:
The HPLC chromatograms of 28 accessions of A. paniculata aerial parts collected from different geographical locations of Eastern India were analysed by the professional software similarity evaluation system for the chromatographic fingerprint of traditional Chinese medicines (version 2004A). This analysis tool is formulated by the Chinese Pharmacopoeia Committee based on the principle of measurement of correlative coefficient calculations for chromatographic fingerprints. The correlation coefficient of all the samples was calculated and the simulated mean chromatograms, as well as common fingerprint peaks were generated. Relative peak areas of common peaks were normalized, scaled and filtered before statistical analysis, then the data are mean centred with unit variance scaling for log transformed statistical analysis. HCA and PCA were performed using metaboanalyst 4.0, a comprehensive web-based metabolomics analysis tool (https://www.metaboanalyst.ca/). HCA is an unsupervised classification technique used to cluster the objects in a two-dimensional space based on similarity or difference among the sample [43]. A 12×28 matrix was formed by taking the relative peak areas of common peaks of 28 accessions of A. paniculata from different geographical origins. The Dendrogram was created using the Euclidian matrix and Ward linkage method as amalgamation rule to explore clustering patterns among the sample. PCA is an unsupervised technique widely used to reduce the dimension of the original data set without losing enough information by transforming a large no of variables into orthogonal ones known as Principal Components [44]. PCA constructed two major plots; score plot and loading plot by which, the sample can be grouped based on similar pattern and the impact of variables on clustering could be investigated [22,45]. PLS-DA is a supervised recognition tool used for the separation of samples by minimizing the variance-covariance within a group of samples and maximize variance-covariance between the groups of samples [43]. PLS-DA was carried out to enhance the group separation between the sample of Odisha and West Bengal province. PLS-DA model was validated based on multiple correlation coefficients (R2) in cross validation and permutation test by applying 1000 interactions. The significance of metabolites was ranked using variable importance in projection score from the PLS-DA model.
Results and Discussion
The present findings showed that the efficient extraction for A. paniculata was obtained in the ultrasonication at 60° with methanol (50 ml) for 20 min. All the constituents present in the A. paniculata were eluted out within 45 min. Gradient elution was tested using orthophosphate buffer-methanol and orthophosphate buffer-acetonitrile. However, the mobile phase consisting of orthophosphate buffer with pH 2.4 and acetonitrile was found to be most suitable as it gave a large number of peaks and proper resolution as compared to that of orthophosphate buffer-methanol. The better separation of the sample solution was observed at a flow rate of 1.5 ml/min. In order to get a reliable fingerprint and precise quantitative analysis of target constituents, the chromatogram was scanned in the entire UV range. A detection wavelength of 223 nm was set as the detection wavelength because of the maximum absorbance intensity of five reference compounds in standards solutions and extract.
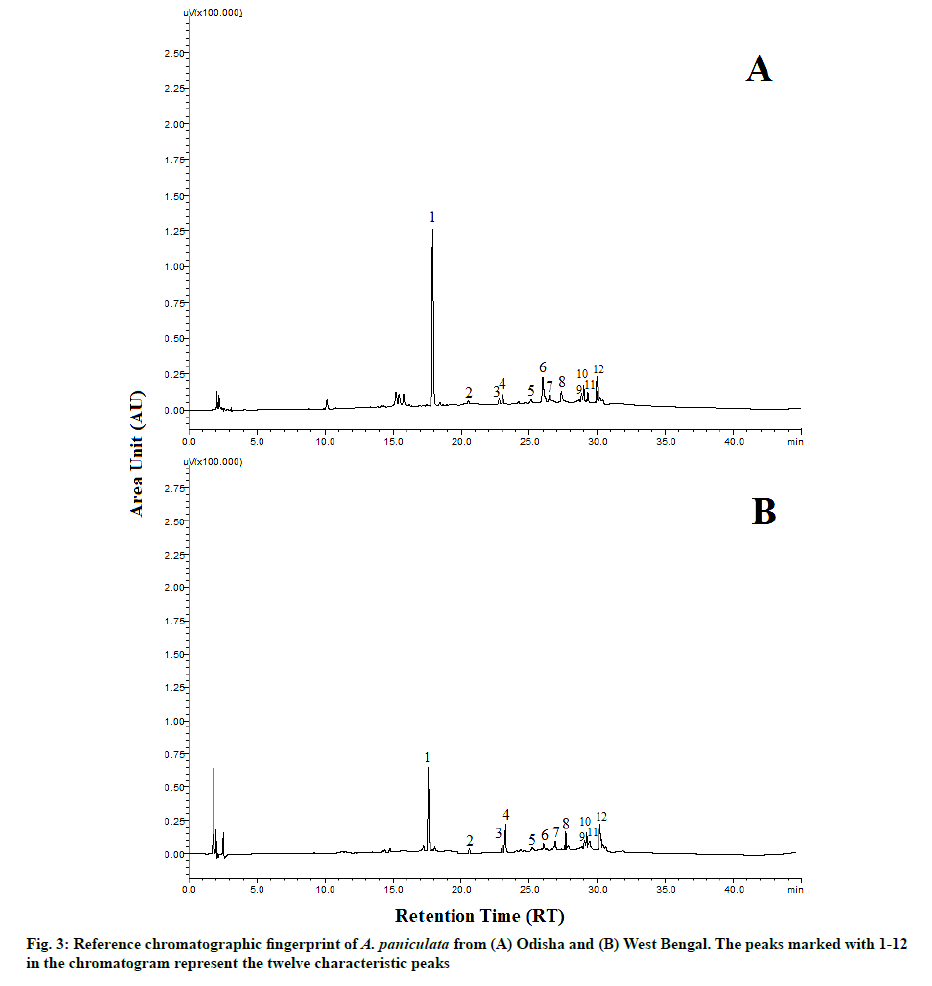
The HPLC chromatograms of A. paniculata accession collected from the different geographical locations of Odisha and West Bengal are represented in fig. 2. The reference fingerprint which was considered as standard characteristic A. paniculata of each province is shown in fig. 3. The similarity analysis revealed that the correlation coefficient values of all the samples from different regions were more than 0.90 % (Table 2). There were 12 characteristic peaks in the HPLC fingerprint as they are present in all the 28 accessions of A. paniculata. The characteristic peaks are selected as the peak having a relatively high peak area with good resolution. Out of the 12 characteristic peaks, a total of five peaks were identified namely Andrographolide (Peak 1), Neoandrographolide (Peak 2), 14-Deoxyandrographolide (peak 3), 14-deoxy-11,12-dideoxyandrographolide (peak 4) and Andrograpanin (peak 6) by comparing the ultraviolet spectra and retention time of the sample peak to that of the reference standards. The other seven characteristic fingerprint peaks were unknown. The HPLC chromatograms of five standard peaks are represented in fig. 4. Peak 1 i.e., andrographolide was selected as a reference peak because it had the highest peak area and better shape among all 12 characteristic peaks. The peak was clearly separated from other peaks and had good reproducibility. The fingerprint method was validated based on the relative retention time (the ratio of peak retention time of target constituents to the reference constituent) and the relative peak area (the ratio of peak area of sample constituents to the reference constituent). The average relative peak area and average relative retention times along with Relative Standard Deviation (RSD) were calculated which were given in Table 3. Among the twelve characteristic peaks, none of the peaks had a RSD value of RPA below 20 %. There is an evident batch-to-batch variation in the sample as they were collected from different geographical origins. Thereby we may conclude that it was not possible to monitor the RPA value; however, the RSD of RRT of twelve peaks was below 1 %.
| S. No | Similarity | S. No | Similarity | S. No | Similarity | S. No | Similarity |
|---|---|---|---|---|---|---|---|
| S1 | 0.98 | S8 | 0.99 | S15 | 0.93 | S22 | 0.97 |
| S2 | 0.97 | S9 | 0.94 | S16 | 0.93 | S23 | 0.91 |
| S3 | 0.99 | S10 | 0.99 | S17 | 0.93 | S24 | 0.99 |
| S4 | 0.95 | S11 | 0.99 | S18 | 0.94 | S25 | 0.95 |
| S5 | 0.94 | S12 | 0.98 | S19 | 0.90 | S26 | 0.96 |
| S6 | 0.97 | S13 | 0.98 | S20 | 0.93 | S27 | 0.95 |
| S7 | 0.96 | S14 | 0.92 | S21 | 0.90 | S28 | 0.92 |
Table 2: Similarities Results of Chromatogram of 28 A. paniculata Samples with Respect to their Reference Chromatogram
| Peak | Component | Average RT | RRT | Average PA | RPA | ||
|---|---|---|---|---|---|---|---|
| Average | RSD (%) | Average | RSD (%) | ||||
| 1(R) | Andrographolide | 17.84 | 1 | 0 | 371853 | 1 | 0 |
| 2 | Unknown | 18.35 | 1.02 | 0.51 | 11447 | 0.04 | 18.53 |
| 3 | Neoandrographolide | 20.49 | 1.14 | 0.47 | 9217 | 0.04 | 29.8 |
| 4 | 14-Deoxyandrographolide | 22.67 | 1.27 | 0.23 | 26846 | 0.02 | 27.47 |
| 5 | 14-Deoxy-11,12-DIAP* | 22.91 | 1.28 | 0.68 | 86730 | 0.45 | 31.38 |
| 6 | Andrograpanin | 24.91 | 1.39 | 0.32 | 39275 | 0.13 | 41.88 |
| 7 | Unknown | 26.02 | 1.45 | 0.24 | 27636 | 0.07 | 30.48 |
| 8 | Unknown | 27.01 | 1.51 | 0.51 | 93747 | 0.32 | 22.32 |
| 9 | Unknown | 28.32 | 1.58 | 0.47 | 18468 | 0.04 | 28.09 |
| 10 | Unknown | 28.48 | 1.59 | 0.62 | 30101 | 0.04 | 41.73 |
| 11 | Unknown | 28.74 | 1.61 | 0.75 | 33038 | 0.05 | 32.25 |
| 12 | Unknown | 29.36 | 1.64 | 0.19 | 147867 | 0.5 | 31.9 |
Note: *14-deoxy-11,12-didehydroandrographolide, RT-Retention Time, RRT-Relative Retention Time, PA-Peak Area, RPA-Relative Peak Area, RSD-Relative Standard Deviation
Table 3: The RT, RRT, PA AND RPA OF 12 Characteristics Fingerprint Peaks In A. paniclulata (n=28)
The method of HPLC fingerprint analysis was validated in terms of precision, repeatability and stability. The RSD values of stability, precision and repeatability tests were listed in Table 4. The overall RSD value of RRT of precision, stability and repeatability were 0.31-0.85 %, 0.22-0.91 % and 0.13-0.76 % respectively. Similarly, the overall RSD value of RPA of precision, stability and repeatability were 0.35-0.94 %, 0.83-1.98 % and 0.28- 2.06 % respectively.
| Peak no. | RSD of RRT (%) | RSD of RPA (%) | ||||
|---|---|---|---|---|---|---|
| Precision | Stability | Repeatability | Precision | Stability | Repeatability | |
| 1(R) | 0.00 | 0.00 | 0.00 | 0.00 | 0.00 | 0.00 |
| 2 | 0.75 | 0.91 | 0.30 | 0.52 | 1.23 | 0.64 |
| 3 | 0.63 | 0.57 | 0.15 | 0.81 | 1.07 | 2.06 |
| 4 | 0.31 | 0.49 | 0.13 | 0.66 | 0.93 | 1.10 |
| 5 | 0.62 | 0.83 | 0.27 | 0.43 | 1.33 | 0.67 |
| 6 | 0.29 | 0.39 | 0.61 | 0.59 | 1.98 | 0.28 |
| 7 | 0.37 | 0.84 | 0.42 | 0.94 | 1.78 | 1.61 |
| 8 | 0.46 | 0.53 | 0.33 | 0.79 | 1.07 | 2.02 |
| 9 | 0.85 | 0.37 | 0.61 | 0.93 | 1.39 | 1.05 |
| 10 | 0.42 | 0.90 | 0.48 | 0.57 | 1.28 | 0.61 |
| 11 | 0.51 | 0.37 | 0.53 | 0.35 | 1.59 | 0.72 |
| 12 | 0.48 | 0.22 | 0.76 | 0.69 | 0.83 | 0.34 |
Note: R-Reference peak; RRT-Relative Retention Time; RPA-Relative Peak Area; RSD-Relative Standard Deviation
Table 4: Analytical Results Of Precision, Stability and Repeatability of 12 Characteristics Peaks in A. paniculata Sample (Sample 13)
The linear regression equation for the individual target constituent was obtained using a calibration curve that was generated by plotting the peak area (y) against concentration (x, mg/l) of the target compound. Based on chromatographic conditions established above, the calibration curve showed good linearity (R2>0.995) for all the analytes within the tested concentration range (Table 5). The LOD and LOQ values determined for all the five compounds were in the range of 0.06 -13.41 mg/l and 0.19-40.66 mg/l respectively. The RSD values of precision for all the investigated compounds were less than 2 % (Table 6). In the stability test, it was observed that the standard solution was stable with the RSD value of investigated compounds to be less than 2 %. The RSD values of the target constituents were in the range of 0.98-1.98 % indicating that the method repeatability was suitable. Subsequently the analysis was carried out and the result of recovery for all the five compounds were in the range of 97.74-99.11 % and their RSD value was less than 3 % as shown in Table 7. The result showed that the method is accurate, valid and precise.
| Component | Linearity (mg/l) | Regression equation | R2 | LOD (mg/l) | LOQ (mg/l) |
|---|---|---|---|---|---|
| Andrographolide | 10-80 | y=38.07x+0.12 | 0.999 | 1.99 | 6.03 |
| Neoandrographolide | 3.75-60 | y=3.76x+0.01 | 0.999 | 13.41 | 40.66 |
| 14-deoxyandrographolide | 6-48 | y=8.99x+0.02 | 0.999 | 4.75 | 14.41 |
| 14-deoxy-11,12-DIAP* | 6-96 | y=16.05x+0.06 | 0.998 | 0.12 | 0.38 |
| Andrograpanin | 2.5-40 | y=13.43x+0.26 | 0.995 | 0.06 | 0.19 |
Note: *14-deoxy-11,12-didehydroandrographolide, y-Peak area; x-Concentration of the compound (mg/l); R2-Coefficient of determination; LOD-Limit of Detection; LOQ-Limit of Quantification
Table 5: Linearity, Regression Equation, R2, Lod And Loq Of Five Components
| Component | Precision (n=3) | Stability (n=3) | Repeatability (n=3) |
|
|---|---|---|---|---|
| RSD (%) | RSD (%) | RSD (%) | ||
| Andrographolide | 1.75 | 1.58 | 1.60 | |
| Neoandrographolide | 1.43 | 1.88 | 1.10 | |
| 14-deoxyandrographolide | 1.49 | 1.26 | 1.09 | |
| 14-deoxy-11,12-DIAP* | 1.85 | 1.16 | 0.98 | |
| Andrograpanin | 1.42 | 1.45 | 1.98 |
Note: *14-deoxy-11,12-didehydroandrographolide; RSD-Relative Standard Deviation
Table 6: Analytical Results of Precision, Stability, Repeatability and Recovery Rates of Five Components of A. paniculata
| Component | Original (mg/l) | Added (mg/l) | Found (mg/l) | Recovery (%) | Average Recovery (%) | RSD (%) |
|---|---|---|---|---|---|---|
| Andrographolide | 18.85 | 8.50 | 27.11 | 99.12 | 98.91 | 1.10 |
| 11.00 | 29.81 | 99.87 | ||||
| 12.00 | 30.15 | 97.73 | ||||
| Neoandrographolide | 0.9 | 1.00 | 1.88 | 98.95 | 97.79 | 1.49 |
| 2.00 | 2.85 | 98.28 | ||||
| 3.00 | 3.75 | 96.15 | ||||
| 14-deoxyandrographolide | 8.5 | 6.00 | 14.37 | 99.10 | 99.11 | 0.35 |
| 11.00 | 19.26 | 98.77 | ||||
| 14.00 | 22.38 | 99.47 | ||||
| 14-deoxy-11,12-didehydroandrographolide | 1.1 | 1.00 | 2.09 | 99.52 | 97.74 | 1.63 |
| 2.00 | 2.99 | 96.45 | ||||
| 4.00 | 4.96 | 97.25 | ||||
| Andrograpanin | 18.75 | 12.00 | 30.32 | 98.60 | 98.32 | 1.22 |
| 14.00 | 32.54 | 99.36 | ||||
| 18.00 | 35.65 | 97.01 |
Note: RSD-Relative Standard Deviation
Table 7: Recovery Rates of The Five Components of A. paniculata
The developed HPLC method was successfully applied for the quantification of andrographolide, neoandrographolide, 14-deoxyandrographolide, andrograpanin and 14-deoxy-11, 12-didehydroandrographolide in 28 accessions of A. paniculata. The identification of marker compounds in the sample chromatogram was carried out by comparing the retention times and the UV absorption spectra of reference standards. The content ranges were 0.34-5.47 % (andrographolide), 0.06-1.22 % (neoandrographolide), 0.14-3.47 % (14-deoxyandrographolide), 0.25 -4.46 % (andrograpanin) and 0.22-2.67 % (14-deoxy-11, 12-didehydroandrographolide) and the results are summarized in Table 1.
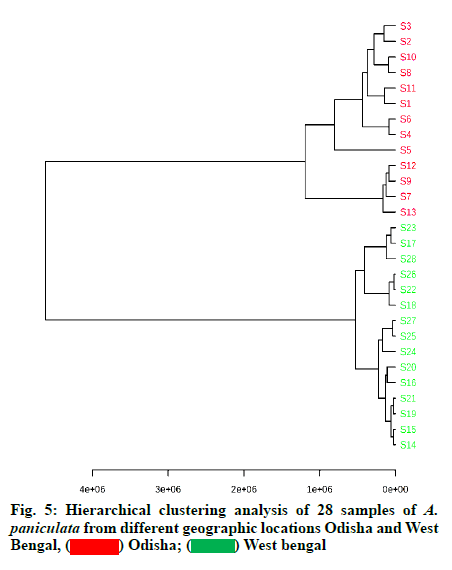
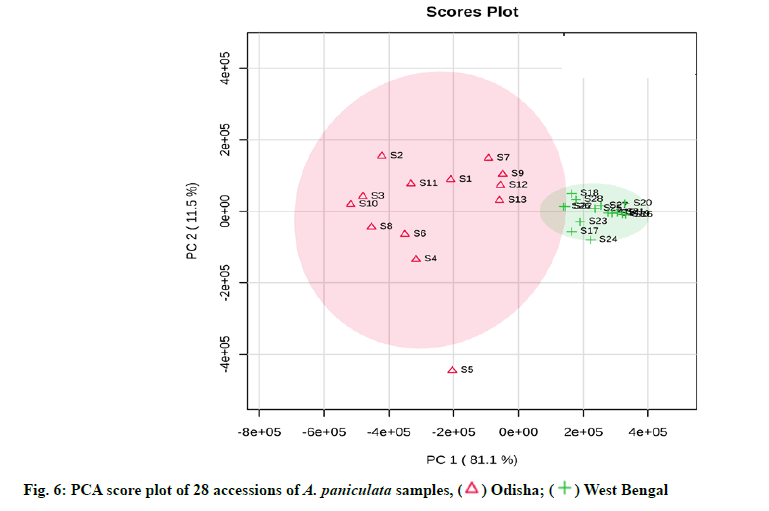
The observation from the results of HCA clearly revealed that the samples were divided into two distinct clusters (fig. 5). Cluster 1 consist of S1-S13 samples derived from Odisha province whereas cluster 2 consist of S14-S28 samples derived from West Bengal province. A dendrogram is formed separating the samples from two geographical regions. In order to further discriminate between Odisha and West Bengal samples of A. paniculata, PCA analysis was carried out by taking relative peak area of 12 characteristic peaks (12 variables) of 28 A. paniculata samples of Odisha and West Bengal province. The first two principal components explained around 92.6 % of the total variation of the dataset. The First Principal Component (PC 1) accounted for 81.1 % of total variance whereas the Second Principal Component (PC 2) explained for around 11.5 % of the total variance, respectively.
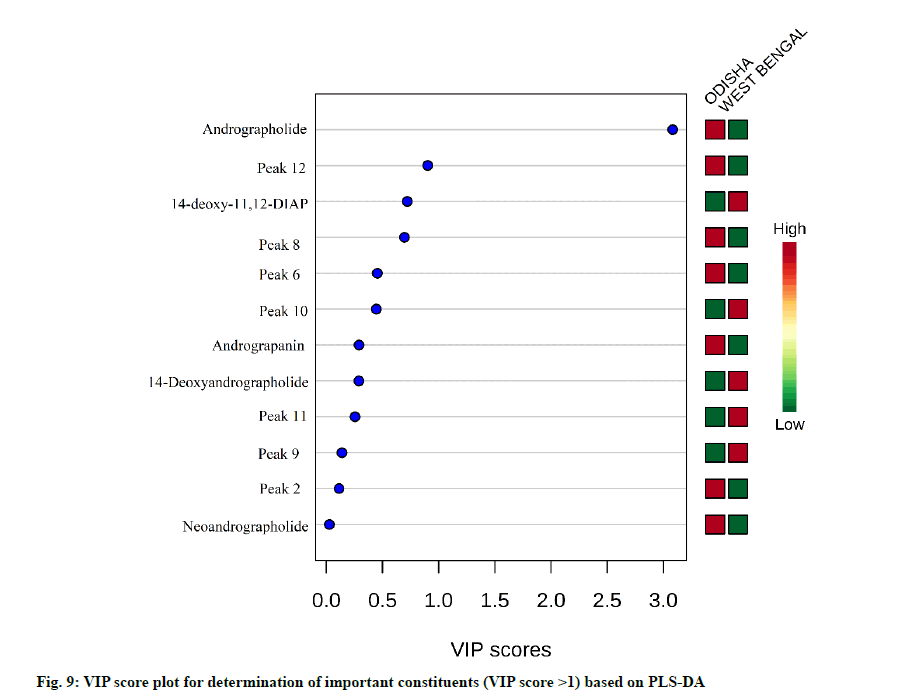
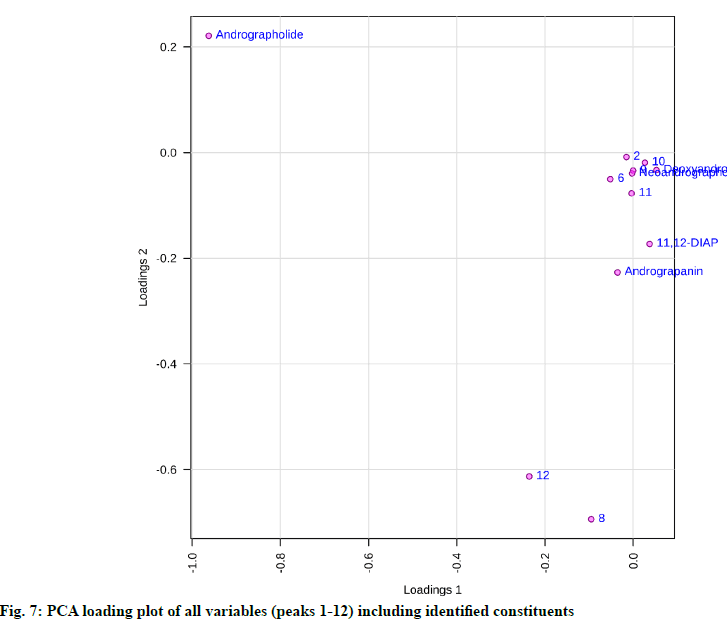
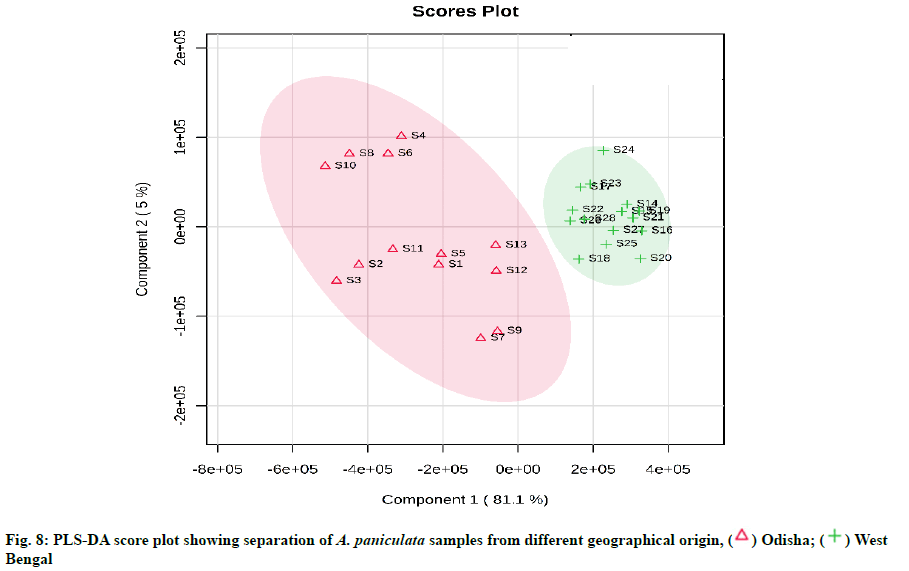
From the PCA score plot, a clear distinction between the samples of Odisha and West Bengal was observed (fig. 6). Odisha samples were located on the left side of the score plot whereas samples from West Bengal were located on the right side of the score plot. As can be seen in the loading plot that andrographolide appeared to influence the samples from Odisha (fig. 7). Additionally, the PLS-DA score plot showed better and distinct separation of samples into two groups in accordance with their origin as compared to PCA (fig. 8). Component 1 and component 2 explained around 86 % of the total variance of analysed samples. The predictive performance of the model was evaluated based on model parameters R2Y and Q2Y. The values obtained for R2Y and Q2Y were 0.96 and 0.91 computed using cross-validation. Samples with Variable Importance for the Projection (VIP)>1.5 have more influence on sample discrimination. The plot in fig. 9 showed the VIP score of all peaks, showing the influence of each peak on distinguishing between A. paniculata samples from different geographical origins.
An appropriate extraction technique and HPLC parameters are necessary for obtaining useful chemical information and getting well-separated fingerprint profiles of five reference standards and A. paniculata samples. Among the solvents used, it was found that methanol gave the best results. Previous studies have also selected methanol as the best solvent for A. paniculata extract from commonly available solvents like chloroform, water, hexane and methanol [19]. On the other hand, it was imperative to optimize the detection wavelength, mobile phase and flow rate to obtain the peak separation of the HPLC fingerprint chromatograms of A. paniculata. A detection wavelength of 223 nm and a mobile phase of orthophosphate-acetonitrile (pH 2.4) with a flow rate of 1.5 ml/min were found to be the optimum conditions for analysis. The Similarity analysis is an important criterion for HPLC fingerprinting and can be measured from the correlation coefficient of the samples [43]. Therefore, fingerprint similarity analysis of A. paniculata samples were carried out by comparing the correlation coefficient of each chromatogram to their reference chromatographic fingerprint. A correlation coefficient near to 1 suggests a high similarity value between samples. These results indicated that the chromatographic patterns were usually consistent and stable, although some peaks showed different absorption intensities. The variations of RRT and RPA in precision, stability and repeatability tests of HPLC fingerprint were less than 1 % and 3 % respectively (Table 3), indicating that the proposed HPLC fingerprint method met the national standard criteria of the fingerprint [41]. The representative pattern of the Odisha and West Bengal sample obtained in the present study could be used as a reference HPLC fingerprint to distinguish as well as to evaluate the A. paniculata samples.
The quantification data showed that the content of 5 diterpene lactones varied across the different A. paniculata samples, signifying that the geographical origin, as well as environmental factors including temperature, light, soil richness, saltiness and soil water might be the factors responsible for it. The andrographolide content in the Odisha region varied in the range of 2.68-5.47 % and in West Bengal, it was in the range of 0.33-1.49 %. Our study coincided with the results previously determined in A. paniculata accessions collected from different regions of India [10,46]. The results showed that the differences in the content of andrographolide and andrograpanin are related to the habitat in which the plants are grown. The growth stages of A. paniculata might be an another important aspect influencing the bioactive contents [47]. A recent report has also shown similar results of having significant variation of andrographolide among the states of India like Jharkhand, Madhya Pradesh, Uttar Pradesh, Karnataka, Gujarat, Haryana, Odisha and Uttarakhand. Andrographolide being a secondary metabolite may be influenced by environmental, seasonal factors and soil characteristics [48]. The content information was compared with the qualified content limit of A. paniculata stated in the United States Pharmacopeia [49], the total diterpene content (sum of andrographolide, neoandrographolide, 14-deoxy-11,12- didehydroandrographolide and andrograpanin) should not be less than 1 % (w/w) in A. paniculata dietary supplements. All the samples were (100 % of total samples) were found to be qualified. From the results of HCA, it can be inferred that the dendrogram was agreed with the visual observation of chromatograms. Samples clustered into one group are more similar in internal quality as compared to another group. Samples from Odisha had high contents of andrographolide as compared to that from West Bengal. This is likely related to the difference in soil quality and climatic factors between the two geographical provinces. The results of HCA showed that quality of different A. paniculata samples are associated with their habitat of origin. The results showed that PCA was able to distinguish between Odisha and West Bengal samples in agreement with the HCA results. The values obtained for R2Y and Q2Y indicated that the developed PLS-DA model has high goodness of fit and prediction value. The VIP score plot demonstrated andrographolide as the most influential variable on the discrimination among Odisha and West Bengal samples of A. paniculata.
The current research established an accurate and reliable method of HPLC fingerprinting for quality control and standardization of A. paniculata samples or its derived herbal products, used as drugs in various pharmaceutical industries. The 12 characteristic fingerprint peaks were highly consistent among the 28 A. paniculata accessions collected from different regions. Additionally, quantitative analysis was performed for five marker bioactive compounds i.e., andrographolide, neoandrographolide, 14-deoxyandrographolide, andrograpanin and 14-deoxy-11,12 didehydroandrographolide. The samples from Odisha were generally considered as the best quality A. paniculata as they had a higher content of andrographolide than West Bengal samples. Chemometric techniques such as HCA, PCA and PLSDA could effectively classify the samples according to their geographical origin. Samples collected from different locations of the same province are clustered into one group which implies that the qualities of samples are highly similar within one geographical province. The established chemical fingerprint combined with chemometric approaches could be useful in developing appropriate quality control models to ensure the clinical efficacy of A. paniculata extracts. Furthermore, due to the enhanced sensitivity and reliability of the developed HPLC fingerprint method, they can be used to evaluate the authenticity of the A. paniculata and their related medicinal formulations.
Acknowledgements
This work was financially supported by the Department of Biotechnology, Ministry of Science and Technology, Govt. of India (Grant No. BT/PR21604/ TRM/120/139/2016). The authors would acknowledge the financial support and encouragement of Prof. (Dr.) S.C. Si, Dean, Centre of Biotechnology and Prof. (Dr.) M.R. Nayak, President, Siksha ‘O’ Anusandhan University.
Conflict of interests::
All authors declare that they have no conflict of interest.
References
- Dai Y, Chen SR, Chai L, Zhao J, Wang Y, Wang Y. Overview of pharmacological activities of Andrographis paniculata and its major compound andrographolide. Crit Rev Food Sci and Nutr 2019;59(sup1):S17-29.
- Sudhakaran MV. Botanical pharmacognosy of Andrographis paniculata (Burm. f.) Wall. Ex. Nees. Pharmacognosy J 2012;4(32):1-10.
- Hossain MD, Urbi Z, Sule A, Rahman KM. Andrographis paniculata (Burm. f.) Wall. ex Nees: A review of ethnobotany, phytochemistry and pharmacology. Sci World J 2014;2014.
- Ghosh KB, Datta KA, Mandal A, Dubey KP, Halder S. An overview on Andrographis paniculata (Burm. f.) Nees. Int J Res Ayurveda Pharm 2012;3(5):752-60.
- Kumar RA, Sridevi K, Kumar NV, Nanduri S, Rajagopal S. Anticancer and immunostimulatory compounds from Andrographis paniculata. J Ethnopharmacol 2004;92(2-3):291-5.
- Mishra SK, Sangwan NS, Sangwan RS. Andrographis paniculata (Kalmegh): A review. Pharmacogn Rev 2007;1(2):283-98.
- Sharma M, Sharma R. Identification, purification and quantification of andrographolide from Andrographis paniculata (Burm. f.) Nees by HPTLC at different stages of life cycle of crop. J Curr Chem Pharm Sci 2013;3(1):23-32.
- Dan Y, Qian ZZ, Peng Y, Chen CQ, Liu YZ, Tai W, et al. Revision and improvement of criterion on traditional Chinese medicines in Chinese Pharmacopoeia 2015. Chin Herb Med 2016;8(3):196-208.
- Hu XY, Wu RH, Logue M, Blondel C, Lai LY, Stuart B, et al. Andrographis paniculata (Chuān Xīn Lián) for symptomatic relief of acute respiratory tract infections in adults and children: A systematic review and meta-analysis. PloS one 2017;12(8):e0181780.
- Raina AP, Gupta V, Sivaraj N, Dutta M. Andrographis paniculata (Burm. f.) Wall. ex Nees (kalmegh), a traditional hepatoprotective drug from India. Genet Resour Crop Evol 2013;60(3):1181-9.
- Majumdar M, Misra TK, Roy DN. In vitro anti-biofilm activity of 14-deoxy-11,12-didehydroandrographolide from Andrographis paniculata against Pseudomonas aeruginosa. Braz J Microbiol 2020;51(1):15-27.
- Lin HC, Li CC, Yang YC, Chiu TH, Liu KL, Lii CK, et al. Andrographis paniculata diterpenoids and ethanolic extract inhibit TNFα-induced ICAM-1 expression in EA. hy926 cells. Phytomedicine 2019;52:157-67.
- Maity GN, Maity P, Dasgupta A, Acharya K, Dalai S, Mondal S. Structural and antioxidant studies of a new arabinoxylan from green stem Andrographis paniculata (Kalmegh). Carbohydr Polym 2019;212:297-303.
- Villedieu-Percheron E, Ferreira V, Campos JF, Destandau E, Pichon C, Berteina-Raboin S. Quantitative determination of Andrographolide and related compounds in Andrographis paniculata extracts and biological evaluation of their Anti-Inflammatory Activity. Foods 2019;8(12):683.
- Worasuttayangkurn L, Nakareangrit W, Kwangjai J, Sritangos P, Pholphana N, Watcharasit P, et al. Acute oral toxicity evaluation of Andrographis paniculata-standardized first true leaf ethanolic extract. Toxicol Rep 2019;6:426-30.
- Chao WW, Lin BF. Isolation and identification of bioactive compounds in Andrographis paniculata (Chuanxinlian). Chin Med 2010;5(1):1-17.
- Dong HJ, Zhang ZJ, Yu J, Liu Y, Xu FG. Chemical fingerprinting of Andrographis paniculata (Burm. f.) Nees by HPLC and hierarchical clustering analysis. J Chromatogr Sci 2009;47:931-5.
- Chen LX, He H, Xia GY, Zhou KL, Qiu F. A new flavonoid from the aerial parts of Andrographis paniculata. Nat Prod Res 2014;28(3):138-43.
- Srivastava A, Misra H, Verma RK, Gupta MM. Chemical fingerprinting of Andrographis paniculata using HPLC, HPTLC and densitometry. Phytochem Anal 2004;15(5):280-5.
- Zhao Y, Kao CP, Wu KC, Liao CR, Ho YL, Chang YS. Chemical compositions, chromatographic fingerprints and antioxidant activities of Andrographis Herba. Molecules 2014;19(11):18332-50.
- Sharma SN, Jha Z, Sharma DK. Chemometrics evaluation of the herbal drug Andrographis paniculata. Nat Prod Commun 2011;6(12):1929-32.
- Viapiana A, Struck-Lewicka W, Konieczynski P, Wesolowski M, Kaliszan R. An approach based on HPLC-fingerprint and chemometrics to quality consistency evaluation of Matricaria chamomilla L. commercial samples. Front Plant Sci 2016;7:1561.
- Yang L, Wen KS, Ruan X, Zhao YX, Wei F, Wang Q. Response of plant secondary metabolites to environmental factors. Molecules 2018;23(4):762.
- Guidelines for the assessment of herbal medicines. World Health Organization; 1991.
- FDA guidance for industry-botanical drug products (draft guidance). US Food and Drug Administration: Rockville, WA, USA; 2000.
- European Medicines Agency. Note for guidance on quality of herbal medicinal products 2001:6.
- Feng X, Kong W, Wei J, Ou-Yang Z, Yang M. HPLC fingerprint analysis combined with chemometrics for pattern recognition of ginger. Pharm Biol 2014;52(3):362-7.
- Jin XF, Lu YH, Wei DZ, Wang ZT. Chemical fingerprint and quantitative analysis of Salvia plebeia R. Br. by high-performance liquid chromatography. J Pharma Biomed Anal 2008;48(1):100-4.
- Lazarowych NJ, Pekos P. Use of fingerprinting and marker compounds for identification and standardization of botanical drugs: strategies for applying pharmaceutical HPLC analysis to herbal products. Drug Inf J 1998;32(2):497-512.
- Li F, Yuan B, Xiong Z, Lu X, Qin F, Chen H, et al. Fingerprint analysis of Flos Lonicerae japonicae using binary HPLC profiling. Biomed Chromatogr 2006;20(6‐7):634-41.
- Lu GH, Chan K, Liang YZ, Leung K, Chan CL, Jiang ZH, et al. Development of high-performance liquid chromatographic fingerprints for distinguishing Chinese Angelica from related umbelliferae herbs. J Chromatogr A 2005;1073(1-2):383-92.
- Ma C, Wang H, Lu X, Xu G, Liu B. Metabolic fingerprinting investigation of Artemisia annua L. in different stages of development by gas chromatography and gas chromatography–mass spectrometry. J Chromatogr A 2008;1186(1-2):412-9.
- Frommenwiler DA, Booker A, Vila R, Heinrich M, Reich E, Cañigueral S. Comprehensive HPTLC fingerprinting as a tool for a simplified analysis of purity of ginkgo products. J Ethnopharmacol 2019;243:112084.
- Sun Y, Guo T, Sui Y, Li F. Fingerprint analysis of Flos carthami by capillary electrophoresis. J Chromatogr B 2003;792(2):147-52.
- Ren X, Liang Y, Li X, Yi H, Zhang Z. Chemical fingerprint analysis for quality control of Herba Ephedrae based on HPLC-DAD combined with chemometrics methods. Anal Lett 2012;45(13):1824-35.
- Cheng XM, Zhao T, Yang T, Wang CH, Bligh SA, Wang ZT. HPLC fingerprints combined with principal component analysis, hierarchical cluster analysis and linear discriminant analysis for the classification and differentiation of Peganum sp. indigenous to China. Phytochem Anal 2010;21(3):279-89.
- Liu X, Zhan H, Qiao Z, Zheng M, Liu W, Feng F, et al. Chemometric analysis based on HPLC multi-wavelength fingerprints for prediction of antioxidant components in Turpiniae folium. Chemom Intell Lab 2016;152:54-61.
- Rivera-Mondragón A, Bijttebier S, Tuenter E, Custers D, Ortíz OO, Pieters L, et al. Phytochemical characterization and comparative studies of four Cecropia species collected in Panama using multivariate data analysis. Sci Rep 2019;9(1):1-4.
- Mandrone M, Bonvicini F, Lianza M, Sanna C, Maxia A, Gentilomi GA, et al. Sardinian plants with antimicrobial potential. Biological screening with multivariate data treatment of thirty-six extracts. Ind Crops Prod 2019;137:557-65.
- Wang L, Wang X, Kong L. Automatic authentication and distinction of Epimedium koreanum and Epimedium wushanense with HPLC fingerprint analysis assisted by pattern recognition techniques. Biochem Syst Ecol 2012;40:138-45.
- Guidance for Experimental Research on HPLC Fingerprint of traditional Chinese Injections (Draft). State Food and Drug Administration of China. Beijing: China; 2000.
- Food and Drug Administration, Centre for Drug Evaluation and Research, Centre for Biologics Evaluation and Research. ICHF Guidance for industry: Q2B validation of analytical procedures: Methodology; 1996.
- Chen Y, Zhu SB, Xie MY, Nie SP, Liu W, Li C, et al. Quality control and original discrimination of Ganoderma lucidum based on high-performance liquid chromatographic fingerprints and combined chemometrics methods. Anal Chim Acta 2008;623(2):146-56.
- Ray A, Jena S, Kar B, Sahoo A, Panda PC, Nayak S, et al. Volatile metabolite profiling of ten Hedychium species by gas chromatography mass spectrometry coupled to chemometrics. Ind Crop Prod 2018;126:135-42.
- Ray A, Jena S, Dash B, Kar B, Halder T, Chatterjee T, et al. Chemical diversity, antioxidant and antimicrobial activities of the essential oils from Indian populations of Hedychium coronarium Koen. Ind Crop Prod 2018;112:353-62.
- Mishra S, Tiwary SK, Kakkar A, Pandey AK. Chemoprofiling of Andrographis paniculata (kalmegh) for its andrographolide content in Madhya Pradesh, India. Int J Pharma Bio Sci 2010;1:1-5.
- Pholphana N, Rangkadilok N, Saehun J, Ritruechai S, Satayavivad J. Changes in the contents of four active diterpenoids at different growth stages in Andrographis paniculata (Burm. f.) Nees (Chuanxinlian). Chin Med 2013;8(1):1-12.
- Pandey AK, Gulati S, Gupta A, Tripathi YC. Variation in andrographolide content among different accessions of Andrographis paniculata. Pharma Innov J 2019;8(4):140-4.
- United States Pharmacopeial Convention, Rockville, MD; 2016.
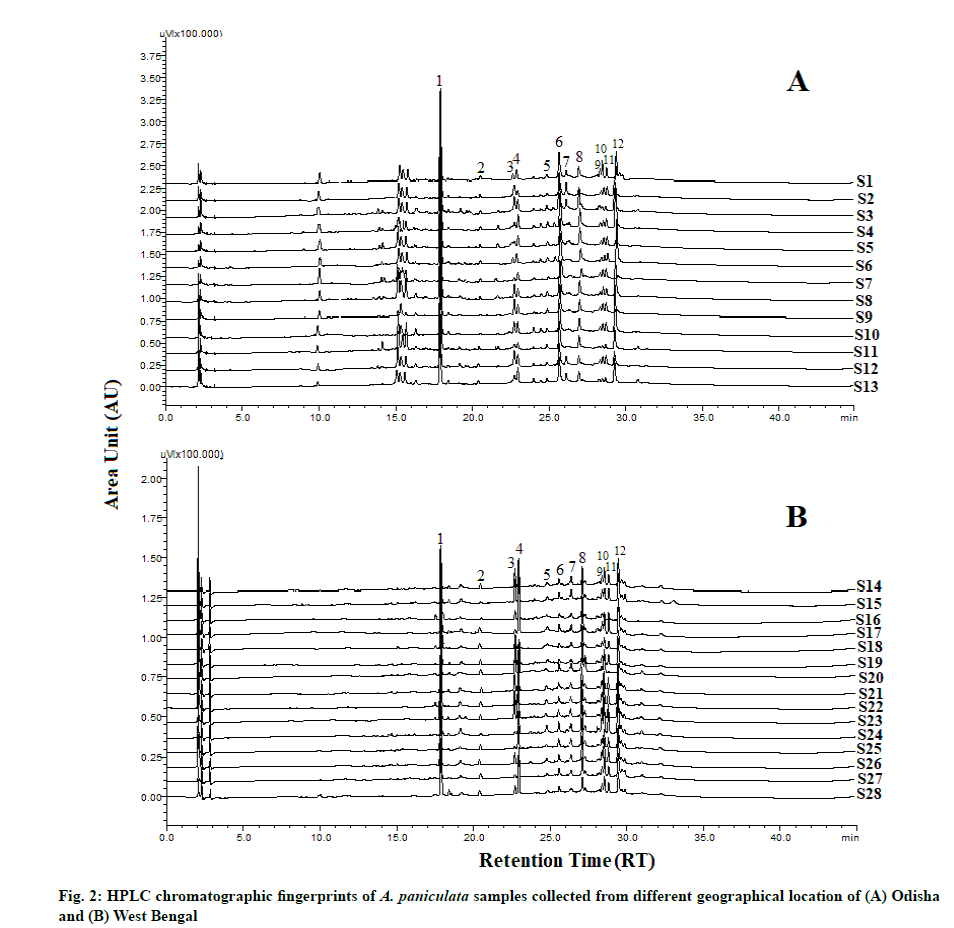

 ) Odisha; (
 ) West bengal
 ) Odisha; (
 ) West Bengal
 ) Odisha; (
  ) West
Bengal