- *Corresponding Author:
- C. Y. Guo
Department of Pharmacy, HeBei North University, Zhangjiakou, 075000, China
E-mail: guochy0311@163.com
| Date of Submission | 15 November 2013 |
| Date of Revision | 30 October 2014 |
| Date of Acceptance | 15 March 2015 |
| Indian J Pharm Sci 2015; 77(2):163-169 |
Abstract
Inula helenium has been reported to contain a large amount of phenolic compounds, which have shown promise in scavenging free radicals and prevention of neurodegenerative diseases. This study is to investigate the neuroprotective effects of total phenolic compounds from I. helenium on hydrogen peroxide-induced oxidative damage in human SH-SY5Y cells. Antioxidant capacity of total phenolic compounds was determined by radical scavenging activity, the level of intracellular reactive oxygen species and superoxide dismutase activity. The cytotoxicity of total phenolic compounds was determined using a cell counting kit-8 assay. The effect of total phenolic compounds on cell apoptosis due to hydrogen peroxide-induced oxidative damage was detected by Hoechst 33258 and Annexin-V/PI staining using fluorescence microscope and flow cytometry, respectively. Mitochondrial function was evaluated using the mitochondrial membrane potential and mitochondrial ATP synthesis by JC-1 dye and high performance liquid chromatography, respectively. It was shown that hydrogen peroxide significantly induced the loss of cell viability, increment of apoptosis, formation of reactive oxygen species, reduction of superoxide dismutase activity, decrease in mitochondrial membrane potential and a decrease in adenosine triphosphate production. On the other hand, total phenolic compounds dose-dependently reversed these effects. This study suggests that total phenolic compounds exert neuroprotective effects against hydrogen peroxide-induced oxidative damage via blocking reactive oxygen species production and improving mitochondrial function. The potential of total phenolic compounds and its neuroprotective mechanisms in attenuating hydrogen peroxide-induced oxidative stress-related cytotoxicity is worth further exploration.
Keywords
Total phenolic compounds, hydrogen peroxide, SH‑SY5Y, apoptosis, neurodegenerative disease, neuroprotection
A characteristic of many neurodegenerative diseases, which include stroke, Alzheimer’s disease, Parkinson’s disease and amyotrophic lateral sclerosis, is neuronal cell death. The incidence of neurodegenerative disease surges, especially in the aging population. Although the definite etiology and pathogenesis are not very clear, many studies show that oxidative stress has been implicated in many neurological diseases [1‑5].
Oxidative stress is characterized by an overproduction of reactive oxygen species (ROS), which generate an oxidative burst of intracellular signaling cascades that induces cell death [6‑8]. ROS is known to induce the destruction of biomolecules, such as lipids, proteins, and DNA [8,9]. Hydrogen peroxide (H2O2) is a well‑known ROS that is formed during normal metabolism and is easily converted to hydroxyl radical which cause damage to many cellular components or even cell death [10,11]. Exposure of many different cell types to H2O2 caused a rapid increase in ROS production [12], thus inducing apoptosis. It has been reported that H2O2 plays an important role in neuron damage and even death [11,13]. Human neuroblastoma SH‑SY5Y cell line is widely used as an in vitro model for studying oxidative stress‑induced neuronal cell death [14]. Many antioxidant co12mpounds can prevent oxidative stress‑related disorders by scavenging ROS [15].
Recent studies have indicated that phenolic compounds have many effects, including antioxidant [16‑19]. However, no relevant work on the protective effect of extract of total phenolic compounds (TPC) from Inula helenium on H2O2‑induced oxidative stress in SH‑SY5Y cells has been reported in the literature. We hypothesized that, in view of TPC’s high antioxidant bioactives and effects on oxidative stress, TPC could protect against H2O2‑induced oxidative stress in SH‑SY5Y cells.
In this study, we evaluated the neuroprotective effects of TPC on H2O2‑induced oxidative stress in SH‑SY5Y cells in vitro. This study demonstrates that TPC extract, diluted in serum‑free medium for 24 h, potently attenuated H2O2‑induced cell viability loss and cell apoptosis. In addition, TPC can ameliorate the increases intracellular ROS, decrease in mitochondrial membrane potential and ATP induced by H2O2‑treatment.
Materials and Methods
Hydrogen peroxide was purchased from Tianjin Kermel Chemical Reagent Co. Ltd. Dulbecco’s Modified Eagle Medium (DMEM), Ham’s nutrient mixture F‑12 (F‑12), fetal bovine serum (FBS) and trypsin‑EDTA solution from Gibco Chemical Co., Gentamicin and phosphate buffer saline solution (PBS) from Nanjing Kezheng Biotech Co. Ltd. Dimethyl sulfoxide (DMSO) from Nanjing Kezheng Chemical Co. Ltd. Cell counting kit‑8 (CCK‑8), cell cycle and apoptosis analysis kit, ROS assay kit, JC‑1 from Beyotime Institute of Biotechnology. SOD assay kit was purchased from NanJing JianCheng Bioengineering Institute. Adenosine 5’‑triphosphate (ATP) was purchased from Sigma Co. Ltd.
Extraction and purification of TPC
TPC from I. helenium was extracted according to our previous study [20]. Briefly, the dried powder of I. helenium (5.0 g) was mixed with 100 ml 30% ethanol in a 250 ml conical flask and extracted in an ultrasonic bath for 60 min. The ethanol extract was partitioned with petroleum ether, dichloromethane, and ethyl acetate, successively and then purified by silica gel column and thin‑layer chromatography.
TPC content analysis
TPC contents in the extracts were measured by using the Folin‑Ciocalteu method [21]. Briefly, 5 mg of TPC extracts were dissolved in 1 ml of 30% ethanol. The solutions (0.2 ml) were individually mixed with Folin‑Ciocalteu reagent (0.5 ml) and 7.5% sodium carbonate solution (5.0 ml). The mixture was then diluted to 10 ml with distilled water, and then incubated at 37° for 30 min. The absorbance of the solution was measured at 760 nm using a UV/Vis spectrophotometer (model 2100, Labtech, American). The TPC content was 3.12 mg/g (expressed as gallic acid equivalents in milligrams per gram of sample).
Hydroxyl radical scavenging assay
Hydroxyl Radical (·OH) is the most reactive and can damage numerous biomolecules. ·OH scavenging assay was performed by Fenton’s reagent (Fe (II)/H2O2) [22]. Reaction solution consisted of 1,10‑phenanthroline 0.5 ml (3.75 mM) and ferrous sulfate 0.5 ml (0.75 mM) in phosphate buffer (20 mM, pH 7.4), 0.5 ml H2O2 (30 mM) and various concentrations of extract solution. Extract solution (0.5 ml) was added to the reaction solution and incubated for 40 min at 37°, and then allowed to cool. Absorbance was measured at 510 nm and scavenging activity of hydroxyl radical was calculated.
1,1‑Diphenyl‑2‑picrylhydrazyl radical scavenging assay
DPPH radical scavenging activity was determined as previously reported by Teugwa et al. [23] Various concentrations of the extract were diluted with the extraction solvent, then 100 μl of sample solution was mixed with 100 μl DPPH solution in ethanol (40 mM). The mixture was immediately shaken for 20 s on a vortex mixer, and then incubated at 37° water bath for 30 min. The absorbance of the sample was measured at 517 nm against a blank. The radical scavenging activity was calculated.
Cell culture and treatment
SH‑SY5Y cells were purchased from Cell Resource Center of Institute of Basic Medical Sciences of Chinese Academy of Medical Sciences. Cells were incubated in Dulbecco’s Modified Eagle Medium (DMEM)/F12 (1:1) supplemented with 10% fetal bovine serum and 100 U/ml gentamicin. Cells were maintained at 37° containing humidified 95% air and 5% CO2. The cells were seeded at appropriate densities and incubated for 24 h before conducting the desired experiment. Concentrations of 200 μM H2O2 were used in the subsequent study after 24 h of exposure. Appropriate concentrations of TPC were treated 1 h before treatment with H2O2. Samples without H2O2 were used as normal control.
Cell viability using CCK‑8 assay
The ability of TPC to protect human SH‑SY5Y cells from H2O2 was determined by the Cell Counting Kit‑8 (CCK‑8) assay (Beyotime Institute of Biotechnology) using a 96 wells plate according to the manufacturer’s instructions. Briefly, cultured human neuroblastoma (SH‑SY5Y) cells were subjected to oxidative damage with H2O2 in the presence and absence of 0.5 and 5.0 μg/ml TPC. The absorbance of the samples was measured in an automatic microplate reader.
Morphological analysis using inverted phase contrast microscope
SH‑SY5Y cells were seeded into 6‑well culture plates at a density of 1×10⁵ cells/ml. Cells were treated with TPC at concentrations of 0.5 and 5 μg/ml for 1 h before exposing them to 200 μM H2O2. The cellular morphology was observed using inverted phase contrast microscope (Nikon, Tokyo).
Hoechst staining using fluorescence microscope
Hoechst staining was used to visualize nuclear changes and apoptotic body formation that is characteristic of apoptosis [24]. SH‑SY5Y cells (1×10⁵ cells/ml) were seeded, treated with TPC and 200 μM H2O2 as previously described. Cells were fixed and stained with 2 μg of Hoechst 33258. After incubation for 5 min in the dark, the cells were washed, and observed under a fluorescence microscope (ECLIPSE Ti‑U, Nikon, Japan).
Annexin V‑FITC/PI staining using flow cytometric
SH‑SY5Y cells were double‑stained using Annexin V‑FITC/PI apoptosis detection kit according to the manufacturer’s instructions. Samples stained with Annexin V and PI were quantitatively analyzed using BD FACS Calibur Flow Cytometer with Summit FCM software.
Measurement of intracellular ROS
Production of ROS was monitored spectrofluorometrically and a fluorescence microscope using 2’,7’‑dichlorodihydrofluorescein diacetate (DCFH‑DA). A final concentration of 10 μM DCFH‑DA was added to each well in a 6 well plate. The cells were incubated at 37° for 2 h and then washed three times with phosphate buffer saline (PBS). DCFH‑DA for reactive oxygen species (ROS) were determined by Spectra Max Multilabel microplate reader and fluorescence microscope.
SOD enzyme activity
Following incubation for 24 h with H2O2, the SH‑SY5Y cells were collected from cell culture flask. Then lysis buffer (50 mMTris‑HCl (pH 6.8), 100 mM DTT, 2% SDS, 10% glycerol) was added, followed by centrifugation at 1000 rpm for 15 min at 4°. SOD was measured at 550 nm by a spectraMax M2 microplate reader (Molecular Devices, American) as per manufacturer’s instructions. SOD activity was expressed as units per mg of protein.
Measurement of mitochondrion membrane potential using the JC‑1 dye
The changes in mitochondrion membrane potential induced by H2O2 were measured using the lipophilic cation 5,5',6,6'‑tetrachloro‑1,1',3,3'‑ tetraethylbenzimidazolcarbocyanine iodide (JC‑1) dye [25]. Briefly, experimental and control cells were treated with the 2.5 μg/ml JC‑1 dye for 20 min before observation at excitation wavelength 490 nm and emission wavelength 530 nm using a Spectra Max fluorescence microscope (Molecular Devices, American).
Statistical analysis
Results are expressed as means±SD. The data were statistically analyzed by one‑way analysis of variance (ANOVA) using a statistical package program (SPSS 17.0); P<0.05 was considered as statistically significant.
Results and Discussion
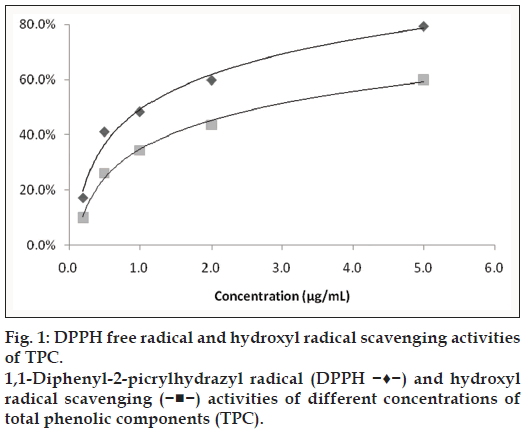
As can be seen from fig. 1, the DPPH scavenging activity and hydroxyl radical scavenging activity of TPC was concentration‑dependent. DPPH free radical clearance rate achieved from 41.1 to 79.3% when concentration of TPC ranged from 0.5 to 5 μg/ml; similarly, hydroxyl radical clearance rate achieved from 26.2 to 60.1% when concentration of TPC was from 0.5 to 5 μg/ml. These results show that TPC has high DPPH free radical and hydroxyl radical scavenging activities.
As reported in our earlier publication [26], the viability of SH‑SY5Y cells incubated with 200 μM H2O2 for 24 h decreased by 35% compared to the control. 200 μM H2O2 could produce a certain degree of apoptotic cells, but not a lot of deaths. Therefore, a concentration of 200 μM H2O2 treatment for 24 h for subsequent experiments that were intended to investigate the protective effects of TPC against H2O2‑induced cytotoxicity in SH‑SY5Y cells.
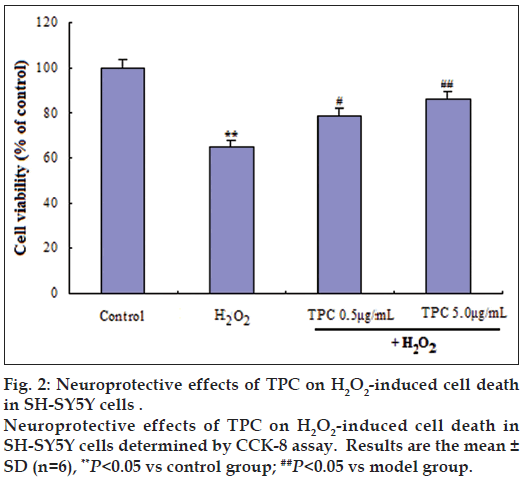
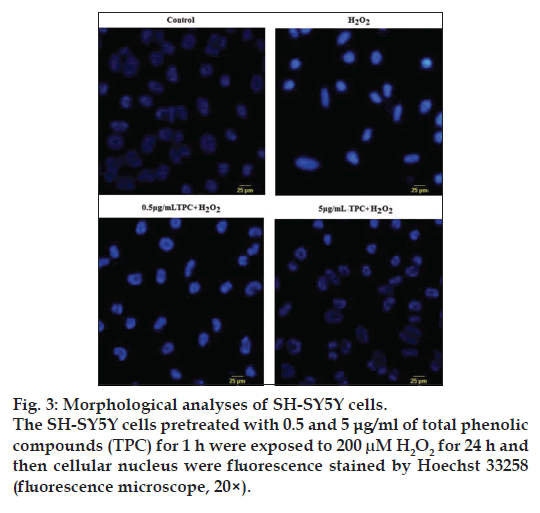
To assess the possible toxic effects, the cells were treated within a concentration range of 0.5‑50 μg/ml TPC for 24 h. The results obtained from our previous study [26] showed that 0.5‑10 μg/ml of TPC was nontoxic to SH‑SY5Y cells according to cell viability. To further determine the neuroprotective effects of TPC, SH‑SY5Y cells were treated with concentrations of 0.5 and 5 μg/ml TPC for 1 h and then challenged with 200 μM H2O2. A final concentration of 0.5 and 5 μg/ml TPC significantly ameliorated the reduced cell viability induced by H2O2 (fig. 2). Further, the cell morphological changes were observed using inverted phase contrast microscope. The Incubation with 200 μM H2O2-induced cell shrinkage. Hoechst 33258 staining showed apoptotic morphological alteration (fig. 3).
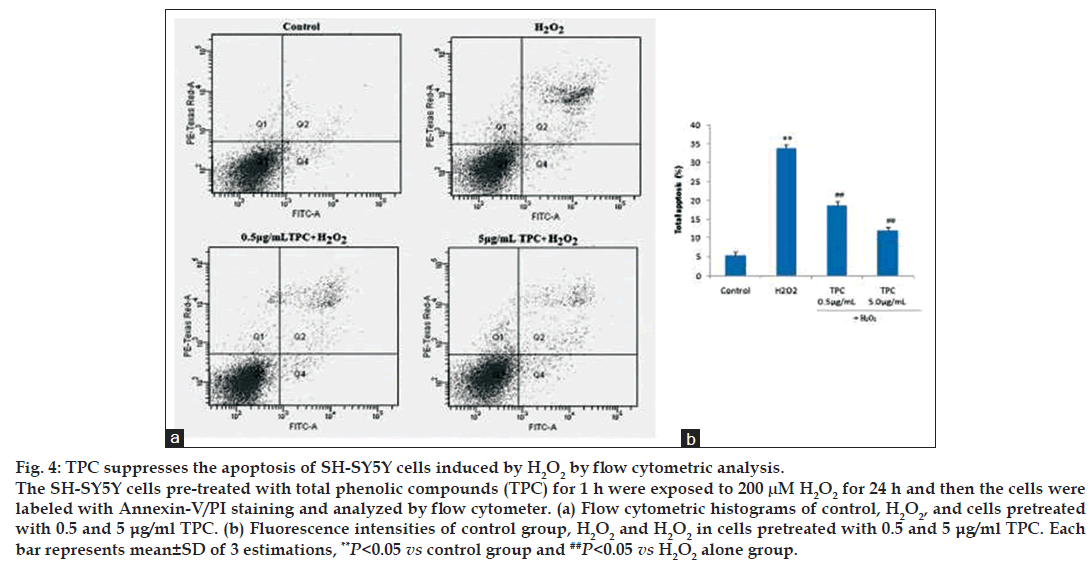
Apoptotic and necrotic changes in the cells were determined morphologically by flow cytometry with Annexin V‑FITC/PI staining. The effects of TPC on early and late apoptosis/necrosis induced by H2O2 were detected using Annexin V/PI staining as previously described [27]. FITC‑conjugated Annexin V is a marker for apoptosis and PI is an indicator of necrotic cells [28]. Treated cells with H2O2 significantly increased the percentage of apoptotic and necrotic cells. Simultaneous TPC pretreatment of cells significantly reduced the number of cells labeled with FITC‑conjugated Annexin V and decreased markedly the percentage of apoptotic cells (fig. 4).
Figure 4: TPC suppresses the apoptosis of SH-SY5Y cells induced by H2O2 by flow cytometric analysis.
The SH-SY5Y cells pre-treated with total phenolic compounds (TPC) for 1 h were exposed to 200 μM H2O2 for 24 h and then the cells were labeled with Annexin-V/PI staining and analyzed by flow cytometer. (a) Flow cytometric histograms of control, H2O2, and cells pretreated with 0.5 and 5 μg/ml TPC. (b) Fluorescence intensities of control group, H2O2 and H2O2 in cells pretreated with 0.5 and 5 μg/ml TPC. Each bar represents mean±SD of 3 estimations, **P<0.05 vs control group and ##P<0.05 vs H2O2 alone group.
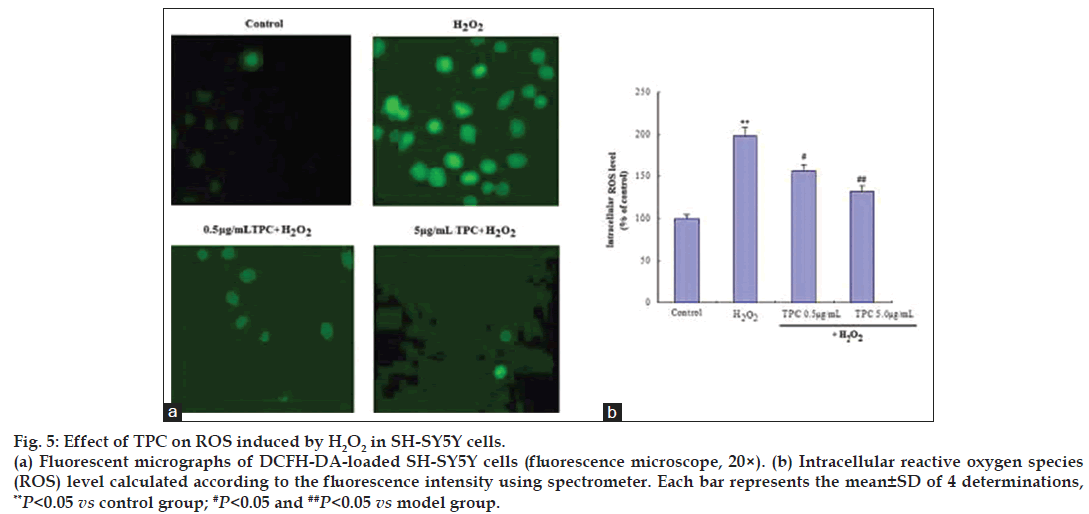
We further determined the intracellular ROS scavenging activities of TPC by DCFH‑DA‑loaded SH‑SY5Y cells. As shown in fig. 5, treatment of SH‑SY5Y cells with 200 μM H2O2 led to a significant increase in intracellular ROS levels compared to normal controls. The fluorescence intensity of the mean oxidized dichlorofluorescein (DCF) was increased to 198% compared to controls after 200 μM H2O2 treatment in SH‑SY5Y cells, while TPC alleviated the ROS accumulation in a dose dependent manner (fig. 5). This result shows that TPC inhibits H2O2‑induced ROS production in SH‑SY5Y cells in a dose‑dependent manner.
Figure 5: Effect of TPC on ROS induced by H2O2 in SH-SY5Y cells.
(a) Fluorescent micrographs of DCFH-DA-loaded SH-SY5Y cells (fluorescence microscope, 20×). (b) Intracellular reactive oxygen species (ROS) level calculated according to the fluorescence intensity using pectrometer. Each bar represents the mean±SD of 4 determinations, **P<0.05 vs control group; #P<0.05 and ##P<0.05 vs model group.
It is well known that the highly ROS can damage NADH dehydrogenase and ATP synthase, resulting in the shutdown of mitochondrial energy production. Also, ROS leads to changes in mitochondrial membrane permeability. We further determined MMP and ATP. As shown in fig. 6, H2O2 significantly induced the decrease of MMP and the decrease of ATP production. On the other hand, TPC dose dependently reversed these effects. SOD activity was decreased to 48% of control levels after H2O2 treatment (P<0.05). TPC treatment significantly prevented H2O2‑induced decrease in SOD activity in a dose‑dependent manner (P<0.05, Table 1).
| Samples | SOD (U/mg of protein) |
|---|---|
| Control | 47.78 ± 4.52 |
| 200 μM H2O2 | 22.96 ± 3.23* |
| TPC 0.5 μg/ml+200 μM H2O2 | 31.04 ± 3.01# |
| TPC 5.0 μg/ml+200 μM H2O2 | 44.89 ± 2.97# |
Table 1: Effects of tpc on sod activity in Sh-sy5y cells exposed to H2O2
Mitochondrial signal transduction is one of apoptotic signal conduction pathways. Mitochondrial membrane potential (MMP) provides a valuable indicator of cells’ health and functional status [29]. As shown in fig. 6, MMP decreased in SH‑SY5Y cells after exposure to 200 μM H2O2 for 24 h relative to the control group. TPC pretreatment significantly inhibited the decrease of MMP and decrease in ATP production. The results indicated that TPC inhibited H2O2‑induced apoptosis through mitochondrial signal transduction pathway.
Neurodegenerative diseases have been related to oxidative stress, which plays a pivotal role in the regulation of cell death. H2O2 can serve as an oxidative inducer in the model of oxidative stress, and H2O2‑induced oxidative stress plays a causal role in the induction of apoptosis. It is known that mitochondria are key intracellular organelles that play prominent roles in energy metabolism ROS generation, and apoptosis‑programmed cell death [30]. The present study reveals the neuroprotective effects of TPC on H2O2‑induced oxidative injury in SH‑SY5Y cells through a modulation function of mitochondria.
Interestingly, cellular signalling pathways are regulated by the intracellular redox state and the ROS produced stimulate the cell death machinery [31]. SODs represent the first line of defense against oxidative stress, which is considered an essential factor in several neurodegenerative diseases [32]. To confirm the role of TPC in H2O2‑related redox regulation, we further determined ROS (using DCFH‑DA) and SODs (using nitroblue tetrazolium chloride as chromogen at 560 nm). As shown in fig. 5 and Table 1, H2O2 significantly induced the increase of intracellular ROS and the reduction of SOD activity; 0.5‑5 μg/ml TPC significantly inhibited the increase in ROS and reduction of SOD activity. Our results suggest that scavenging ROS may be one of the mechanisms in the neuroprotective effects of TPC. Several evidences support an essential role for oxidative stress in the development of SH‑SY5Y cell dysfunction [33].
In summary, TPC exerts neuroprotective effects against H2O2‑induced oxidative damage via scavenging free radical, blocking ROS production, the reduction of SOD activity, decrease of MMP and a decrease in ATP production. The potential of TPC and its neuroprotective mechanisms in attenuating H2O2‑induced oxidative stress‑related cytotoxicity is worth further exploration.
References
- Friedlander RM. Apoptosis and caspases in neurodegenerative diseases. N Engl J Med 2003;348:1365-75.
- Gutowski M, Kowalczyk S. A study of free radical chemistry: Their role and pathophysiological significance. ActaBiochim Pol 2013;60:1-16
- Xu S, Zhang R, Niu J, Cui D, Xie B, Zhang B. et al.Oxidative StressMediated-Alterations of the MicroRNA Expression Profile in Mouse Hippocampal Neurons. Int J MolSci 2012;13:16945-60.
- Sas K, Robotka H, Toldi J, Vécsei L. Mitochondria, metabolic disturbances, oxidative stress and the kynurenine system, with focus on neurodegenerative disorders. J NeurolSci 2007;25:221-39.
- Abeliovich A. Parkinson’s disease: Mitochondrial damage control. Nature 2010;463:744-5.
- Mancuso C, Scapagnini G, Currò D, Giuffrida Stella AM, De Marco C, Butterfield DA, et al.Mitochondrial dysfunction, free radical generation and cellular stress response in neurodegenerative disorders. Front Biosci2007;12:1107-23.
- Wang T, Chen L, Wu W, Long Y, Wang R. Potential cytoprotection: Antioxidant defence by caffeic acid phenethyl ester against free radical-induced damage of lipids, DNA, and proteins. Can J PhysiolPharmacol 2008;86:279-87.
- Folbergrová J, Kunz WS. Mitochondrial dysfunction in epilepsy. Mitochondrin 2012;12:35-40.
- Tsai FH, Lien JC, Lin LW, Chen HY, Ching H, Wu CR. Protective Effect of Broussonetiapapyrifera against Hydrogen Peroxide-Induced Oxidative Stress in SH-SY5Y Cells. BiosciBiotechnolBiochem2009;73:1933-9.
- Castino R, Fiorentino I, Cagnin M, Giovia A, Isidoro C. Chelation of Lysosomal Iron Protects Dopaminergic SH-SY5Y Neuroblastoma Cells from Hydrogen Peroxide Toxicity by Precluding Autophagy and AkDephosphorylation. ToxicolSci 2011;123:523-41.
- Rhee SG. H2O2, a necessary evil for cell signaling. Science 2006;312:1882-3.
- Wang W, Huang W, Li L, Ai H, Sun F, Liu C, et al.Morroniside prevents peroxide-induced apoptosis by induction of endogenous glutathione in human neuroblastoma cells. Cell MolNeurobiol 2008;28:293-305.
- Zhang HA, Gao M, Zhang L, Zhao Y, Shi L, Chen B, et al.Salvianolic acid A protects human SH- SY5Y neuroblastoma cells against H2O2-induced injury by increasing stress tolerance ability. BiochemBiophys Res Com 2012;421:479-83.
- Ismail N, Ismail M, Fathy SF, Musa SN, Imam MU, Foo JB, et al.Neuroprotective Effects of Germinated Brown Rice against Hydrogen Peroxide Induced Cell Death in Human SH-SY5Y Cells. Int J MolSci 2012;13:9692-708.
- Yoon JH, Lee MS, Kang JH. Reaction of ferritin with hydrogen peroxide induces lipid peroxidation. BMB Rep 2010;43:219-24.
- Stratil P, Klejdus B, Kuban V. Determination of total content of phenolic compounds and their antioxidant activity in vegetables evaluation of spectrophotometric methods. J Agric Food Chem2006;54:607-16.
- Chiang LC, Chiang W, Chang MY, Ng LT, Lin CC. Antiviral activity of Plantago major extracts and related compounds in vitro. Antiviral Res 2002;55:53-62.
- Paulino N, Abreu SR, Uto Y, Koyama D, Nagasawa H, Hori H, et al.Antiinflammatoryeffects of a bioavailable compound, Artepillin C, inBrazilian propolis. Eur J Pharmacol 2008;587:296-301.
- Sawa T, Nakao M, Akaike T, Ono K, Maeda H. Alkylperoxyl radical-scavenging activity of various flavonoids and other phenolic compounds: Implications for the antitumor-promoter effect of vegetables. J Agric Food Chem 1999:47:397-402.
- Wang J, Zhao YM, Tian YT, Yan CL, Guo CY, Ultrasound-Assisted Extraction of Total Phenolic Compounds from Inulahelenium. SciWorld J 2013;2013:157527.
- Rawat S, Bhatt ID, Rawal RS. Total phenolic compounds and antioxidant potential of HedychiumspicatumBuch. Ham. ex D. Donin west Himalaya; India. J Food Compos Anal 2011;24:574-9.
- Jin M, Cai YX, Li JR, Zhao H. 1,10- phenanthroline-Fe2+Oxidative Assay of Hydroxyl Radical Produced by H2O2/Fe2+. ProgBiochemBiophys 1996;23:553-5.
- Teugwa CM, Mejiato PC, Zofou D, Tchinda BT, Boyom FF. Antioxidant and antidiabetic profiles of two African medicinal plants:Picralimanitida(Apocynaceae) andSonchusoleraceus(Asteraceae).BMC Complement Altern Med 2013;13:175-92.
- Yang Y, Li Y, Wang K, Wang Y, Yin W, Li L. P38/NF-κB/snail pathway is involved in caffeic acid-induced inhibition of cancer stem cells-like properties and migratory capacity in malignant human keratinocyte. PLoS One 2013;8:e58915.
- Benitah SA. Tumour biology: Skin-cancer stem cells outwitted. Nature 2011;478:329-30.
- Guo CY, Zhang DS. Protective effects of gallic acid against hydrogen peroxide-induced oxidative damage in SH-SY5Y cells. ActaNeuropharmacologica 2012;2:7-14.
- Pereira P, de Oliveira PA, Ardenghi P, Rotta L, Henriques JA, Picada JN. Neuropharmacological analysis of caffeic acid in rats. Basic ClinPharmacolToxicol 2006;99:374-8.
- Seo SK, Yang W, Park YM, Lee WT, Park KA, Lee JE. Overexpression of human arginine decarboxylase rescues human mesenchymal stem cells against H2O2toxicity through cell survival protein activation. J Korean Med Sci 2013;28:366-73.
- Kalantari-Dehaghi M, Chen Y, Deng W, Chernyavsky A, Marchenko S, Wang PH. et al.Mechanisms of Mitochondrial Damage InKeratinocytes By Pemphigus vulgaris Antibodies. J BiolChem 2013;288:16916-25.
- Yu Z, Poppe JL, Wang X. Mitochondrial mechanisms of neuroglobin’sneurotection. Oxid Med Cell Longev 2013;2013:756989.
- Sasaki T, Kamata R, Ueno S, Kaneda T, Temma K. Green tea catechins increase the force of contraction in isolated guinea pig atrial muscle preparations by increasing the amplitude of intracellular Ca2+ concentration. J Vet Med Sci 2012;74:1603-8.
- Guo C, Sun L, Chen X, Zhang D. Oxidative stress, mitochondrial damage and neurodegenerative diseases. Neural RegenRes2013;8:2003-14.
- Vermes I, Haanen C, Steffens-Nakken H, Reutelingsperger C. A novel assay for apoptosis. Flow cytometric detection of phosphatidylserineexpression on early apoptotic cells using fluorescein labelledAnnexin V. J Immunol Methods 1995;184:39-51.
