- *Corresponding Author:
- Hongfei Liu
Department of Pharmacy and Food Engineering, Wuyi University, China
E-mail: articlepharmacyliu@163.com
| Date of Received | 29 August 2024 |
| Date of Revision | 02 September 2024 |
| Date of Acceptance | 16 September 2024 |
| Indian J Pharm Sci 2024;86(5):1628-1641 |
This is an open access article distributed under the terms of the Creative Commons Attribution-NonCommercial-ShareAlike 3.0 License, which allows others to remix, tweak, and build upon the work non-commercially, as long as the author is credited and the new creations are licensed under the identical terms
Abstract
This study aimed to develop a cation-exchange resin suitable for pharmaceutical excipients, with an appropriate particle size to create an in situ gel of timolol maleate, enhancing its safety and efficacy for ophthalmic use. A cation-exchange resin was prepared using dispersion seed swelling and sulfonation. This resin served as a carrier to form timolol maleate drug resin complexes by bath method. The star design effect surface method was employed to optimize the gel formulation, resulting in an in situ thermosensitive gel. Additionally, the intraocular hypertension model of New Zealand rabbits was investigated with the objective of reducing intraocular pressure. The study successfully produced cation-exchange resins with a particle size below 10 μm, suitable for ophthalmic application. The drug content of homemade gel drug content ranged from 97.69 % to 99.37 %, with a cumulative release of 93.07 % over 10 h. Compared to commercially available eye drops, the homemade gel demonstrated prolonged residence time and better sustained intraocular pressure reduction effect.
Keywords
Timolol maleate, cation-exchange resin, seed swelling polymerization, in situ gel, ocular administration
Timolol Maleate (TM) is a non-selective Beta (β)-adrenergic receptor blocker known for its significant Intraocular Pressure (IOP) lowering effects. For TM to be effective, it must penetrate the cornea and bind to the β-receptors on the ciliary process. This binding causes blood vessels to constrict, reducing the active transport of ciliary epithelial cells. Consequently, the concentration of cyclic adenosine monophosphate in the ciliary process decreases, leading to reduced production of aqueous humor. TM has proven effective in treating open-angle glaucoma, certain secondary glaucoma’s, and cases unresponsive to other treatments, outperforming traditional intraocular antihypertensive drugs[1]. TM eye drops were approved by the United States Food and Drug Administration (USFDA) in September 1978 and have been widely used for glaucoma treatment.
Ion-Exchange Resin (IER) is a functional polymer consisting of an inert backbone and a fixed ionizable functional group[2]. Several methods are available for producing cationic monodisperse polymer microspheres, including precipitation polymerization, suspension polymerization, emulsion polymerization, dispersion polymerization, and seed swelling polymerization[3]. Seed swelling polymerization involves adding pre-prepared seed microspheres to a mixed solution containing monomers and initiators. The mixture is allowed to swell, and then heated to initiate polymerization, resulting in increased particle size. This method typically produces microspheres with a particle size of 1-2 μm and a narrow size distribution.
In this project, we aimed to develop a self-made cation-exchange resin with a particle size suitable for ocular use. With TM as the model drug and cation-exchange resin as the carrier, we prepared a pharmaceutical resin complex with thermosensitive gel materials, Poloxamer 407 (P407), and P 188. Xanthan gum was added to enhance viscosity and facilitate the suspension of the resin within the gel. The in vitro and in vivo properties of the cation-exchange resin were evaluated, enriching the research on cation-exchange resins in drug delivery, particularly ocular drug delivery. This study provided a theoretical basis and technical reference for the ophthalmic application of cation-exchange resins.
Materials and Methods
Materials:
TM was obtained from Wuhan Dongkangyuan Technology Co., Ltd., (China). Commercially available TM eye drops were sourced from Wuhan Wujing Pharmaceutical Co., Ltd., (China). The cation-exchange resin Amberlite® IRP69 (sodium Polystyrene (PS) sulfonate) was supplied by Rohm and Haas (Philadelphia, United States of America (USA)). All other reagents used were of analytical grade and did not require any further purification.
Animals:
Male New Zealand rabbits, each weighing between 2.5 kg and 3 kg, were acquired from the Laboratory Animal Research Center of Jiangsu University (Certificate No: UJS-IACUC-2023122101). The animal studies adhered strictly to the approved standard protocols set by the Laboratory Animal Research Center of Jiangsu University.
Methods:
Synthesis and characterization of sodium PS sulfonate resins: PS seed was synthesized by dispersion polymerization method[4]. First, impurities from Styrene (St) and Divinylbenzene (DVB) were removed using 1 M Sodium hydroxide (NaOH) solution. A 90 % ethanol solution was added to 2 g Polyvinylpyrrolidone K30 (PVP-K30) in order to facilitate dissolution. Then, 25 g St and 0.25 g 2,2'-Azobis(2-methylpropionitrile) (AIBN) were combined and added dropwise to the flask. The reaction proceeded at 70° for 24 h, then the mixture was washed with ethanol and water, then dried to obtain PS seed.
PS-DVB microspheres were prepared using a two-step swelling method. 1 g PS seeds were placed in 100 ml of 0.25 % Sodium Dodecyl Sulfate (SDS) solution with stirring at room temperature for 30 min, followed by sonication in an ice water bath for 30 min. After activating the PS seed at 40° for 6 h, 0.2 g Benzoyl peroxide (BPO) was dissolved in a mixture of 10 g of St and 1 g of DVB. This mixture was swollen at 40° with stirring for 10 h. After swelling, 50 ml of 1 % Polyvinyl alcohol (PVA) aqueous solution was added, and the reaction was refluxed at 75° with mechanical stirring at 400 rpm for 24 h to produce the PS-DVB microspheres.
Poly(sodium-4-styrene sulfonate) (PSSNa) was prepared by sulfonation and acid-base reactions[5]. 2 g PS was added to 10 ml dichloroethane and stirred for 30 min. Then, 4.0 ml 98 % Sulfuric acid (H2SO4) was added, and the reaction was conducted at 60° for 3 h, followed by 65° for 9 h. The resulting product was dispersed in water, treated with 10 % NaOH until the pH reached 9-10, stirred for 1-2 h, and then washed to obtain PSSNa. The morphology, structure and particle size distribution of the self-made resin were characterized by Scanning Electron Microscope (SEM),Fourier-Transform Infrared Spectroscopy (FTIR) and particle size distribution analysis.
Preparation and characterization of drug resin complexes: TM resin complexes were prepared by the bath method[6]. To this end, 500 mg self-made cation-exchange resin was placed in a beaker with 100 ml of a 5 mg/ml TM solution. The mixture was stirred at 35° for 90 min to achieve ion exchange equilibrium between the drug and the resin. Then, the TM resin complex was filtered, and washed with purified water to remove any residual drug on its surface. The complex was then dried overnight at 35°.
Drug loading capacity was assessed using an Ultraviolet (UV)-Spector S600 spectrophotometer at a wavelength of 294 nm. The drug resin complexes were characterized by SEM FTIR, and X-ray Diffraction (XRD) to examine the effects of drug loading on resin morphology and the binding mechanism between the drug and the resin.
Preparation and optimization of drug resin in situ gel:
Preparation of blank thermosensitive in situ gels: The thermosensitive in situ gel was prepared by the cold dissolution method[7]. Accurate amounts of P407 and/or P188 were weighed, and ultrapure water at 4° was added to moisten the materials. The mixture was allowed to swell at 4° for over 24 h.
Single factor investigation: Factors such as the concentrations of P407 and P188, types of bacteriostats, pH regulators, osmotic regulators, and suspension agents were examined. Different concentrations of P407 (16 %-25 %) and P188 (0 %-10 %) were tested.
Experiment using star design: Based on the results of the single factor experiments, P407 (X1, %, w/w) and P188 (X2, %, w/w) were selected as variables for further investigation. X1 ranged from 17 % to 25 %, and X2 ranged from 0 % to 8 %. Using the star design method[8], each factor was evaluated at 5 levels: ±α, ±1, and 0, with Alpha (α) set to 1.414 due to the examination of two factors. The experimental design was executed using Design-Expert 10.0.7 software, with the gelation temperatures T1 and T2 before and after dilution of artificial tears as response variables. The gels were prepared and assessed according to the design. The experimental results were subjected to analysis. In addition, 3 optimized formulations of TM drug resin gels were selected for validation, and the discrepancy between the predicted and actual values was calculated to confirm the final optimized formulation.
Viscosity and rheology:
Viscosity measurement: The gel underwent steady-state shear scans at a shear rate of 0.01 to 100 s-1 to investigate the relationship between viscosity and shear rate before dilution at 25° and after dilution at 34°. The temperature range was set from 15° to 40° with a heating rate of 1°/min and a shear rate of 10 s-1, examining the viscosity changes of the gel before and after dilution with Simulated Tear Fluid (STF).
Rheology: The linear viscoelastic region of the gel was determined through stress sweeps at a fixed frequency, with an angular frequency range of 0.01 to 100 rad/s. The storage modulus (G') and loss modulus (G'') of the undiluted gel were measured at 25°, and the same measurements were taken for the diluted gel at 34°. All experiments were conducted using an AR2000ex rotational rheometer.
In vitro drug release study: The in vitro release of the in situ gel was assessed by dialysis tube method[9]. A 20 ml STF solution was prepared as the dissolution medium and preheated in a thermostatic shaker at 37° at 120 rpm. An appropriate amount of TM drug resin (equivalent to 5 mg of timolol) was placed in a dialysis bag (molecular weight cut-off 8000-12 000 Da) with 1 ml of the release medium. Similarly, available TM eye drops (25 mg/5 ml) and the homemade drug resin in situ gel (25 mg/5 ml) was also placed in separate dialysis bags. The bags were then submerged in the preheated dissolution medium. Samples were taken at specific time points, and the medium was quickly replenished with an equal volume of fresh STF.
Drug release concentrations were measured using High-Performance Liquid Chromatography (HPLC) with the following conditions: a unitary (CN) chromatographic column (4.6 mm×250 mm, 5 µm), a mobile phase of methanol, water, and triethylamine in a ratio of 1:1:0.1 % (v/v/v) with pH adjusted to 3.5 using phosphoric acid, a detection wavelength of 294 nm, an injection volume of 20 µl, a flow rate of 1.0 ml/min, and a column temperature of 30°.
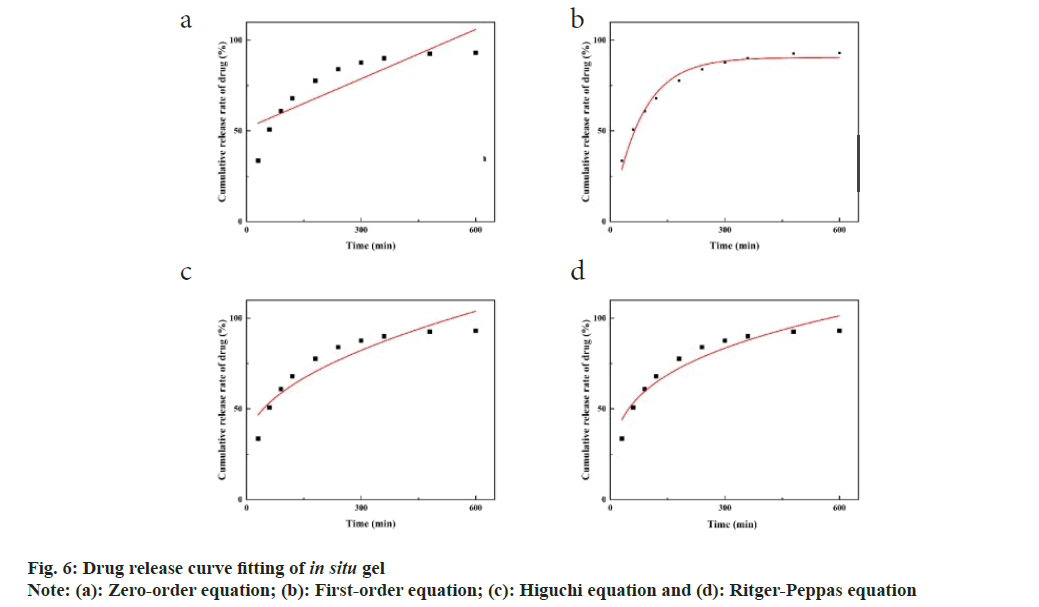
Data analysis: The in vitro drug release data from the in situ gel were analyzed to fit a release equation and determine the release kinetics using the following equations: Zero-order equation Mt=a+kt, first-order equation -\ln(1-Mt/M∞)=kt, Higuchi equation Mt/M∞=kt1/2, and Ritger-Peppas equation ln(Mt/M∞)=k1\lnt
Where, Mt is the cumulative release at time t; M∞ is the cumulative release; A is the slope, and k is the drug release rate constant. k1 is the drug release parameter. When k1<0.45, it belongs to the Fick’s diffusion mechanism, and when 0.45<k1<0.89, it belongs to the non-Fick’s diffusion mechanism. The goodness of fit was determined by the square of the correlation coefficient (R2).
Investigation of precorneal retention and irritation:
Ocular retention test: 6 healthy male New Zealand rabbits were randomly assigned to 2 groups. Group A was given 50 μl 0.2 % sodium fluorescein-labeled TM eye drops, while group B was given 50 μl 0.2 % sodium fluorescein-labeled homemade TM drug resin in situ gel. After administration, the rabbit eyes were manually closed for 10 s. At specified time points, the fluorescence intensity on the cornea was observed using a handheld UV lamp. Photographs were taken to document the fluorescence until it was no longer visible[10].
Stimulus investigation experiments:
Cytotoxicity assay: Cells in the logarithmic growth phase were trypsinized, centrifuged, and resuspended in the minimum Eagle's Minimum Essential Medium (EMEM). The cell concentration was adjusted to 3×10⁴ to 5×10⁴ cells/ml. The cells were then plated into 96-well plates at 200 μl per well and incubated for 24 h. After incubation, the medium was removed from each well.
In the experimental group, 200 μl of each of the following solution was added to separate wells. Homemade resin suspension, homemade TM eye drops, and homemade TM in situ gel solution. In the control group, 200 μl of blank EMEM medium was added. Each condition was tested in triplicate (n=3) and incubated for an additional 24 h.
To assess cell viability, 10 μl of 3-(4,5-Dimethyl-2-thiazolyl)-2,5-diphenyl-2H-tetrazolium bromide (MTT) solution was added to each well and incubated for 4 h. Then, 150 μl of Dimethyl Sulfoxide (DMSO) was added to dissolve the formazan crystals, and the mixture was gently shaken for 15 min. Absorbance was measured at 490 nm using a microplate reader. Cell viability was calculated using the following formula:
Cell viability (%)=ODs/ODc×100 %
Where, ODs: Absorbance value of the experimental group; ODc: Absorbance value of the control group.
Draize stimulation experiment: 6 healthy male New Zealand rabbits were randomly assigned to 2 groups for a self-controlled study. Group A was given 50 μl of homemade TM in situ gel in the right eye, while Group B was given 50 μl of commercially available TM eye drops in the right eye. Both groups were administered 50 μl of normal saline in the left eye. After administration, the eyelids of the right eye were passively closed for 10 s.
Single-dose and multiple-dose trials: For the single-dose trial, eyes were examined at 1 h, 2 h, 4 h, 24 h, 48 h, and 72 h after administration using a hand-held slit lamp. In the multiple-dose trial, the medication was administered twice daily (morning and evening), with local eye examinations conducted before each dose. Post-dose examinations were performed at 1 h, 2 h, 4 h, 24 h, 48 h, and 72 h. The results of these experiments were evaluated using the Draize eye stimulation test rating scale and the eye stimulation evaluation criteria (Table 1 and Table 2)[11].
| Assessment | Score |
|---|---|
| Cornea | |
| No ulceration or opacity | 0 |
| Scattered or diffuse area; details of iris clearly visible | 1 |
| Easily discernible translucent areas; details of iris slightly obscured | 2 |
| Opalescent areas; no details of iris visible, size of pupil barely discernible | 3 |
| Opaque; iris invisible | 4 |
| Iris | |
| Normal | 0 |
| Folds above normal, congestion, swelling, and/ or circumcorneal injection; iris still reacting to light (sluggish reaction is positive) | 1 |
| still reacting to light (sluggish reaction is positive) | |
| No reaction to light, hermorrhage, and/ or gross destruction | 2 |
| Conjunctivae | |
| Conjunctival hyperemia | |
| Normal | 0 |
| Vessels definitely injected above normal | 1 |
| More diffuse, deeper crimson red; individual vessels not easily discernible | 2 |
| Diffuse beefy red | 3 |
| Chemosis | |
| Normal | 0 |
| Any swelling above normal (includes nictitating membrane) | 1 |
| Obvious swelling with partial eversion of the lids | 2 |
| Swelling with lids about half closed | 3 |
| Swelling with lids about half closed to completely closed | |
| Discharge | |
| Normal | 0 |
| Any amount different from normal | 1 |
| Discharge with moistening of the lids and hairs just adjacent to the lids | 2 |
| Discharge with moistening of the lids and considerable area around the eye | 3 |
Table 1: The Scoring Standards of Draize Ocular Irritation Experiment
| Assessment of irritation | Stimulus score |
|---|---|
| Nonirritant | 0-3.9 |
| Mild irritation | 4-8.9 |
| Moderate irritation | 9-12.9 |
| Intensity of irritation | 13-16 |
Table 2: Evaluation Standards of Ocular Irritation Degree
Eye tissue sectioning: After the multiple dosing tests, the experimental rabbits were euthanized, and their eyeballs were carefully removed. The eyes were rinsed with normal saline to eliminate blood and debris. The cornea, iris, and conjunctival tissues were dissected, stained with hematoxylin and eosin, and examined under a microscope to identify any pathological changes. Images of the tissues were captured for further analysis.
Investigation of pharmacodynamic properties: 6 healthy New Zealand rabbits were fasted for 24 h, and then anesthetized with an Intravenous (IV) injection of 20 % uratan solution (5 ml/kg) and 2 % lidocaine solution in the eye area to establish a high IOP model. IOP was measured using a depression tonometer, ensuring it was kept horizontal and perpendicular to the cornea. The IOP model was then created by gavage.
The rabbits were randomly assigned to 2 groups of 3 individuals each. Their initial IOP was measured after gavage. Group A was given 100 μl of homemade TM in situ gel in the conjunctival sac of the right eye, while group B was given 100 μl of commercially available TM eye drops in the same manner. The left eye of both groups was administered 100 μl of normal saline as control group. After application, the rabbit eyes were manually closed for 10 s.
IOP measurements were taken at 15 min, 30 min, 45 min, 60 min, 90 min, 120 min, 180 min, 240 min, 300 min, 360 min, 480 min, and 600 min post-administration. Each measurement was repeated 3 times, and the average value was recorded. The IOP values were adjusted according to an IOP conversion table. The antihypertensive effect was assessed by calculating the difference (ΔIOP) between the IOP in the right eye and the left eye of each rabbit.
Results and Discussion
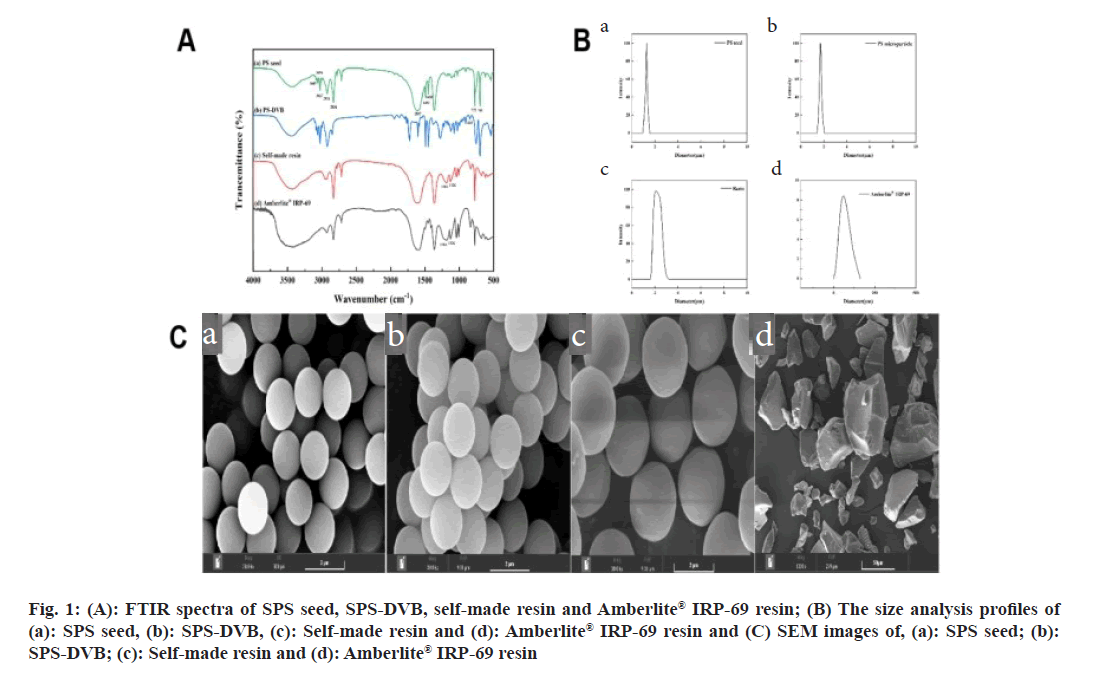
The chemical structures of PS seed, PS-DVB, self-made resin, and Amberlite® IRP-69 resin were analyzed using FTIR spectroscopy (fig. 1A). The absorption peak at 835 cm-1 in the PS seed spectrum, also present in PS-DVB, indicated successful incorporation of DVB into the structure. Additional peaks at 1250~1000 cm-1 and 576 cm-1 in the spectrum of sulfonated PS correspond to the stretching and deformation vibrations of sulfonic acid groups[12]. This confirmed that sulfonic acid groups were successfully grafted onto the sodium PS sulfonate. Comparison of the FTIR spectra of the self-made resin and the Amberlite® IRP-69 resin (fig. 1A) revealed their chemical structures were identical, indicated that the self-made resin mirrored the commercial resin's composition.
Fig 1: (A): FTIR spectra of SPS seed, SPS-DVB, self-made resin and Amberlite® IRP-69 resin; (B) The size analysis profiles of (a): SPS seed, (b): SPS-DVB, (c): Self-made resin and (d): Amberlite® IRP-69 resin and (C) SEM images of, (a): SPS seed; (b): SPS-DVB; (c): Self-made resin and (d): Amberlite® IRP-69 resin
The average particle sizes were measured as 1.28 μm for PS seed, 1.71 μm for PS-DVB, 2.09 μm for the self-made resin, and 58.9 μm for Amberlite® IRP-69 resin (fig. 1B). The results showed that PS seed, PS-DVB, and self-made resin had narrow size distributions and uniform particle sizes. According to literature, particles smaller than 10 μm were less irritating and more suitable for ocular applications[13]. With a particle size of not more than 10 μm, the self-made resin was appropriate for ophthalmic drug delivery. All prepared PS seed, PS-DVB, and self-made resin exhibited good spherical shape, smooth surface, and uniform size (fig. 1C). In contrast, the commercially available Amberlite® IRP-69 resin displayed irregular shape and uneven size after crushing. SEM images showed that the self-made resin particles ranged from 1-5 μm, whereas the imported resin contained many particles larger than 50 μm after crushing.
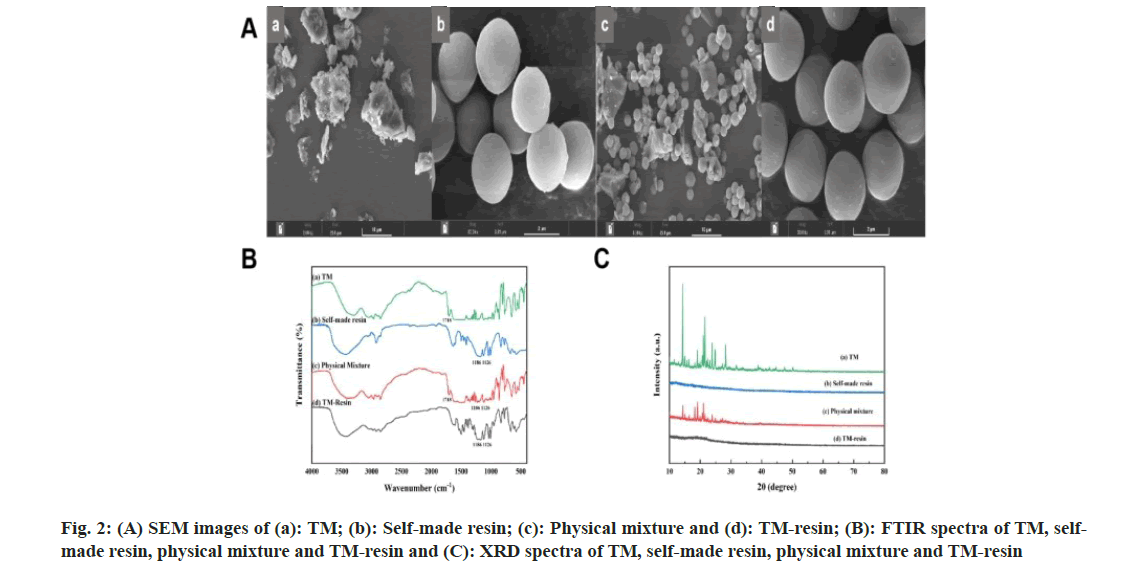
SEM of the physical mixture of TM and the self-made resin revealed a distinct separation, suggesting that TM was not chemically bound to the resin. The TM particles appeared irregularly distribution, and no free TM or TM clumps were observed crystallized or adhered to the resin. Both the blank resin and the TM-resin complex showed spherical, clean particles, with no noticeable changes in morphology before and after drug loading (fig. 2A). These observations indicated that there was no straightforward physical adsorption between the drug and the resin. FTIR provided further insights into the interaction between TM and the resin. TM exhibited a carboxyl C=O peak at 1718 cm-1, while the self-made resin showed strong sulfonic acid S=O peaks at 1126 cm-1 and 1186 cm-1. In the physical mixture of TM and the resin, both TM and resin characteristic peaks were present, indicating no chemical binding[14]. However, in the FTIR spectrum of the TM-resin complex, the characteristic peak of TM at 1718 cm-1 was absent, while the S=O peaks of the resin remained. This suggested that the drug and resin were bound by ion exchange rather than simple physical adsorption (fig. 2B).
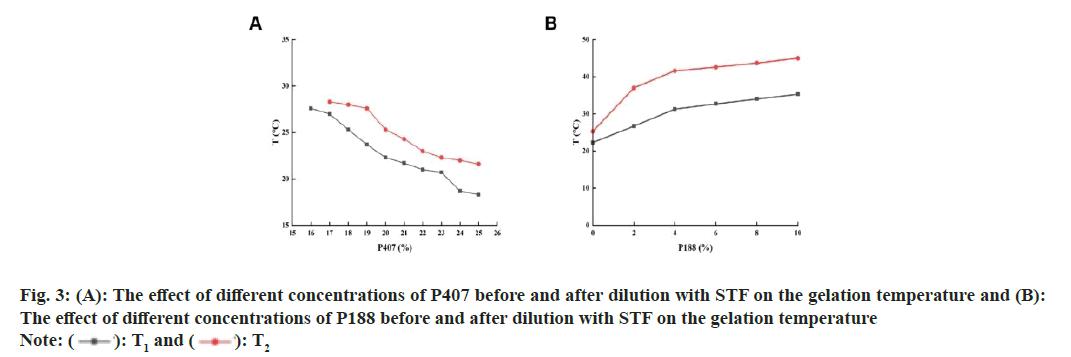
XRD revealed crystalline peaks in the range of 10°-30° for TM. However, the self-made resin did not exhibit any characteristic peaks. In the physical mixture of TM and the self-made resin, the crystalline peaks of drug were present, but their intensity was reduced. In the spectrum of the TM-resin complex, these crystalline peaks were absent (fig. 2C) indicated that the drug was not simply physically adsorbed but was likely bound by ion exchange. The relationship between the post-code value and the actual value was shown in Table 3. The experimental design results with T1 and T2 as response values were shown in Table 4. The gelation temperatures, T1 and T2, decreased as the concentration of P407 increased (fig. 3A). This is because higher concentrations of P407 led to more micelles forming by dehydration and polymerization at the hydrophobic end of the solution, causing an accumulation of micelles and a reduction in the gelation temperature[15]. However, when the concentration of P407 was 16 %, the gel could not form under physiological conditions (34°) after dilution with artificial tears. Therefore, the optimal concentration range for P407 was determined to be 17 %-25 %.
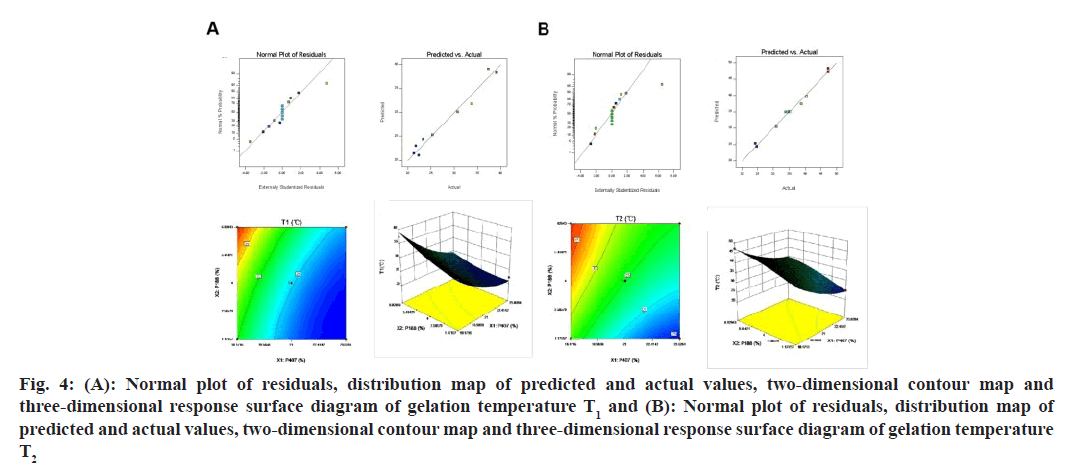
Fig 4: (A): Normal plot of residuals, distribution map of predicted and actual values, two-dimensional contour map and three-dimensional response surface diagram of gelation temperature T1 and (B): Normal plot of residuals, distribution map of predicted and actual values, two-dimensional contour map and three-dimensional response surface diagram of gelation temperature T2
| Factor | Level | ||||
|---|---|---|---|---|---|
| -1.414 | -1 | 0 | 1 | 1.414 | |
| X1 | 17 | 18.17 | 21 | 23.83 | 25 |
| X2 | 0 | 1.17 | 4 | 6.83 | 8 |
Table 3: Factor Level Table of Central Composite Experimental
| Number | ||||||
|---|---|---|---|---|---|---|
| Code value | Actual value | Response value | ||||
| X1 | X2 | X1 | X2 | T1 | T2 | |
| 1 | -1 | 1 | 18.17 | 6.83 | 37.3 | 47.3 |
| 2 | 0 | -1.41 | 21 | 0 | 21.7 | 24.3 |
| 3 | 1 | -1 | 23.83 | 1.17 | 22.3 | 24.7 |
| 4 | -1 | -1 | 18.17 | 1.17 | 30.7 | 38.7 |
| 5 | 0 | 1.414 | 21 | 8 | 33.7 | 40.4 |
| 6 | -1.41 | 0 | 17 | 4 | 39 | 47.3 |
| 7 | 1 | 1 | 23.83 | 6.83 | 23.3 | 34 |
| 8 | 1.414 | 0 | 25 | 4 | 21.3 | 31 |
| 9-13 | 0 | 0 | 21 | 4 | 25.3 | 35 |
Table 4: Experimental Results of Central Composite
In contrast, increasing the concentration of P188 caused T1 and T2 to rise gradually (fig. 3B). This increase was due to the higher proportion of polyethylene oxide at the hydrophilic end introduced by P188, which enhanced hydrophilicity and disrupted micelle formation in P407[16]. Consequently, a higher temperature was required for micelle formation and gelation, the optimal concentration range of P188 was determined at 0 %-8 %.
The addition of bacteriostatic agents, pH regulators, and osmotic pressure regulators had no significant impact on the gelation temperatures, T1 and T2, either before or after dilution with artificial tears[17]. However, the use of self-made resin and 0.2 % xanthan gum caused a slight but controlled alteration in T1 and T2 (Table 5). Thus, the influence of these excipients on the gelation temperature of the formulation is considered negligible. The model fitting results were evaluated using the R2 and the confidence level (p). A higher R2 indicates a stronger correlation of the model. The significance level for the model equation was set at p<0.05, with p<0.01 indicating extreme significance. The quadratic polynomial fitting model produced the highest R2 values for the gelation temperatures T1 and T2, both of which were statistically significant (Table 6). Therefore, the quadratic polynomial model was used for fitting, resulting in the following equation:
T1=18.86-13.44X1+3.69X2-0.175X1X2+0.287X12+0.314X22(R2=0.9703)
T2=194.18-13.67X1+2.56X2+0.22X1X2+0.27X12-0.15X22(R2=0.9904)
The equation indicated a positive or negative correlation with the response value, depending on whether the value was positive or negative, respectively. The magnitude of the value indicated the degree of influence.
| Excipient name | T1 | T2 |
|---|---|---|
| Blank in situ gel | 22 | 25 |
| Blank in situ gel+self-made resin | 22 | 25 |
| Blank in situ gel+0.01 % benzalkonium chloride | 22 | 25 |
| Blank in situ gel+2 % Tris | 22 | 25 |
| Blank in situ gel+0.9 % NaCl | 22 | 25 |
| Blank in situ gel+0.2 % xanthan gum | 22 | 25 |
Table 5: The Effect of Other Excipients In in situ GEL on the Gelation Temperature
The negative sign before X1 indicated that an increase in P407 would result in a decrease in the response value. Conversely, the positive sign in X2 indicated that an increased in P188 would lead to an increase in the response value. These findings were consistent with the results of the previous one-way investigation. The quadratic polynomial model of gelation temperature T1 was highly significant (p<0.0001). The primary term factors X1 and X2, as well as the quadratic term factors, had extremely significant effects on the response value of T1 (p<0.01), while the other terms were not significant (p>0.05). The determination coefficients were Radj2=0.9491, Rpred2=0.7890 and Radj2-Rpred2=0.1601<0.2 (Table 7), indicating a good fit of the model. This model can be used for the optimization of in situ gel formulation.
| Model | T1 | T2 | ||
|---|---|---|---|---|
| R2 | p-value | R2 | p value | |
| linear model | 0.8539 | ?0.0001 | 0.9053 | ?0.0001 |
| Interactive model | 0.8727 | 0.0002 | 0.9055 | ?0.0001 |
| Quadratic polynomial model | 0.9703 | ?0.0001 | 0.9904 | ?0.0001 |
Table 6: Table of Fitting Results for Different Models
The quadratic polynomial model of gelation temperature T2 was also a good fit (p<0.0001), with primary term factors X1 and X2, and quadratic term factors having extremely significant effects on the T2 response value (p<0.01). Other terms were not significant (p>0.05). The determination coefficients were Radj2=0.9835, Rpred2=0.9314, and Radj2-Rpred2=0.0521<0.2 (Table 7). This model can be used to optimize the formulation of in situ gel.
| Source | Sum of squares | df | Mean square | F value | p value | Significance |
|---|---|---|---|---|---|---|
| Model | 405.31 | 5 | 81.06 | 45.79 | ?0.0001 | **** |
| X1 | 281.22 | 1 | 281.22 | 158.84 | ?0.0001 | **** |
| X2 | 75.46 | 1 | 75.46 | 42.63 | 0.0003 | *** |
| X1 X2 | 7.84 | 1 | 7.84 | 4.43 | 0.0734 | |
| X12 | 36.6 | 1 | 36.6 | 20.67 | 0.0026 | ** |
| X22 | 7.95 | 1 | 7.95 | 4.49 | 0.0719 | |
| Residual | 12.39 | 7 | 1.77 | |||
| Lack of fit | 12.39 | 3 | 4.13 | |||
| Pure error | 0 | 4 | 0 | |||
| Cor total | 417.71 | 12 | ||||
| Correlation coefficient | R2=0.9703 | R |
Rpred2=0.789 | |||
| Model | 572.87 | 5 | 114.57 | 143.72 | ?0.0001 | **** |
| X1 | 316.91 | 1 | 316.91 | 397.53 | ?0.0001 | **** |
| X2 | 206.74 | 1 | 206.74 | 259.33 | ?0.0001 | **** |
| X1 X2 | 0.12 | 1 | 0.12 | 0.15 | 0.7067 | |
| X12 | 33.1 | 1 | 33.1 | 41.52 | 0.0004 | *** |
| X22 | 10.33 | 1 | 10.33 | 12.96 | 0.0087 | ** |
| Residual | 5.58 | 7 | 0.8 | |||
| Lack of fit | 5.58 | 3 | 1.86 | |||
| Pure error | 0 | 4 | 0 | |||
| Cor total | 578.45 | 12 | ||||
| Correlation coefficient | R2=0.9904 | Radj2=0.9835 | Rpred2=0.9314 |
Note: There were significant differences (* p<0.05) and very significant differences (** p<0.01, *** p<0.001, ****p<0.0001)
Table 7: Analysis of Variance Table of the Quadratic Polynomial Model Equation of Gelation Temperature T1 and T2
The residual distribution of T1 and T2 appeared to follow a normal distribution, indicating that the residuals of the fitted model are in line with the normal distribution. Additionally, the predicted and actual values were closely aligned, suggesting that the fitted model was well suited to the data. Based on the contour plots and effect maps of T1 and T2, it could be observed that when the concentration of P407 was held constant, both T1 and T2 increased with an increase in P188 concentration. Similarly, when the concentration of P188 was held constant, both T1 and T2 decreased with an increase in P407 concentration (fig. 4 A and fig. 4 B). To meet the requirements for using temperature-sensitive in situ gel in the eye, the response value of the gel should be between T1≥25° and T2≤34° under ideal conditions[18,19].
The difference between the predicted and actual values for all 3 prescription groups was <3 %. This suggested that the nonlinear regression equation established by the star design experiment was highly accurate and had good predictability. Among the prescriptions, prescription 1 had the smallest deviation and the lowest proportion of P188. As mentioned earlier, P188 may hinder the aggregation of P407 and reduce the gelling ability of the thermosensitive gel (Table 8). The results showed that the minimum dosage of excipients in prescription 1 could meet the requirements for ocular use of the thermosensitive gel (T1≥25°, T2≤34°). Therefore, the dosage of poloxamer in the in situ gel of TM drug resin was determined to be P407 19.88 % and P188 1.17 %.
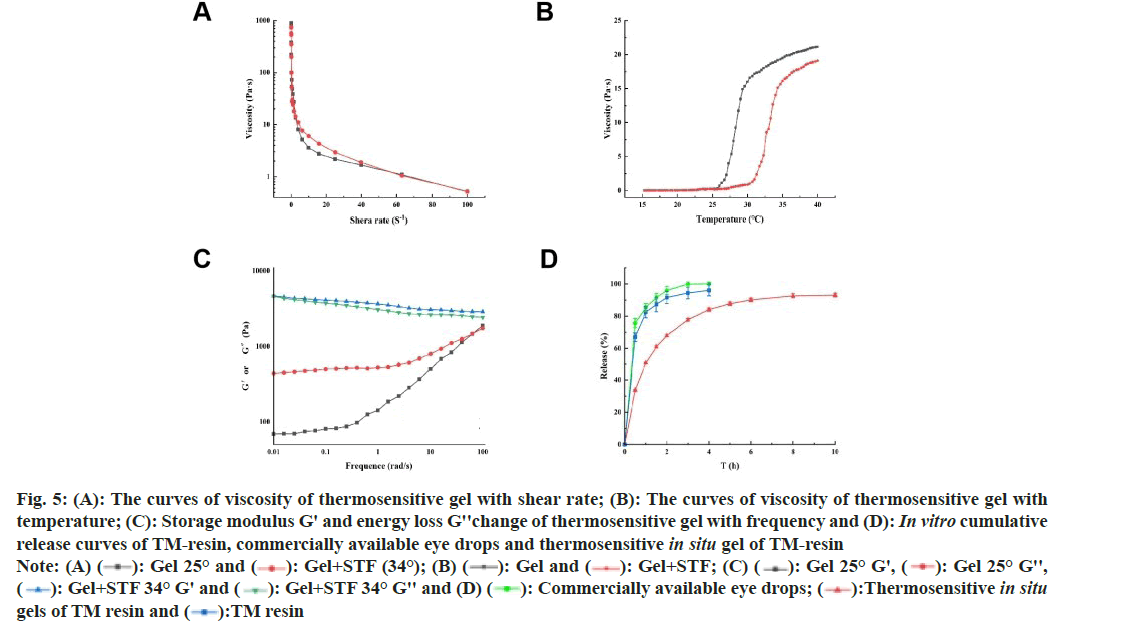
1.988 g P407 and 0.117 g P188 were added to 4° ultrapure water to wet and swell, TM-resin (equivalent to timolol 50 mg) and 0.02 g xanthan gum were added to the gel, the solution was stirred and mixed, an appropriate amount of 0.01 % benzalkonium chloride was added, the pH was adjusted to 6.5-7.0 with 2 % Tris, the osmotic pressure was adjusted to about 305 mosm/l with Sodium chloride (NaCl), and finally, ultrapure water was added to 10 ml, sterilized with Gamma (γ) irradiation, and a thermosensitive in situ gel of TM drug resin was prepared. At lower shear rates, the viscosity of gel significantly decreased with increasing shear rate, whereas at higher shear rates, the decrease was less pronounced (fig. 5A). Overall, the viscosity of gel decreased with increasing shear rate, exhibiting a rapid initial decline followed by a slower rate of decrease, characteristic of shear-thinning behavior and classifying it as a pseudoplastic fluid[20]. This property was advantageous for ophthalmic applications. After ocular administration, the thermosensitive gel undergoes a phase transition under physiological conditions, transforming into a semi solid gel. Although a rapid increase in viscosity might cause discomfort, the high shear rates associated with blinking and eye movements (ranging from 0.03-28500 s-1) facilitate a quick reduction in viscosity, thereby mitigating discomfort[21].
The undiluted gel began to phase transition at 25.7°, with a notable increase in viscosity. After dilution, the gel started phase transitioning at 31°, with a sharp viscosity increase, which became pronounced at 34°. Further temperature increases led to minor viscosity changes (fig. 5B). These results indicated that the undiluted gel maintains a fluid state at room temperature, enabling rapid and uniform drug distribution in the eye before fully forming into a gel. Subsequently, under physiological conditions, the gel transitions to a semi-solid state, increasing viscosity to prevent tear clearance and prolong ocular retention. At 25°, the G' of the undiluted gel was lower than the G'', showing frequency dependence, indicating the presence of disordered micellar arrangements and relaxed polymer chains, characteristic of the viscoelastic properties of an in situ forming gel. In contrast, at 34°, the diluted gel exhibited a higher G' than G'', with minimal frequency dependence (fig. 5C). This suggested ordered micellar aggregation, indicative of an elastic solid nature of the in situ forming gel under these conditions[22].
Fig 5: (A): The curves of viscosity of thermosensitive gel with shear rate; (B): The curves of viscosity of thermosensitive gel with temperature; (C): Storage modulus G' and energy loss G''change of thermosensitive gel with frequency and (D): In vitro cumulative release curves of TM-resin, commercially available eye drops and thermosensitive in situ gel of TM-resin 


The drug release from the resin was initially rapid, with 66.97 % within 30 min and 82.51 % within 1 h. After this initial burst, the release rate slowed, eventually reaching nearly 100 %. The commercially available eye drops in the dialysis bag released 75.67 % of the drug after 30 min and 99.89 % after 3 h, in contrast, the homemade TM drug resin in dialysis tubing exhibited a slower release, with 96.05 % released after 4 h and reaching 90 %. The homemade TM in situ gel released 33.61 % within 30 min, meeting the 2020 edition of the requirement of Chinese Pharmacopoeia that sustained-release preparations should not exceed 40 % release within 30 min (fig. 5D).
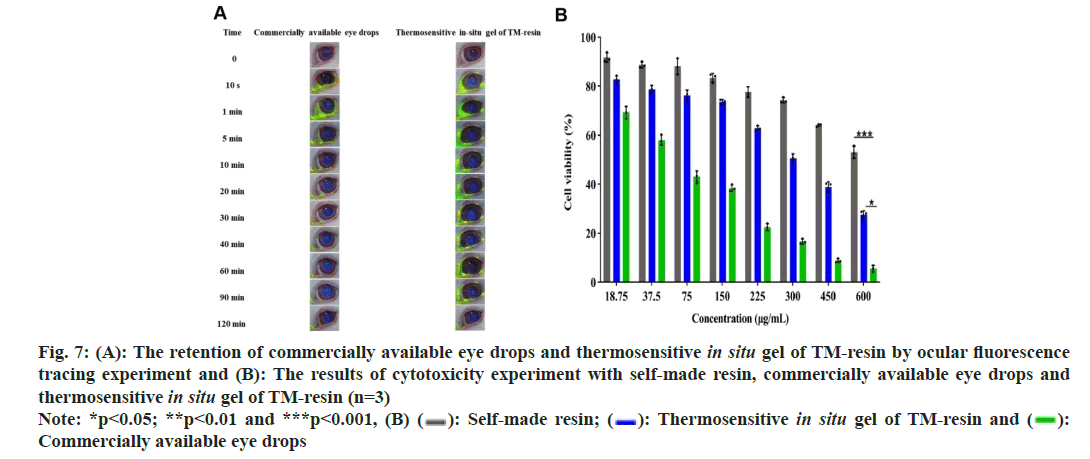
These results indicated that ions from the internal sites of the resin gradually diffuse outward and participate in the ion exchange process, resulting in a slower, sustained release of the drug[23]. In addition, the homemade gel preparation can achieve slow release by dual sustained-release mechanisms. This effect was due to the gel itself and the sustained release of resin in the physiological environment (34°). The fitting results showed that the R2 value of the primary pharmacokinetic equation was the highest, reaching 0.9785, indicating the most optimal fit and suggesting that the release curve of the gel followed primary release kinetics. The fitting results of the Ritger-Peppas model indicated that the k1 value is 0.279, which is less than 0.45, suggesting the Fick’s diffusion mechanism. This implied that the gel was released slowly in vitro (fig. 6 and Table 9). The initial rapid release followed by a slower, sustained release was beneficial for prolonging the release time of drug. It achieved a higher initial therapeutic concentration and maintains a constant concentration thereafter, thus improving bioavailability[24]. In the group given commercially available eye drops, the fluorescence from the eyes disappeared within 30 min. Some of the drops remained around the eye due to blinking, and a considerable amount of the fluorescent solution was observed in the nostrils of these rabbits shortly after administration. The fluorescence of the eyes in the homemade gel group had also disappeared at 120 min post-administration, but less residual fluorescent solution was present around the orbit. Fluorescent solution was also noted in the nostrils (fig. 7A). These findings indicated that the homemade TM drug resin in situ gel significantly prolonged the ocular retention time of the drug compared to the commercially available eye drops. This improvement solved the problem of low bioavailability due to short ocular retention times of commercially available eye drops[25].
| P407(%) | P188(%) | T1(°) | T2(°) | ||||
|---|---|---|---|---|---|---|---|
| Predicted value | Measured value | SD (%) | Predict | Measure | SD (%) | ||
| 19.88 | 1.17 | 25.5 | 26 | 1.96 | 30.6 | 30.3 | 0.98 |
| 20.56 | 2.88 | 25.2 | 25.9 | 2.78 | 32.8 | 31.9 | 2.74 |
| 20.82 | 3.52 | 25.3 | 26 | 2.77 | 33.5 | 34.2 | 2.09 |
Note: SD: Standard Deviation
Table 8: The Results of Central Composite Experimental Optimize Formulation Validation
| Model | Fitting equation | R2 |
|---|---|---|
| Zero-order equation | Mt=51.54+0.09t | 0.6925 |
| First-order equation | Mt=90.51(1-e-0.013t) | 0.9785 |
| Higuchi equation | Mt=3.01x1/2+30.11 | 0.8531 |
| Ritger-peppas equation | ln(Mt/M∞)=0.279lnt+16.969 | 0.913 |
Table 9: Fitting Equation Results for in vitro Drug Release of in situ GEL
The concentration of the sample significantly affects the viability of Human Corneal Epithelial Cells (HCEC). In the self-made resin suspension group, cell viability was above 83.4 %, relatively stable in concentrations from 18.75-150 μg/ml. As the concentration increased over 150 μg/ml, cell viability began to decline, only 53.01 % at the concentration of 600 μg/ml. No significant difference was found between the homemade in situ gel group and the resin suspension group (p>0.05). The commercially available eye drops exhibited significantly lower cell viability compared to both the resin suspension and the homemade in situ gel groups (p<0.001). Cell viability in the commercially available eye drops group was notably concentration-dependent, dropping below 50 % at 75 μg/ml and 5.58 % at 600 μg/ml (fig. 7B). These results indicated that all 3 samples caused irritation, the commercially available eye drops were significantly more irritating than the homemade gel. This suggested that the homemade gel may reduce drug toxicity and improve cell survival.
Fig 7: (A): The retention of commercially available eye drops and thermosensitive in situ gel of TM-resin by ocular fluorescence tracing experiment and (B): The results of cytotoxicity experiment with self-made resin, commercially available eye drops and thermosensitive in situ gel of TM-resin (n=3)  Commercially available eye drops
In the single-dose experiment, the ocular irritation scores for both formulations were low, only 0.2 and 0.3, respectively, 72 h after administration. In multiple doses experiment, both preparations caused some conjunctival edema and increased secretions. However, the total irritation score for commercially available TM eye drops was higher than that of the homemade TM in situ gel, although both remained within the range of 0-3.9 (Table 10). These results indicated that neither single nor multiple administrations caused significant irritation to the rabbits eyes[26].
| Eye tissue state | Cumulative score of single administration | Cumulative score of multiple administration | ||||
|---|---|---|---|---|---|---|
| Normal saline | Eye drops | in situ gel | Normal saline | Eye drops | in situ gel | |
| Cornea | 0 | 0 | 0 | 0 | 0 | 0 |
| Iris | 0.1 | 0.2 | 0.1 | 0.2 | 1.5 | 0.8 |
| Conjunctival hyperemia | 0 | 0.1 | 0.1 | 0.2 | 1.2 | 0.7 |
| Chemosis | 0 | 0 | 0 | 0 | 0 | 0 |
| Discharge | 0 | 0 | 0 | 0 | 0 | 0 |
| Total score | 0.1 | 0.3 | 0.2 | 0.4 | 2.7 | 1.5 |
Table 10: Evaluation Results of Ocular Irritation (Single and Multiple Administration)
| Parameter | Commercially available eye drops | Thermosensitive in situ gel of TM resin |
|---|---|---|
| Imax (min) | 30 | 120 |
| ?IOPmax (mmHg) | 6.55±0.17 | 5.90±0.43 |
| AUC(?IOP-T)(mmHg/min) | 554.78±43.87 | 1396.05±36.21 |
| MRT (min) | 110.75±19.62 | 173.13±1.93 |
Table 11: Pharmacodynamic Parameters after Ocular Administration of Commercially available Eye Drops and Thermosensitive in situ GEL of TM-RESIN (n=3)
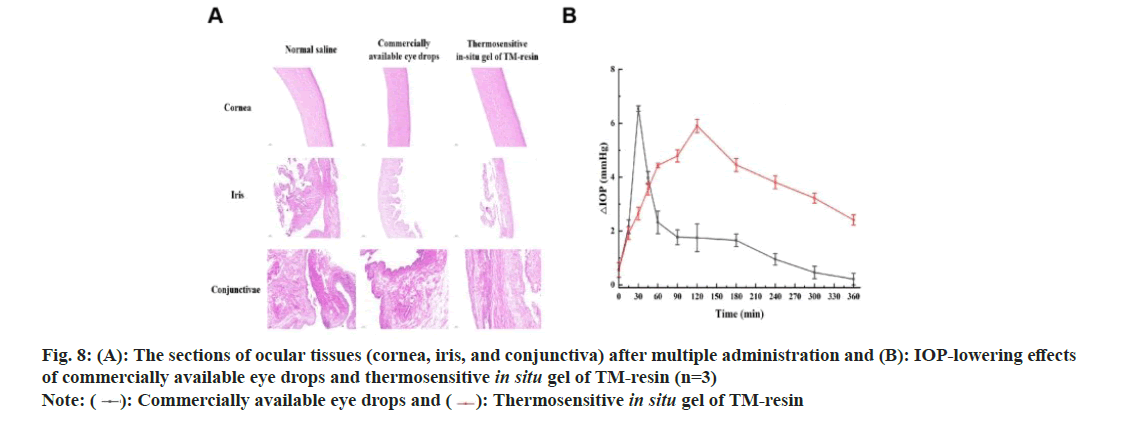
The tissue pathological sections of the cornea, iris, and conjunctiva from the homemade in situ gel group showed no significant differences compared to those from the normal saline and commercially available eye drop groups. In the cornea, the epithelial, stromal, elastic, and endothelial layers were well-structured and tightly arranged, with no signs of inflammation or edema. The stromal layer of iris exhibited tightly arranged connective tissue, with no shedding or thinning of the epithelial cells. The conjunctiva maintained its integrity, with abundant goblet cells and no structural damage or disorder (fig. 8A). These findings indicated that the homemade in situ gel caused minimal ocular irritation and demonstrated excellent biocompatibility. As shown in fig. 8B, pharmacodynamic analysis revealed that the maximum IOP-lowering effect (Tmax) occurred at 30 min for the commercial eye drops and at 120 min for the homemade gel. The maximum IOP reduction (IOPmax) for the homemade gel was 5.90±0.43 mmHg, slightly lower than the 6.55±0.17 mmHg achieved by the commercial drops. The Area Under the Curve for IOP reduction over 360 min (AUC0-360min) was significantly higher for the homemade gel (1396.05±36.21 mmHg/min) compared to the commercial eye drops (554.78±43.87 mmHg/min). Additionally, the Mean Residence Time (MRT) was longer for the homemade gel (173.13±1.93 min) than of the commercial drops (110.75±19.62 min) (Table 11). These results indicated that the homemade in situ gel had a longer retention time and provided a more sustained reduction in IOP[27].
This study developed a cation-exchange resin suitable for pharmaceutical excipients with an appropriate particle size to create an in situ gel of TM, enhancing its safety and efficacy for ophthalmic use. Compared to commercially available TM eye drops, the homemade in situ gel demonstrated a significantly prolonged drug release in vitro. The release mechanism followed Fick’s diffusion, characterized by an initial rapid release followed by a slower, sustained release. Additionally, the homemade in situ gel improved drug bioavailability, reduced ocular irritation and toxicity, and provided a gentler, longer-lasting antihypertensive effect compared to commercially available eye drops, making it a promising alternative for ocular administration. The cation-exchange resin developed in this study showed excellent performance and holds broad potential for application. The in situ gel, utilizing this resin as the drug carrier, achieves a dual sustained release effect. This dual release, both from the gel and the resin, offered a solid theoretical and practical foundation for future applications of resin in ocular treatments.
References
- Jani R, Gan O, Ali Y, Rodstrom R, Hancock S. Ion exchange resins for ophthalmic delivery. J Ocul Pharmacol 1994;10(1):57-67.
[Crossref] [Google Scholar] [PubMed]
- Qu Y, Lai WL, Xin YR, Zhu FQ, Zhu Y, Wang L, et al. Development, optimization, and evaluation in vitro/in vivo of oral liquid system for synchronized sustained release of levodopa/benserazide. AAPS PharmSciTech 2019;20:1-3.
[Crossref] [Google Scholar] [PubMed]
- Chaudhary V, Sharma S. Effect of various synthesis parameters on styrene-divinylbenzene copolymer properties. J Porous Mater 2019;26(6):1559-71.
- Kawaguchi S, Ito K. Dispersion polymerization. Polymer Particles 2005:299-328.
- Lei YL, Luo YJ, Chen F, Mei LH. Sulfonation process and desalination effect of polystyrene/PVDF semi-interpenetrating polymer network cation exchange membrane. Polymers 2014;6(7):1914-28.
- Ion exchange resins for ophthalmic delivery
- Arslan A, Ozkan CK, Sig AK, Dogan E, Esim O, Cetinkaya S, et al. Evaluation of a novel oxiconazole nitrate formulation: The thermosensitive gel. Saudi Pharm J 2018;26(5):665-72.
[Crossref] [Google Scholar] [PubMed]
- Jiang M, Zheng Z. Effects of multiple environmental factors on the growth and extracellular organic matter production of Microcystis aeruginosa: A central composite design response surface model. Environ Sci Pollut Res 2018;25:23276-85.
- Tian S, Li J, Tao Q, Zhao Y, Lv Z, Yang F, et al. Controlled drug delivery for glaucoma therapy using montmorillonite/Eudragit microspheres as an ion-exchange carrier. Int J Nanomedicine 2018:415-28.
[Crossref] [Google Scholar] [PubMed]
- Al-Bazzaz FY, Al-Kotaji MY. Ophthalmic in-situ sustained gel of ciprofloxacin, preparation and evaluation study. Int J App Pharm 2018;10(4):153-61.
- Andreadis II, Karavasili C, Thomas A, Komnenou A, Tzimtzimis M, Tzetzis D, et al. In situ gelling electrospun ocular films sustain the intraocular pressure-lowering effect of timolol maleate: In vitro, ex vivo, and pharmacodynamic assessment. Mol Pharm 2021;19(1):274-86.
[Crossref] [Google Scholar] [PubMed]
- Wang J, Yu J, Li M, Zhang Y. Synthesis of sodium polystyrene sulfonate resins for the removal of methylene blue from wastewater. J Taiwan Inst Chem Eng 2024;159:105501.
- Chiang CH, Tung SM, Lu DW, Yeh MK. In vitro and in vivo evaluation of an ocular delivery system of 5-fluorouracil microspheres. J Ocul Pharmaco 2001;17(6):545-53.
- Agnihotri SA, Aminabhavi TM. Chitosan nanoparticles for prolonged delivery of timolol maleate. Drug Dev Ind Pharm 2007;33(11):1254-62.
[Crossref] [Google Scholar] [PubMed]
- Pisal SS, Paradkar AR, Mahadik KR, Kadam SS. Pluronic gels for nasal delivery of vitamin B12. part I: Preformulation study. Int J Pharm 2004;270(1-2):37-45.
[Crossref] [Google Scholar] [PubMed]
- Fathalla ZM, Vangala A, Longman M, Khaled KA, Hussein AK, El-Garhy OH, et al. Poloxamer-based thermoresponsive ketorolac tromethamine in situ gel preparations: Design, characterisation, toxicity and transcorneal permeation studies. Eur J Pharm Biopharm 2017;114:119-34.
[Crossref] [Google Scholar] [PubMed]
- Huang C, Peng L, Xu X, Lu Y, Wang X, Lan Z, et al. Preparation and characteristics of a thermosensitive in situ gel loaded with chitosan nanoparticles for optimal ocular delivery of chloramphenicol. J Drug Deliv Technol 2023;89:104962.
- Barse R, Kokare C, Tagalpallewar A. Influence of hydroxypropylmethylcellulose and poloxamer composite on developed ophthalmic in situ gel: Ex vivo and in vivo characterization. J Drug Deliv Technol 2016;33:66-74.
- Chen L, Han X, Xu X, Zhang Q, Zeng Y, Su Q, et al. Optimization and evaluation of the thermosensitive in situ and adhesive gel for rectal delivery of budesonide. AAPS PharmSciTech 2020;21:1-2.
[Crossref] [Google Scholar] [PubMed]
- Xingqi W, Yong Z, Xing L, Yang W, Jie H, Rongfeng H, et al. Cubic and hexagonal liquid crystal gels for ocular delivery with enhanced effect of pilocarpine nitrate on anti-glaucoma treatment. Drug Deliv 2019;26(1):952-64.
[Crossref] [Google Scholar] [PubMed]
- Patton TF, Robinson JR. Ocular evaluation of polyvinyl alcohol vehicle in rabbits. J Pharm Sci 1975;64(8):1312-6.
[Crossref] [Google Scholar] [PubMed]
- Gratieri T, Gelfuso GM, Rocha EM, Sarmento VH, de Freitas O, Lopez RF. A poloxamer/chitosan in situ forming gel with prolonged retention time for ocular delivery. Eur J Pharm Biopharm 2010;75(2):186-93.
[Crossref] [Google Scholar] [PubMed]
- Irwin WJ, Belaid KA, Alpar HO. Drug-delivery by ion-exchange: Part IIII: Interaction of ester pro-drugs of propranolol with cationic exchange resins. Drug Dev Ind Pharm 1987;13(9-11):2047-66.
- Rajesh AM, Popat KM. Taste masking of azithromycin by resin complex and sustained release through interpenetrating polymer network with functionalized biopolymers. Drug Dev Ind Pharm 2017;43(5):732-41.
[Crossref] [Google Scholar] [PubMed]
- Kim YC, Shin MD, Hackett SF, Hsueh HT, Limae SR, Date A, et al. Gelling hypotonic polymer solution for extended topical drug delivery to the eye. Nat Biomed Eng 2020;4(11):1053-62.
[Crossref] [Google Scholar] [PubMed]
- Luo Z, Jin L, Xu L, Zhang ZL, Yu J, Shi S, et al. Thermosensitive PEG-PCL-PEG (PECE) hydrogel as an in situ gelling system for ocular drug delivery of diclofenac sodium. Drug Deliv 2016;23(1):63-8.
[Crossref] [Google Scholar] [PubMed]
- Ammar HO, Salama HA, Ghorab M, Mahmoud AA. Nanoemulsion as a potential ophthalmic delivery system for dorzolamide hydrochloride. AAPS PharmSciTech 2009;10:808-19.
[Crossref] [Google Scholar] [PubMed]
