- *Corresponding Author:
- Yuming Wang
Department of Laboratory, Department of Thoracic Surgery, The Second Affiliated Hospital of Kunming Medical University, Yunnan Province 650101, China
E-mail: wangym992011@163.com
| This article was originally published in a special issue, “Drug Discovery and Repositioning Studies in Biopharmaceutical Sciences” |
| Indian J Pharm Sci 2024:86(4) Spl Issue “181-191” |
This is an open access article distributed under the terms of the Creative Commons Attribution-NonCommercial-ShareAlike 3.0 License, which allows others to remix, tweak, and build upon the work non-commercially, as long as the author is credited and the new creations are licensed under the identical terms
Abstract
Plakophilin 3 as key regulators of different signaling programs and control a variety of cellular processes, including transcription, protein synthesis, growth, proliferation, and tumor development. However, the potential biological functions and mechanisms of plakophilin 3 in lung adenocarcinoma progression are unknown. In this study, we investigated the role of plakophilin 3 gene in lung adenocarcinoma and found that plakophilin 3 gene expression was significantly increased in datasets extracted from the cancer genome atlas. Gene set enrichment analysis enrichment confirmed that plakophilin 3 gene was significantly related to 8 pathways, which indicated that plakophilin 3 gene, affected the occurrence and development of lung adenocarcinoma. In addition, the results of gene ontology and Kyoto encyclopedia of genes and genomes pathway enrichment of differentially expressed genes indicate plakophilin 3 genes mean expression in lung adenocarcinoma patients, which included the necroptosis, and apoptosis. The following genes have been shown to be associated with this pathway, including CAPN1, FAM83H, plakophilin 3, EPS8L2, SSH3 and SLC25A22. Besides, single-sample gene set enrichment analysis enrichment showed that plakophilin 3 gene expression was correlated with immune response-related signaling pathways. In addition, by studying plakophilin 3 gene and drug net, we found that the plakophilin 3 genes associated with lung adenocarcinoma chemotherapy drug resistance. Similarly, the results of the plakophilin 3 gene and our clinical sample results also confirmed that plakophilin 3 gene was highly expressed in lung adenocarcinoma and correlated with adverse clinical outcomes. In this study, our data demonstrated that plakophilin 3 gene is associated with lung adenocarcinoma necrotizing apoptosis and immune infiltration, is associated with the development of lung adenocarcinoma, and can be used as a potential diagnostic and prognostic biomarker of lung adenocarcinoma.
Keywords
Lung adenocarcinoma, plakophilin 3 gene, necroptosis, immunity, microenvironment
Lung cancer is histologically divided into Small Cell Lung Cancer (SCLC) and Non-SCLC (NSCLC). Non-SCLC accounts for 85 % of total lung cancers, while Lung Adenocarcinoma (LUAD) accounts for nearly 60 % of total NSCLC[1]. Many genetic alterations associated with the development and progressions of lung cancer have been reported, but the exact molecular mechanisms remain unclear. Although there are many kinds of treatment, the 5 y survival rate of lung cancer is still very low[2]. Therefore, elucidating the molecular mechanism of the occurrence and development of lung cancer and searching for new therapeutic targets or biomarkers are crucial to effectively prevent the development of lung cancer.
Studies have shown that necrosis-associated pathways influence the onset and progression of LUAD and predict its treatment and prognosis. Diao et al.[3] proposed that Necrosis apoptosis-Related LncRNA Signature (NRLSig) provides a new target for LUAD treatment[4]. Necrotic molecules are closely associated with LUAD formation and Abdelfatah et al.[5] found that MCC1019 inhibited the growth of A549 LUAD cells by inactivating the Protein Kinase-B (AKT) signaling pathway and inducing necrotic sclerosis. Recent studies have found that necroptosis is a form of inflammatory cell death that affects cancer progression and that Necroptosis-Related Genes (NRGs) predict survival in squamous lung cancer, but prognostic prediction of LUAD has not been clarified. The aim of this study was to screen and validate necroptosis gene markers associated with LUAD prognosis[6-10].
In addition, the interaction between cancer cells and the tumour microenvironment (especially the immune environment) is crucial for tumor development and treatment[4]. The immune microenvironment, including immune cells and cytokines, has complex interactions with cancer cells. Tumor cells can manipulate the immune environment to evade immune attack, while the tumor microenvironment also influences immune cell activity. Infiltrating immune cells significantly affect the efficacy of chemotherapy and immunotherapy. Understanding the mechanisms of immune cell function is essential for identifying targets for new immunotherapies and optimizing therapeutic strategies.
Plakophilin 3 (PKP3) promotes NSCLC growth and invasion. Furukawa et al.[11] found that PKP3 overexpression in non-small cell carcinoma cell lines enhanced cell motility and invasion. Other studies have shown PKP3 to be highly expressed in a variety of adenocarcinomas. PKP3 is associated with Ribonucleic Acid (RNA) metabolism and posttranscriptional regulation of genes in stress granules. The expression of PKP3 in NSCLC tissues is higher than that in normal tissues, and correlates with shorter survival of the patients and higher tumor grade, making it a potential prognostic indicator and therapeutic target in lung cancer. In this study, we compared PKP3 gene expression in NSCLC tissues with that in normal tissues. In this study, we compared the expression of PKP3 gene in LUAD tissues and normal samples, and explored its correlation with LUAD necrosis. Meanwhile, specific microRNA (miRNA) in the PKP3-miRNA-messenger RNA (mRNA) regulatory network was screened and the correlation between PKP3 gene expression and immune infiltration was analyzed to explore its potential mechanism in LUAD progression. Ultimately, PKP3 gene was found to have prognostic and diagnostic value in LUAD[12,13].
Materials and Methods
Data extraction:
The DESeq2 R package[14] (v 1.26.0) of the R used to obtain the RNA sequencing profile (level 3 HTSeq-Counts) for LUAD patients from The Cancer Genome Atlas (TCGA) program data portal (https:// portal.gdc.cancer.gov/). The Gene Expression Omnibus (GEO) query package of the R software was used to obtain the gene expression profiles Gene Set Enrichment (GSE)[15], which all samples from Homo sapiens for LUAD patients was obtained from the GEO database (https://www.ncbi.nlm.nih.gov/geo/). Based on GPL13497, GSE140797 as test set[16], included LUAD tissue specimens (n=7), normal lung tissue specimens (n=7). Affy package was used to read the original data of GSE140797 dataset for background correction and data normalization[17], and the gene expression matrices of the two datasets were obtained respectively.
Differential expression gene screening:
The limma packages were applied to show the difference distribution of Differentially Expressed Genes (DEGs)[18], screened DEGs were used to create a heat map and volcano plot by the heatmap package and the ggplot2 package[19,20]; the DEGs satisfy p<0.05 as well as log2FC>2. List DEGs of NRGs were obtained from the GeneCards database (https://www.genecards.org/)[21]. Next, the genes of TCGA LUAD, GEO GSE140797 and list of NRGs were intersected using Venn diagram.
Prediction of Protein-Protein Interaction (PPI) networks:
String database (https://string-db.org/) was used to predict PPI to construct PPI networks of selected genes[22]. Analyzing the functional interactions between proteins of DEG gene, genes with interaction score >0.4 were selected to build a visualize network by the Cytoscape software (V3.7.2), and the hub gene was screened using the Cytohbba plug-in.
Receiver Operating Characteristic (ROC) curve:
The model for molecular expression and prediction of PKP3 was developed, and the ROC curve analysis was employed to assess its predictive performance. Analysis was conducted using the pROC package and visualization with the ggplot2 package[23]. The comparison focused on normal vs. tumor clinical variables. Diagnostic accuracy was assessed through the Area Under the Curve (AUC) of the ROC curve, where a higher AUC value indicates superior diagnostic efficacy. AUC ranges from 0.5 to 0.7 indicated low accuracy, from 0.7 to 0.9 suggested moderate accuracy, and an AUC exceeding 0.9 signified high accuracy.
Gene Expression Profiling Interactive Analysis (GEPIA) database was used to query gene expression distribution throughout the body:
GEPIA database[24], a web site for cancer and normal gene expression analysis and interaction analysis, was used to query PKP3 gene expression distribution throughout the body.
Functional enrichment analysis:
ClusterProfiler package was used to conduct Gene Ontology (GO) and Kyoto Encyclopedia of Genes and Genomes (KEGG) pathway enrichment analysis of DEGS[25], p<0.05 considered to be statistically significant enrichment. Path view package showed pathway maps of pathways enriched by KEGG[26]. GOSemSim package performed friends analysis of differential proteins[27]. Similarly, the pathways enriched by GO and KEGG were subjected to the GSE Analysis (GSEA). Gene Set Variation Analysis (GSVA) package was used to conduct GSVA of each pathway in each sample[28].
Target genes and miR-network analysis and transcription factor network analysis:
The miRNA associated with DEGs was predicted from the miRWalk (http://zmf.umm.uni-heidelberg. de/apps/zmf/mirwalk2/) database[29]; the possible transcription factors of DEGs was predicted from the TRRUST2 (https://www.grnpedia.org/trrust/) database[30]. Cytoscape software was used to visualize the correlation results of DEGs with transcription factors and tissues.
Target genes and drug response:
The processed data set was obtained from the cell Miner database[31] (https://discover.nci.nih.gov/ cellminer/home.do), the RNA sequencing profile (level 3 HTSeq-Counts) for LUAD patients was obtained from the TCGA data portal (https://portal. gdc.cancer.gov/), RNA expression data (RNA: RNA-SEQ) and drug data (Compound activity: DTP NCI-60) were selected and drug sensitivity analysis was performed using impute package and limma package[32].
Evaluation of immune infiltration:
By applying single-sample GSEA (ssGSEA) method from GSVA package in R software (version4.0.2), analyzed quantified GSVA in individual samples. Subsequently, the sample distribution of different subclasses of 28 immune cells was observed.
Survival prognosis analysis:
Statistical analysis of survival data for PKP3 was performed using the survival package[33], used survminer package for visualization. Grouped by 0-50 and 50-100, and prognosis of type is overall survival, we analysis the data of TCGA and LUAD.
The time ROC package was used for time-wise ROC analysis of PKP3, and the ggplot2 package is used for visualization, and prognosis of type is overall survival[34].
A nomogram was constructed based on the results of the multivariate analysis; obtained nomogram can use to analysis the probability of a patient event for external prognostic data. The rms package and survival package was used to conduct nomogram analysis and calibration analysis[35], and prognosis of PKP3 and Tumor, Node and Metastasis (TNM) staging variables in 1 y was predicted.
Genetic mutation:
We explored the PKP3 gene mutation in patients with lung cancer with cBbio portal database (https:// www.cbioportal.org/).
Human Platelet Antigen (HPA) database:
We explored the protein expression of PKP3 gene in patients with lung cancer and paracancerous tissue with HPA database (https://www.proteinatlas.org).
Quantitative Real Time-Polymerase Chain Reaction (qRT-PCR):
Total RNA was extracted from tissue specimens using TRIZOL reagent (Invitrogen, California, United States of America (USA)). Complementary Deoxyribonucleic Acid (cDNA) was synthesized according to the instructions of the FastKing RT kit (With gDNase) cDNA is used in qRT-PCR as a specific primer with different genes. qRT-PCR reactions were performed on a 96-well PCR plate (LightCycler® 480 Multi well) using the Taq Pro Universal SYBR qPCR Master Mix Kit (TQ712-02) placed in a LightCycle 96 instrument. The relative expressions of miRNA and mRNA were normalized by Glyceraldehyde 3-Phosphate Dehydrogenase (GAPDH) and calculated by 2-△△CT method. The primer sequences used for qRT-PCR are as follows; GAPDH (H)-forward 5'-TTGCCCTCAACGACCACTTT-3'; GAPDH (H)- reverse 5'-TGGTCCAGGGGTCTTACTCC-3'; PKP3 (H)-forward 5'-TGCTGGTCAACATCATAG-3' and PKP3 (H)- reverse 5'-GAGTCCGTCAAAATACAG-3'.
Protein extraction and Western blotting:
Proteins are extracted from tissue specimens by Radioimmunoprecipitation Assay (RIPA) mixed with 1 % protease inhibitors and phosphorylase inhibitors, and the concentration of the proteins is checked by the protein Ultra Violet (UV) mode of the IMPLEN ultra micro volume spectrophotometer. Samples were separated using Sodium Dodecyl Sulphate- Polyacrylamide Gel Electrophoresis (SDS-PAGE) and then transferred to Polyvinylidene Difluoride (PVDF) membranes. The blot was blocked with an antibody blocking solution and then incubated overnight with a generic primary antibody (Sewell GB23303) against PKP3 and GAPDH. The GAPDH antibody was used as a loading control. After washing with Tris-Buffered Saline with 0.1 % Tween® 20 Detergent (TBST), the PVDF membrane was incubated with enzyme-labeled secondary antibody (abmart M21001S) for 120 min. Subsequently, using the Enhanced Chemiluminescence (ECL) luminescence signal gel imager (Tanon), the A and B solutions in the ECL kit were piped and mixed in a 1:1 ratio, and evenly added dropwise to the membrane for image acquisition. Quantitative analysis of proteins was performed by software ImageJ.
Statistical analysis:
The statistical analyses were performed using the R software (version4.0.2). For the comparison of the two groups of continuous variables, the statistical significance of the normally distributed variables was estimated using the independent student test, and the differences between the non-normally distributed variables were analyzed using the Mann-Whitney U test (i.e., Wilcoxon rank-sum test). The Chi-square (χ2) test or Fisher’s exact test was used to compare and analyze the statistical significance between the two groups of categorical variables. The correlation coefficients of different genes were calculated by Pearson correlation analysis. All statistical p values were bilateral, and p<0.05 was considered statistically significant.
Results and Discussion
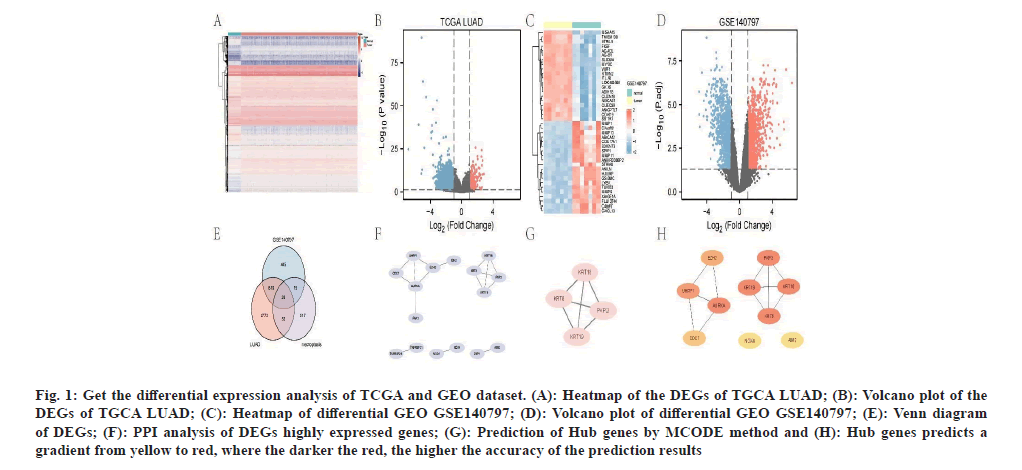
We used R software to select 3471 DEGs from the gene expression matrix of the TCGA dataset, as shown in fig. 1A and fig. 1B. We used R to select 1105 DEGs from the gene expression matrix of the GEO dataset, as shown in fig. 1C and fig. 1D. Subsequently, we screened 611 necrosis-associated genes from the gene cards; 26 DEGs of necrosisassociated genes were selected using Venn plots (fig. 1E). PPI of the DEGs genes were analyzed using the string database (fig. 1F).The target genes predicted by MCODE included PKP3, Keratin (KRT)-19, KRT18 and KRT8 (fig. 1G); the top 10 target genes predicted by Cytohbba (fig. 1H) included NADPH Oxidase 4 (NOX4), Ubiquitin like with PHD and Ring Finger domain 1 (UHRF1), KRT8, Enhancer of Zeste 2 Polycomb Repressive Complex 2 (EZH2), and KRT19, Cell Division Cycle 7 (CDC7), PKP3, Aurora Kinase A (AURKA), KRT1 and Absent in Melanoma 2 (AIM2).
Fig. 1: Get the differential expression analysis of TCGA and GEO dataset. (A): Heatmap of the DEGs of TGCA LUAD; (B): Volcano plot of the DEGs of TGCA LUAD; (C): Heatmap of differential GEO GSE140797; (D): Volcano plot of differential GEO GSE140797; (E): Venn diagram of DEGs; (F): PPI analysis of DEGs highly expressed genes; (G): Prediction of Hub genes by MCODE method and (H): Hub genes predicts a gradient from yellow to red, where the darker the red, the higher the accuracy of the prediction results
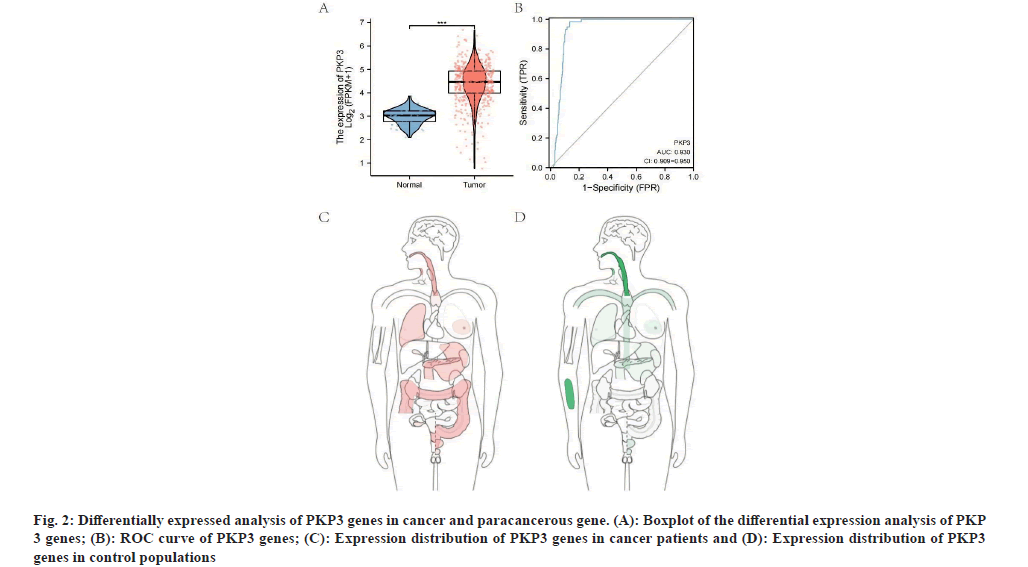
PKP3 genes were up-regulated in LUAD through TCGA LUAD database (p<0.001) (fig. 2A). The predictive power of the variable PKP3 had high accuracy (AUC=0.930, CI=0.909-0.950) (fig. 2B) with predicting tumor and normal outcomes. The PKP3 gene is mainly distributed in the esophagus, lung and gastrointestinal tract of tumor patients (fig. 2C); however, it is more distributed in the esophagus and bones of normal people (fig. 2D).
Fig. 2: Differentially expressed analysis of PKP3 genes in cancer and paracancerous gene. (A): Boxplot of the differential expression analysis of PKP 3 genes; (B): ROC curve of PKP3 genes; (C): Expression distribution of PKP3 genes in cancer patients and (D): Expression distribution of PKP3 genes in control populations
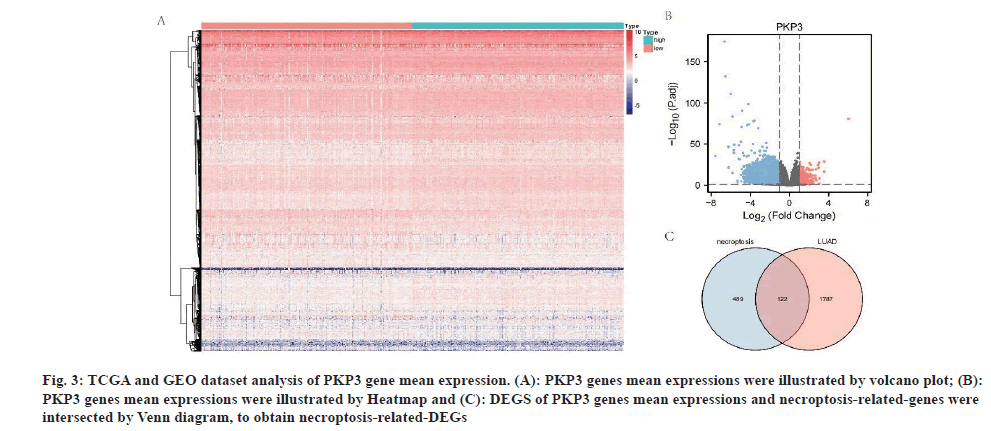
After data preprocessing, we used the R software to analyze the heatmap (fig. 3A) and the volcano plot (fig. 3B) from the TCGA dataset with the median PKP3 gene expression value; searched 122 DEGs and necroptosis-related-genes DEGs by Venn diagram (fig. 3C).
Fig. 3: TCGA and GEO dataset analysis of PKP3 gene mean expression. (A): PKP3 genes mean expressions were illustrated by volcano plot; (B): PKP3 genes mean expressions were illustrated by Heatmap and (C): DEGS of PKP3 genes mean expressions and necroptosis-related-genes were intersected by Venn diagram, to obtain necroptosis-related-DEGs
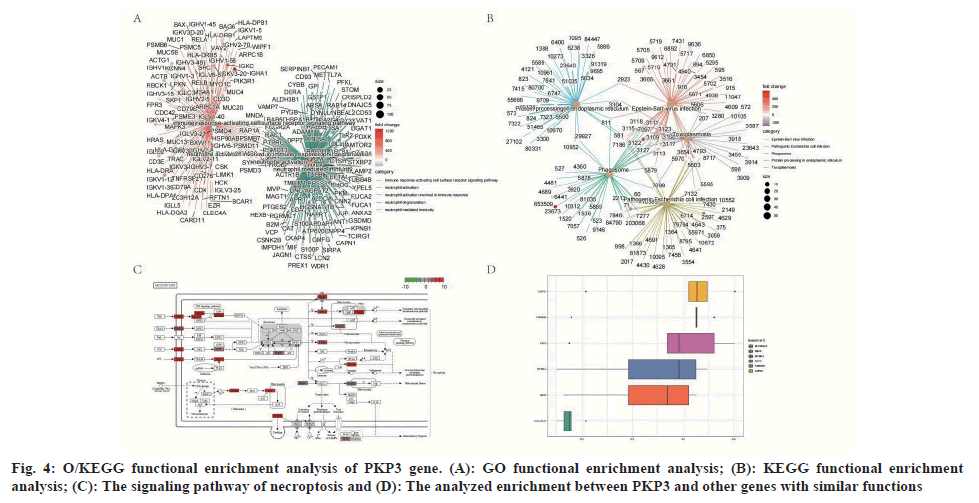
To better understand the functional implications of PKP3 genes from the 122 DEGs between PKP3 genes mean expressions, GO and KEGG functional enrichment analysis was performed by clusterProfiler package, GO enrichment analyses were performed within Metascape. In the biological process category, 5 enriched GO terms were observed, which is neutrophil degranulation, neutrophil mediated immunity, neutrophil activation involved in immune response, neutrophil activation, immune responseactivating cell surface receptor signaling pathway; categorization by cellular component revealed 5 enriched GO terms, and they were mainly associated with focal adhesion, cell-substrate junction, secretory granule lumen, ficolin-1-rich granule, cytoplasmic vesicle lumen; Moreover, the molecular function category revealed 5 significant enrichment in GO terms associated with the cadherin binding, antigen binding, Major Histocompatibility Complex (MHC) class II protein complex binding, ubiquitinlike protein ligase binding, MHC protein complex binding are shown in fig. 4A.
The results (fig. 4A-fig. 4D) of GO terms and KEGG pathway enrichment of DEGs reveal PKP3 genes mean expressions expression in LUAD patients, which included the necroptosis, and apoptosis. The path view enrichment pathways were mainly involved in the pathway necroptosis (fig. 4C). The Friends analysis showed the functional correlation of the CAPN1, Family with Sequence Similarity 83 Member H (FAM83H), PKP 3, EPS8 Signaling Adaptor L2 (EPS8L2), Slingshot Protein Phosphatase 3 (SSH3), and Solute Carrier Family 25 Member 22 (SLC25A22) genes (fig. 4D).
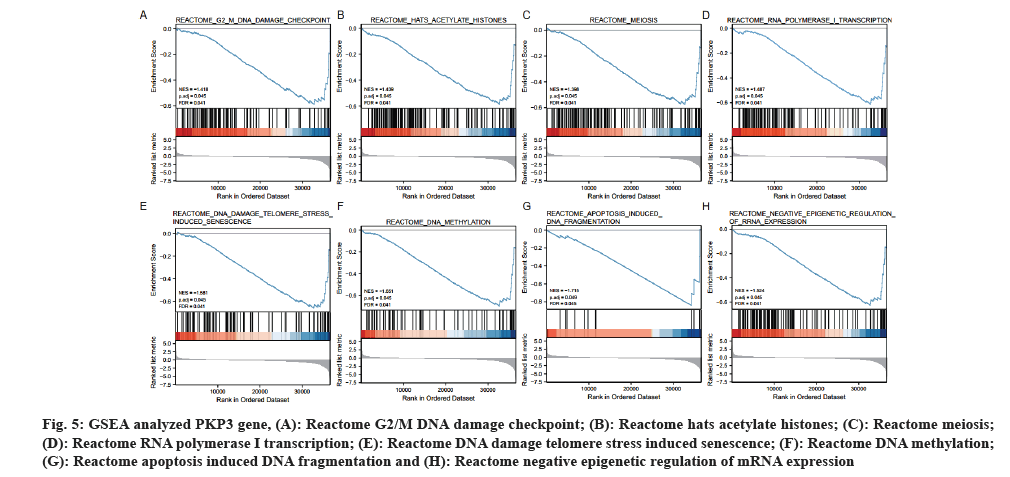
GSEA was used to identify signaling pathways involved in LUAD between PKP3 gene expression data sets, and demonstrated significant differences. Pathways enriched by GSEA are mainly involved 8 pathways, including the reactome G2/M DNA damage checkpoint, reactome hats acetylate histones, reactome meiosis, reactome RNA polymerase I transcription, reactome DNA damage telomere stress induced senescence, reactome DNA methylation, reactome apoptosis induced DNA fragmentation, reactome negative epigenetic regulation of rRNA expression (fig. 5A-fig. 5H), indicating the potential role of PKP3 gene in the development of LUAD.
Fig. 5: GSEA analyzed PKP3 gene, (A): Reactome G2/M DNA damage checkpoint; (B): Reactome hats acetylate histones; (C): Reactome meiosis; (D): Reactome RNA polymerase I transcription; (E): Reactome DNA damage telomere stress induced senescence; (F): Reactome DNA methylation; (G): Reactome apoptosis induced DNA fragmentation and (H): Reactome negative epigenetic regulation of mRNA expression
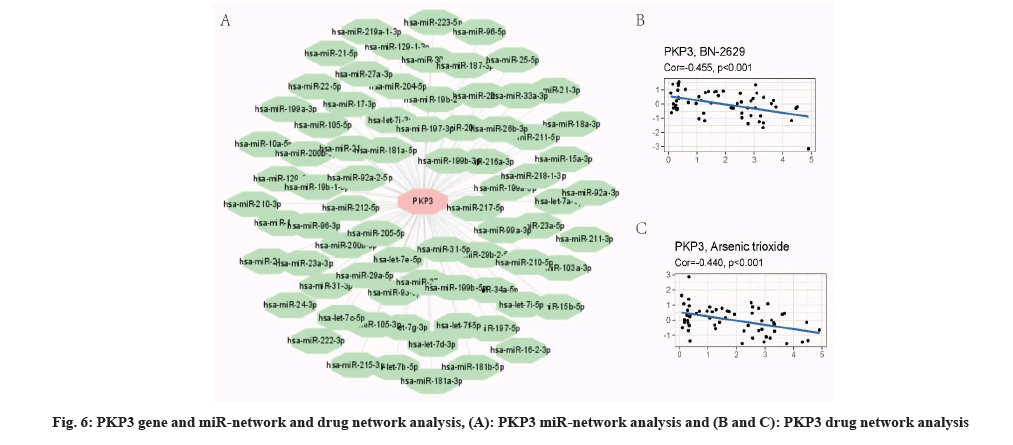
We predicted 1940 miRNA associated PKP3 gene by miRWalk, and selected top 100 to performed visual analysis (fig. 6A). In addition, studied PKP3 and drug net, we found that the resistance relationship between PKP3 and BN-2629 (Corr=0.455, p<0.001) (fig. 6B). Similarly, the results show that the resistance relationship between PKP3 and arsenic trioxide (Corr=0.556, p<0.001) (fig. 6C), and the resistance relationship between NUDT2 and pyrazoloacridine (Corr=0.440, p<0.001).
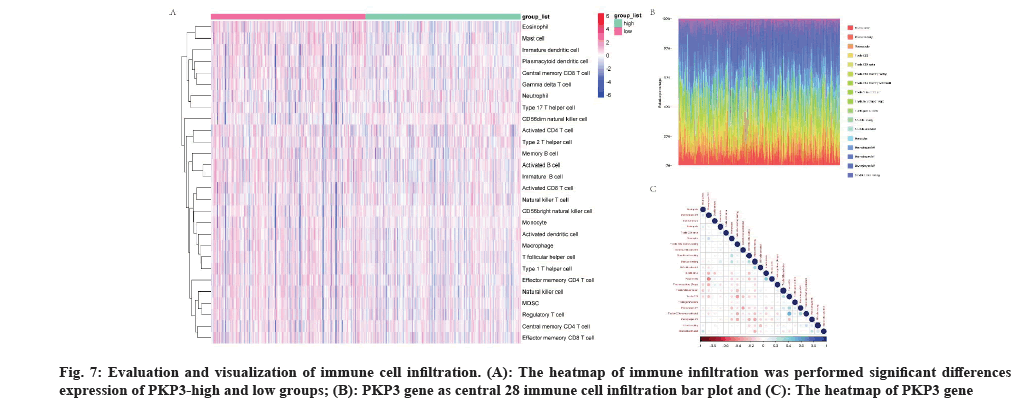
The heatmap of immune infiltration was performed significant differences expression of PKP3 gene-high and low groups (fig. 7A) and the relative abundances of 28 immune cells (fig. 7B) and correlative analysis of diverse immune cells (fig. 7C).
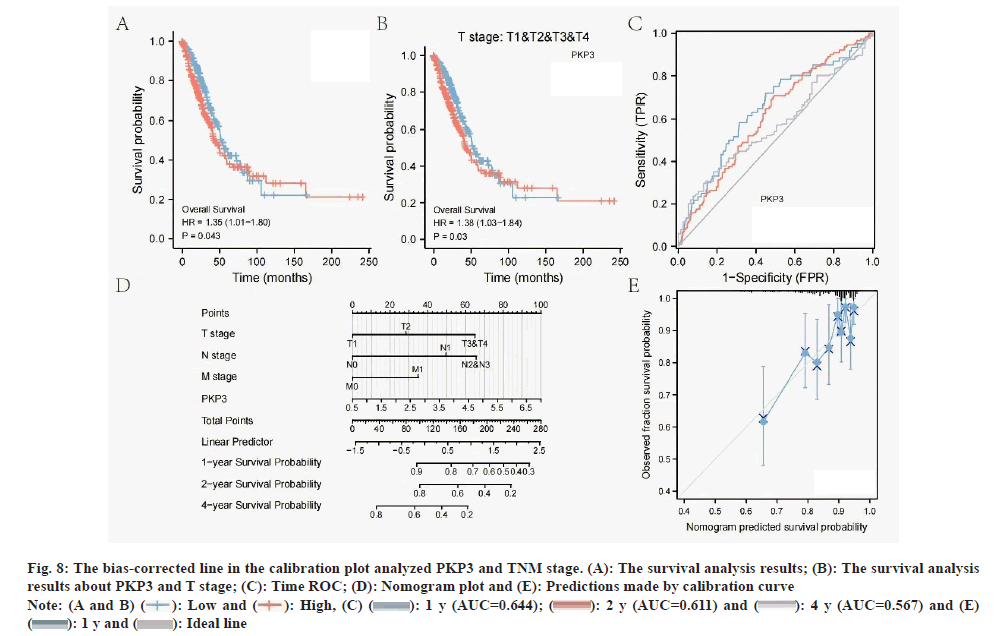
Survival analysis showed that the high PKP3 expression group had a worse prognosis with a statistically significant difference (p=0.03<0.05) (fig. 8A). The results of the survival analysis of patients with PKP3 combined with T stage indicated that patients with high PKP3 gene expression had a poor prognosis in the same T stage patients (p=0.03<0.05) (fig. 8B). We performed time ROC analysis of data from cancer and para-cancer to measure PKP3, and the results showed an AUC of the 1 y was 0.644; 2 y was 0.611; and 4 y was 0.567 (fig. 8C). The results showed nomogram (fig. 8D) and calibration plot for predicting (fig. 8E).
Fig. 8: The bias-corrected line in the calibration plot analyzed PKP3 and TNM stage. (A): The survival analysis results; (B): The survival analysis
results about PKP3 and T stage; (C): Time ROC; (D): Nomogram plot and (E): Predictions made by calibration curve Note: (A and B) ( ): Low and (
 ): High, (C) (
 ): 1 y (AUC=0.644); (
 ): 2 y (AUC=0.611) and (
 ): 4 y (AUC=0.567) and (E)
(
 ): 1 y and (
 ): Ideal line
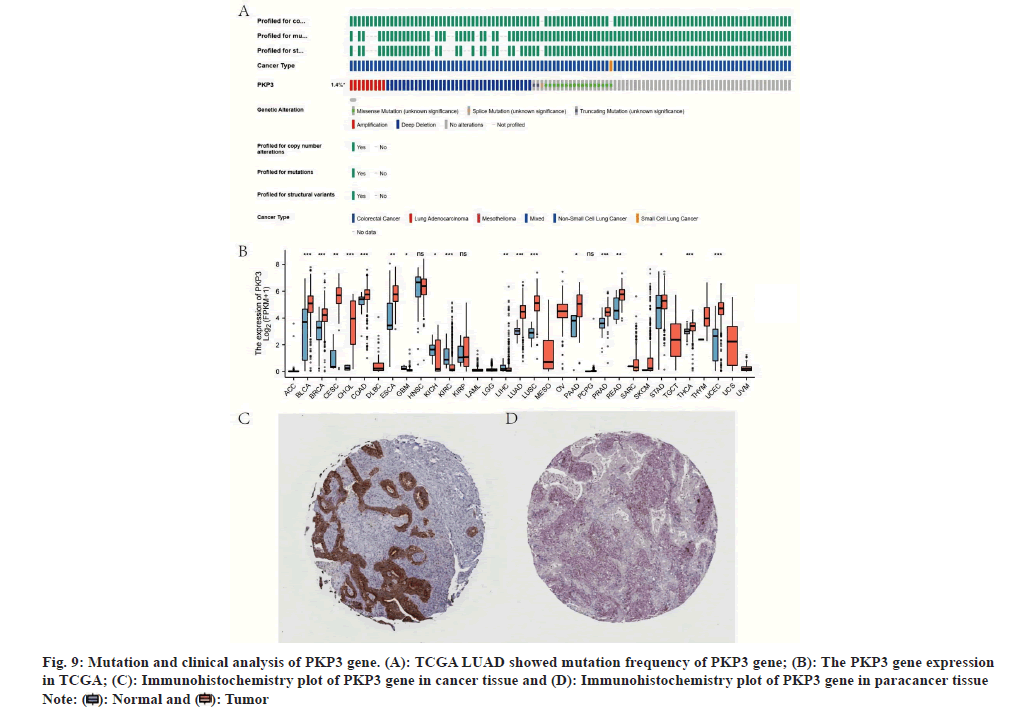
Using cBioPortal dataset, we explored mutation frequency of PKP3 gene (fig. 9A) and its expression in TCGA pan-cancer (fig. 9B). Immunohistochemistry analysis showed that a higher PKP3 gene expression in lung cancer than paracancerous (fig. 9C and fig. 9D).
Fig. 9: Mutation and clinical analysis of PKP3 gene. (A): TCGA LUAD showed mutation frequency of PKP3 gene; (B): The PKP3 gene expression
in TCGA; (C): Immunohistochemistry plot of PKP3 gene in cancer tissue and (D): Immunohistochemistry plot of PKP3 gene in paracancer tissue Note: ( ): Normal and (
 ): Tumor
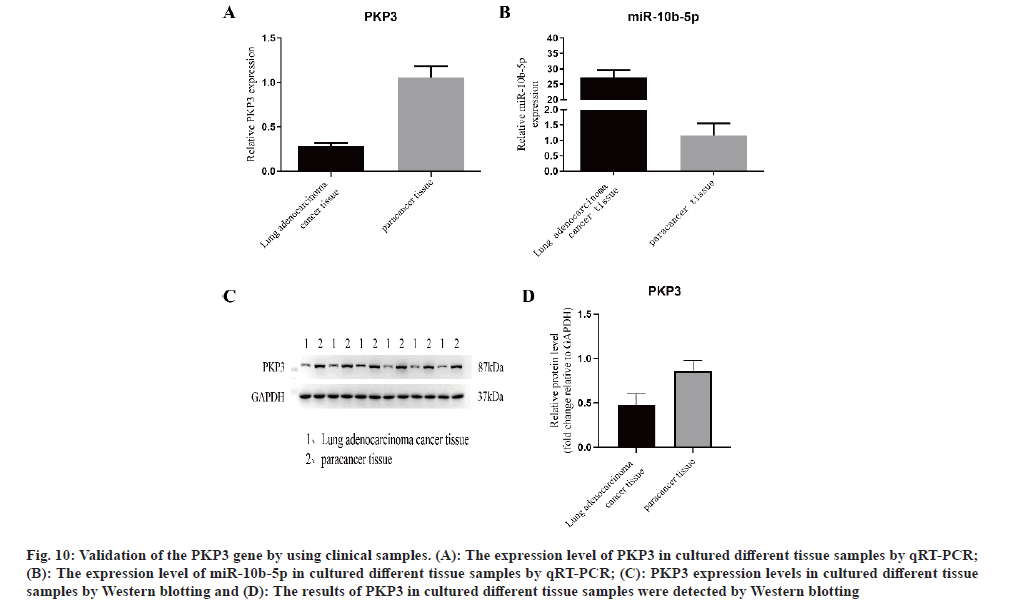
We obtained the corresponding cancerous tissues and adjacent tissues from the surgically resected tissue samples of 6 patients with LUAD, and performed qRT-PCR and Western blotting, respectively. The results of qRT-PCR showed that (fig. 10A and fig. 10B) the expression of PKP3 in cancer tissues was significantly increased compared with adjacent tissue samples, while the expression of miR-10b-5p was significantly decreased in cancer tissues. The results of Western blotting also showed (fig. 10C and fig. 10D) that the expression of PKP3 in cancer tissues was significantly increased compared with adjacent tissue samples. The above results provide a clinical validation of our data-mining results, confirming that PKP3 is highly expressed in LUAD and is associated with adverse clinical outcomes, and miR-10b-5p is a protective factor for LUAD.
Fig. 10: Validation of the PKP3 gene by using clinical samples. (A): The expression level of PKP3 in cultured different tissue samples by qRT-PCR; (B): The expression level of miR-10b-5p in cultured different tissue samples by qRT-PCR; (C): PKP3 expression levels in cultured different tissue samples by Western blotting and (D): The results of PKP3 in cultured different tissue samples were detected by Western blotting
Lung cancer has a high incidence and mortality rate among malignant tumors, resulting in a huge social and economic burden. In 2022, about 870 000 new cases and nearly 770 000 deaths were reported in China, with lung cancer having the heaviest cancer burden. LUAD is the main type of lung cancer with poor prognosis and high treatment cost, which brings huge economic pressure to patients and families[36]. LUAD has complex pathogenesis and poor prognosis. It has been found that comprehensive biomarkers can increase the accuracy of prognostic prediction and improve the prognosis. PKP3 is associated with a variety of tumor progression and affects cell migration and invasion in vitro. There are few reports on PKP3 gene regulation of necroptosis in LUAD.
Our study showed that two software screened different target genes, namely PKP3, KRT19, KRT18, NOX4, UHRF1, KRT8, EZH2, CDC7, AURKA, KRT1, and AIM2. The variable PKP3 had high accuracy in predicting tumor and normal outcomes (AUC=0.930, CI=0.909-0.950). GO and KEGG analyses confirmed that the PKP3 gene was significantly associated with immune regulation, apoptosis, and oncogene regulation, and may play an important role in LUAD progression.
Necrosis-induced inflammatory response promotes tumour development and metastasis[37]. PKP3 gene is involved in epigenetic regulation of LUAD. In this study, we investigated how PKP3 gene affects LUAD progression. GSEA enrichment showed that PKP3 gene is tightly associated with 8 pathways that affect the progression of LUAD. In GO items and DEGs KEGG pathway enrichment, PKP3 gene expression in LUAD patients involved necrosis, apoptosis and so on. Relevant genes included CAPN1, FAM83H, PKP3, EPS8L2, SSH3, and SLC25A22. Studies of PKP3 and drug networks revealed PKP3 resistance to BN-2629 (Corr=0.455, p<0.001) and PKP3 resistance to arsenic trioxide (Corr=0.556, p<0.001). NUDT2 also showed a resistant relationship with pyrazolopyridine (Corr=0.440, p<0.001). These results suggest that PKP3 has limited sensitivity to chemotherapy.
In the analysis of survival outcomes, low PKP3 gene expression was associated with poor prognosis, suggesting a role in the development of LUAD. Immunohistochemistry showed that PKP3 expression was higher in LUAD than in paraneoplastic carcinoma and correlated with poor clinical outcomes. Our study reveals that PKP3 is involved in the necrosis mechanism of LUAD and has prognostic predictive and immunotherapeutic potential through miRNAmRNA regulatory network. Although improving the understanding of the relationship between PKP3 and LUAD, limitations exist. The role of PKP3 in the regulation of the LUAD tumor microenvironment was not validated and in vivo experiments to verify its regulation in LUAD necrosis are lacking.
In conclusion, our results indicate that PKP3 gene expression is significantly increased in LUAD and demonstrated to be associated with necroptosis and immune infiltration, which may serve as a potential diagnostic and prognostic biomarker for LUAD. This may provide new ideas for the diagnosis and treatment of LUAD.
Funding:
This work was supported by grants from the Yunnan Provincial Department of Science and Technology Provincial Basic Research Program (No: 2019FE001- 229) and the Yunnan Health Training Project of High Level Talents (No: D-2018041)
Author’s contributions:
Yuming Wang and Genfa Yi have contributed the same to the article and are the corresponding authors. Ying Hu, Xin Liu and Daoxiong Wu have contributed same to this work and they were considered as first authors.
Conflict of interests:
The authors declared no conflict of interests.
References
- Bray F, Ferlay J, Soerjomataram I, Siegel RL, Torre LA, Jemal A. Global cancer statistics 2018: GLOBOCAN estimates of incidence and mortality worldwide for 36 cancers in 185 countries. CA Cancer J Clin 2018;68(6):394-424.
[Crossref] [Google Scholar] [PubMed]
- Sung H, Ferlay J, Siegel RL, Laversanne M, Soerjomataram I, Jemal A, et al. Global cancer statistics 2020: GLOBOCAN estimates of incidence and mortality worldwide for 36 cancers in 185 countries. CA Cancer J Clin 2021;71(3):209-49.
[Crossref] [Google Scholar] [PubMed]
- Diao X, Guo C, Li S. Identification of a novel anoikis-related gene signature to predict prognosis and tumor microenvironment in lung adenocarcinoma. Thorac Cancer 2023;14(3):320-30.
[Crossref] [Google Scholar] [PubMed]
- Chen A, Zhao S, Zhou F, Lv H, Liang D, Jiang T, et al. Identification of potential immune-related prognostic biomarkers of lung cancer using gene co-expression network analysis. Oncol Transl Med 2020;6(6):247-57.
- Abdelfatah S, Berg A, Huang Q, Yang LJ, Hamdoun S, Klinger A, et al. MCC1019, a selective inhibitor of the Polo-box domain of Polo-like kinase 1 as novel, potent anticancer candidate. Acta Pharm Sin B 2019;9(5):1021-34.
[Crossref] [Google Scholar] [PubMed]
- Tang R, Xu J, Zhang B, Liu J, Liang C, Hua J, et al. Ferroptosis, necroptosis, and pyroptosis in anticancer immunity. J Hematol Oncol 2020;13:1-8.
[Crossref] [Google Scholar] [PubMed]
- Zhu F, Zhang W, Yang T, He SD. Complex roles of necroptosis in cancer. J Zhejiang Univ Sci B 2019;20(5):399-413.
[Crossref] [Google Scholar] [PubMed]
- Malla SR, Krueger B, Wartmann T, Sendler M, Mahajan UM, Weiss FU, et al. Early trypsin activation develops independently of autophagy in caerulein-induced pancreatitis in mice. Cell Mol Life Sci 2020;77:1811-25.
[Crossref] [Google Scholar] [PubMed]
- Gukovskaya AS, Gukovsky I, Algül H, Habtezion A. Autophagy, inflammation, and immune dysfunction in the pathogenesis of pancreatitis. Gastroenterology 2017;153(5):1212-26.
[Crossref] [Google Scholar] [PubMed]
- Lim JH, Oh S, Kim L, Suh YJ, Ha YJ, Kim JS, et al. Low-level expression of necroptosis factors indicates a poor prognosis of the squamous cell carcinoma subtype of non-small-cell lung cancer. Transl Lung Cancer Res 2021;10(3):1221.
[Crossref] [Google Scholar] [PubMed]
- Furukawa C, Daigo Y, Ishikawa N, Kato T, Ito T, Tsuchiya E, et al. Plakophilin3 oncogene as prognostic marker and therapeutic target for lung cancer. Cancer Res 2005;65(16):7102-10.
[Crossref] [Google Scholar] [PubMed]
- Schwarz J, Ayim A, Schmidt A, Jäger S, Koch S, Baumann R, et al. Differential expression of desmosomal plakophilins in various types of carcinomas: Correlation with cell type and differentiation. Human Pathol 2006;37(5):613-22.
[Crossref] [Google Scholar] [PubMed]
- Hofmann I, Casella M, Schnolzer M, Schlechter T, Spring H, Franke WW. Identification of the junctional plaque protein plakophilin3 in cytoplasmic particles containing RNA-binding proteins and the recruitment of plakophilins 1 and 3 to stress granules. Mol Biol Cell 2006;17(3):1388-98.
[Crossref] [Google Scholar] [PubMed]
- Love MI, Huber W, Anders S. Moderated estimation of fold change and dispersion for RNA-seq data with DESeq2. Genome Biol 2014;15:1-21.
[Crossref] [Google Scholar] [PubMed]
- Kok MG, Halliani A, Moerland PD, Meijers JC, Creemers EE, Pinto-Sietsma SJ. Normalization panels for the reliable quantification of circulating microRNAs by RT-qPCR. FASEB J 2015;29(9):3853-62.
[Crossref] [Google Scholar] [PubMed]
- Liang J, Li H, Han J, Jiang J, Wang J, Li Y, et al. Mex3a interacts with LAMA2 to promote lung adenocarcinoma metastasis via PI3K/AKT pathway. Cell Death Dis 2020;11(8):614.
[Crossref] [Google Scholar] [PubMed]
- Gautier L, Cope L, Bolstad BM, Irizarry RA. Affy-analysis of affymetrix GeneChip data at the probe level. Bioinformatics 2004;20(3):307-15.
[Crossref] [Google Scholar] [PubMed]
- Ritchie ME, Phipson B, Wu DI, Hu Y, Law CW, Shi W, et al. limma powers differential expression analyses for RNA-sequencing and microarray studies. Nucl Acids Res 2015;43(7):e47.
[Crossref] [Google Scholar] [PubMed]
- Kolde R. Pheatmap: Pretty heatmaps. R Package Version 2019;1(2):726.
- Ginestet C. ggplot2: Elegant graphics for data analysis. JR Stat 2011;174(1):245.
- Stelzer G, Rosen N, Plaschkes I, Zimmerman S, Twik M, Fishilevich S, et al. The GeneCards suite: From gene data mining to disease genome sequence analyses. Curr Protoc Bioinformatics 2016;54(1):1-30.
[Crossref] [Google Scholar] [PubMed]
- Szklarczyk D, Gable AL, Lyon D, Junge A, Wyder S, Huerta-Cepas J, et al. STRING v11: Protein-protein association networks with increased coverage, supporting functional discovery in genome-wide experimental datasets. Nucl Acids Res 2019;47(D1):D607-13.
[Crossref] [Google Scholar] [PubMed]
- Robin X, Turck N, Hainard A, Tiberti N, Lisacek F, Sanchez JC, et al. pROC: An open-source package for R and S+ to analyze and compare ROC curves. BMC Bioinformatics 2011;12:1-8.
[Crossref] [Google Scholar] [PubMed]
- Tang Z, Li C, Kang B, Gao G, Li C, Zhang Z. GEPIA: A web server for cancer and normal gene expression profiling and interactive analyses. Nucl Acids Res 2017;45(W1):W98-102.
[Crossref] [Google Scholar] [PubMed]
- Yu G, Wang LG, Han Y, He QY. clusterProfiler: An R package for comparing biological themes among gene clusters. OMICS 2012;16(5):284-7.
[Crossref] [Google Scholar] [PubMed]
- Luo W, Brouwer C. Pathview: An R/Bioconductor package for pathway-based data integration and visualization. Bioinformatics 2013;29(14):1830-1.
[Crossref] [Google Scholar] [PubMed]
- Yu G. Gene ontology semantic similarity analysis using GOSemSim. Methods Mol Protoc 2020:207-15.
[Crossref] [Google Scholar] [PubMed]
- Hänzelmann S, Castelo R, Guinney J. GSVA: Gene set variation analysis for microarray and RNA-seq data. BMC Bioinformatics 2013;14:1-5.
[Crossref] [Google Scholar] [PubMed]
- Dweep H, Gretz N. miRWalk2.0: A comprehensive atlas of microRNA-target interactions. Nat Methods 2015;12(8):697.
[Crossref] [Google Scholar] [PubMed]
- Han H, Cho JW, Lee S, Yun A, Kim H, Bae D, et al. TRRUST v2: An expanded reference database of human and mouse transcriptional regulatory interactions. Nucl Acids Res 2018;46(D1):D380-6.
[Crossref] [Google Scholar] [PubMed]
- Reinhold WC, Sunshine M, Liu H, Varma S, Kohn KW, Morris J, et al. CellMiner: A web-based suite of genomic and pharmacologic tools to explore transcript and drug patterns in the NCI-60 cell line set. Cancer Res 2012;72(14):3499-511.
[Crossref] [Google Scholar] [PubMed]
- Trevor H, Robert T, Balasubramanian N, Gilbert C. Impute: Imputation for microarray data. R package version 1.62.0; 2020.
- Therneau T. A package for survival analysis in R. R package version 3.2-7.
- Blanche P, Dartigues JF, Jacqmin-Gadda H. Estimating and comparing time-dependent areas under receiver operating characteristic curves for censored event times with competing risks. Stat Med 2013;32(30):5381-97.
[Crossref] [Google Scholar] [PubMed]
- Frank E Harrell Jr. RMS: Regression modeling strategies. R package version 6; 2021.
- Xia C, Dong X, Li H, Cao M, Sun D, He S, et al. Cancer statistics in China and United States, 2022: Profiles, trends and determinants. Chin Med J 2022;135(5):584-90.
[Crossref] [Google Scholar] [PubMed]
- Grivennikov SI, Greten FR, Karin M. Immunity, inflammation and cancer. Cell 2010;140(6):883-99.
[Crossref] [Google Scholar] [PubMed]
