- *Corresponding Author:
- R A Zerubabel Michael
Department of Chemical Engineering,
Centre for Biotechnology,
Andhra University College of Engineering,
Andhra University,
Visakhapatnam,
Andhra Pradesh 530003,
India
E-mail: michaelzerubabel@yahoo.com
| Date of Received | 10 November 2020 |
| Date of Revision | 11 August 2021 |
| Date of Acceptance | 04 April 2022 |
| Indian J Pharm Sci 2022;84(2):423-435 |
This is an open access article distributed under the terms of the Creative Commons Attribution-NonCommercial-ShareAlike 3.0 License, which allows others to remix, tweak, and build upon the work non-commercially, as long as the author is credited and the new creations are licensed under the identical terms
Abstract
The present study deals with phytochemical, pharmacological (In vitro antioxidant), purification and characterization studies of aerial parts of Avicennia alba. The phytochemical analysis for qualitative and quantitative investigation revealed the presence of more bioactive compounds in methanolic extract than hexane and chloroform extracts of Avicennia alba. The methanolic extract showed better activity on 2,2-diphenyl-1-picrylhydrazyl free radical than remaining free radical tests i.e hydrogen peroxide and hydroxyl radical. The methanolic extract was potent in inhibiting the free radicals upon comparison with standard ascorbic acid. The tuberculosis effect of the plant was not up to the mark when compared with standard control. The methanolic plant extract was subjected to column chromatography and three compounds were isolated. The isolated compounds were characterized by ultraviolet, fourier transform infrared spectroscopy, proton nuclear magnetic resonance, carbon nuclear magnetic resonance and mass spectral data studies and were identified as stigmasterol, beta-sitosterol and lupeol. The work carried out was distinctive as the source of plant was taken from coringa mangrove, Kakinada, first of its kind and the tuberculosis effect was also reported for the first time, though it was not up to the mark the work reported inspires the researcher to enlighten and save their time. The natural compounds selected were reported previously but an in depth characterization was reported for a thorough look.
Keywords
Avicennia alba, phytochemical, in vitro antioxidant, purification, characterization
Nature is the best combinatorial chemist and possibly has answers to all diseases of mankind. Natural products, including plants, animals and minerals have been the basis of treatment of human diseases [1]. Till now, natural product compounds discovered from medicinal plants (and their analogues thereof) have provided numerous clinically useful drugs. World Health Organization also has recognized the importance of traditional medicine and has been active in creating strategies, guidelines and standards for botanical medicine [2]. The plant kingdom represents a treasure trove of structurally diverse bioactive molecules. It is estimated that around 250 000 flowering plant species are reported to occur globally. Approximately half (125 000) of these are found in the tropical forests. Approximately one- fourth of the world’s tropical coastline is dominated by mangroves and they extend over 15.5 million hectares world-wide. The use of the mangrove ecosystem are in the form of vital ecological functions such as control of coastal erosion, protection of coastal land, stabilization of sediment and natural purification of coastal water from pollution. The mangroves exist under stressful conditions such as extreme environments, high concentration of moisture, high and low tides of water and abundant living microorganisms and insects. They thrive in a very peculiar environment and serve as a bridging ecosystem between freshwater and marine systems. These have imposed several modifications in these plants. They possess modifications to establish water and salt economy. There are modifications or alterations in other physiological processes such as carbohydrate metabolism or polyphenol synthesis and due to these reasons; they possess chemical compounds which protect them from these destructive elements.
The genus Avicennia (L.) is named after Avicennia or Abdallah Ibn Sina (980-1037 AD), a Persian physician [3]. The genus Avicennia belongs to the family Acanthaceae. The genus Avicennia is a pioneer group of dominant mangrove species having eight species including their varieties and synonyms with potential medicinal values [4]. They occur in tidal and intertidal zones of estuaries and seabed’s found in tropical and temperate regions spanning throughout the world [5]. Avicennia alba (A. alba) is found in south and south east Asia, the islands of the south Pacific Ocean and Australia. It is a native of India and is distributed in coastal regions of south Indian mangrove forests. It grows on tidal regions of riverbanks and on muddy portions of the seashore. It is a pioneering species being one of the first to colonize new ground [6]. Its widespread root system with large numbers of pneumatophores helps to stabilize new deposits of sediment and are highly tolerant to saline environment [7].
The mangroves exist under stressful conditions such as extreme environments, high concentration of moisture, high and low tides of water and abundant living microorganisms and insects. They thrive in a very peculiar environment and serve as a bridging ecosystem between freshwater and marine systems. These have imposed several modifications in these plants. They possess modifications to establish water and salt economy. There are modifications or alterations in other physiological processes such as carbohydrate metabolism or polyphenol synthesis and due to these reasons; t7hey possess chemical compounds which protect them from these destructive elements.
The present study deals with phytochemical screening that is qualitative and quantitative analysis on aerial parts of hexane chloroform and methanolic extracts of A. alba, In vitro antioxidant activity, anti-tuberculosis activity and purification and characterization analysis of A. alba methanolic extract using Liquid Chromatography-Mass Spectrometry (LC-MS), Fourier Transform Infrared Spectroscopy (FT-IR), Nuclear Magnetic Resonance (NMR) Spectroscopy.
Materials and Methods
Collection of plant materials and Solvent extraction:
The aerial parts of A. alba were collected from Corangi mangrove forests, Kakinada, Andhra Pradesh, India. The plant material (species) was taxonomically identified and authenticated by Prof. G.Mohana Narasimharao, Department of Botany, College of Science and Technology, Andhra University, Visakhapatnam and the herbarium voucher specimen has been kept in Department of Botany, Andhra University for future reference. The aerial parts of plant (stem and leaves) were powdered mechanically and the material was separately extracted with different solvents like hexane, chloroform and methanol successively by maceration. After completion of extraction, the sample was filtered by a filter paper and the solvent was evaporated using a rotary evaporator under pressure resulting in a semi solid crude extract. All the crude extracts were preserved in desiccators for further studies.
Qualitative and quantitative phytochemical analysis [8-14]:
A spectrum of natural compounds like terpenoids, flavonoids, glycosides, alkaloids, tannins, essential oils and other similar secondary metabolites which exert physiological activities are synthesized in the plants. Different qualitative chemical tests and quantification of total phenolic and alkaloidal contents were performed for establishing the profile of a given fraction for its nature of chemical composition.
Quantification of total phenolic content: Total phenolic content was determined using the Folin- Ciocalteau reagent. Folin-Ciocalteau colorimetry is based on a chemical reduction of the reagent, a mixture of tungsten and molybdenum oxides. The products of the metal oxide reduction have a blue absorption with a maximum at 765 nm. The intensity of the light absorption at that wave length is proportional to the concentration of phenols. By using standard Gallic acid calibration curve, measure the concentration of phenolic content in Gallic Acid Equivalents (GAE) using unit’s mg/gm.
Quantification of total alkaloid content: The plant fraction (1 mg/ml) was dissolved in 2 N Hydrochloric Acid (HCl) and then filtered. The pH of phosphate buffer solution was adjusted to neutral with 0.1 N Sodium Hydroxide (NaOH). 1 ml of this solution was transferred to a separating funnel and then 5 ml of Bacillus Calmette Guerin (BCG) solution along with 5 ml of phosphate buffer were added. The mixture was shaken and the complex formed was fractioned with chloroform by vigorous shaking. The fractions were collected in a 10 ml volumetric flask and diluted to volume with chloroform. The absorbance of the complex in chloroform was measured at 470 nm. All experiments were performed thrice; the results were averaged and reported in the form of mean±standard deviation.
In-Vitro antioxidant activity:
The crude plant extract was evaluated for antioxidant activity by hydrogen peroxide, hydroxyl radical and 2,2-diphenyl-1-picrylhydrazyl (DPPH) radical’s inhibition.
Determination of hydroxyl radical scavenging activity [15]: Hydroxyl radical scavenging activity was measured by studying the competition between deoxyribose and the extract for hydroxy radicals generated from the Ferrous Ion/Ethylenediamine Tetraacetic Acid/Hydrogen Peroxide (Fe+2/EDTA/H2O2) system (Fenton reaction). Fenton reaction mixture consisting of 200 μl of 10 mM Ferrous Sulphate (FeSO4.7H2O), 200 μl of 10 mM EDTA and 200 μl of 10 mM 2-deoxyribose; and was mixed with 1.2 ml of 0.1 m phosphate buffer (pH 7.4) and 200 μl of plant extract. Thereafter, 200 μl of 10 mM H2O2 was added before incubation at 37° for 4 h. Then 1 ml of this Fenton reaction mixture treated with 0.2 ml of 8.1 % sodium do-decyl sulphate, 1.5 ml of 0.8 % thiobarbituric acid, 1.5 ml of 20 % acetic acid. The total volume was made to 5 ml by adding distilled water kept in water bath at 100° for 1 h. After that mixture has been cooled, 5 ml of 15:1 v/v butanol-pyridine mixture were added. Following vigorous shaking the tubes were centrifuged at 4000 rpm for 10 min and the absorbance of organic layer containing thiobarbituric acid reactive substances was measured at 532 nm. A control was prepared using 0.1 ml of vehicle in the place of plant extract/ascorbic acid.
H2O2 radical scavenging activity [16]: The ability of plant extract to scavenge H2O2 was determined according to the method of Gulcin. A solution of H2O2 (40 mm) was prepared in phosphate buffer (pH 7.4) and concentration was determined spectrophotometrically at 230 nm (Schimadzu Ultraviolet (UV)-Vis 1700). Plant extract (20-150 μg/ml) in distilled water was added to a H2O2 solution (0.6 ml, 43 mM) and the absorbance of hydrogen peroxide at 230 nm was determined after 10 min against a blank solution in phosphate buffer without hydrogen peroxide.
DPPH radical scavenging activity [17]: The scavenging activity for DPPH free radicals was measured according to the procedure described by BloisMS.1958. An aliquot of 3 ml of 0.004 % DPPH solution in ethanol and 0.1 ml of plant extract at various concentrations were mixed. The mixture was shaken vigorously and allowed to reach a steady state at room temperature for 30 min. Decolorization of DPPH was determined by measuring the absorbance at 517 nm. A control was prepared using 0.1 ml of respective vehicle in the place of plant extract/ ascorbic acid.
The percentage inhibition by the extract was calculated by using the formula:
Percentage inhibition=Average control Optical Density (OD)-Test sample OD/Average control×100
Calculation of 50 % inhibition concentration: The OD obtained with each concentration of the extracts and the ascorbic acid was plotted on a graph taking concentrations on X-axis and percentage inhibition on Y-axis. The graph was extrapolated to find the 50 % inhibition concentration of test sample and ascorbic acid.
Anti-Tuberculousis (TB) activity using Alamar Blue Dye [18]:
The anti-mycobacterial activity of compounds was assessed against Mycobacterium tuberculosis (M. tuberculosis) using Microplate Alamar Blue Assay (MABA). This methodology is non-toxic, uses a thermally stable reagent and shows good correlation with propotional and BACTEC radiometric method. Briefly, 200 µl of sterile deionzed water was added to all outer perimeter wells of sterile 96 wells plate to minimized evaporation of medium in the test wells during incubation.
The 96 wells plate received 100 µl of the Middlebrook 7H9 broth and serial dilution of compounds were made directly on plate. The final drug concentrations tested were 100 to 0.2 µg/ml. Plates were covered and sealed with parafilm and incubated at 37° for 5 d. After this time, 25 µl of freshly prepared 1:1 mixture of Almar Blue reagent and 10 % tween 80 was added to the plate and incubated for 24 h. A blue color in the well was interpreted as no bacterial growth and pink color was scored as growth. The Minimum Inhibitory Concentration (MIC) was defined as lowest drug concentration which prevented the color change from blue to pink.
Purification and characterization by various methods employed:
A cylinder shaped glass column containing stationary phase (silica gel 60-120 mesh) was encountered slowly from the top with a liquid solvent that flows down the column with the help gravity. This technique is used for the purification of compounds from the mixture (10 g A. alba plant extract). Once the column is ready, the sample was loaded inside the top of the column. The mobile solvent (hexane, ethyl acetate and methanol ratios) was then allowed to flow down through the column.
The compounds in mixture have different interactions ability with stationary phase (silica gel) and mobile phase, thereby will flow along the mobile phase at different time intervals based on the polarity of the mobile phase. In this way, the separation of compounds from the mixture was achieved. The individual compounds were collected as fractions. Each fraction was collected separately in a test tube and numbered consecutively for further analysis on thin layer chromatography. Thin Layer Chromatography (TLC) provides partial separation of both organic and inorganic materials using thin-layered chromatographic plates especially useful for checking the purity of fractions.
Each fraction was applied on activated TLC plates with the help of capillary tube at a 1/2 inch apart from the lower edge of TLC plate and plate is kept in a developing chamber containing suitable solvent system for specific time until the developing solvent reaches top of the upper edge of TLC plate. Plate was taken out from developing chamber, dried and solvent front was marked by lead pencil. Compound bands/spots visualized on TLC chromatoplate can be detected by visual detection, under UV light (254 nm), in iodine chamber and by using spray reagent (vanillin-sulfuric acid) for the presence of specific compounds.
Based on the nature of the compounds pure crystals obtained were characterized using different spectroscopic techniques like Infrared (IR), NMR and Mass Spectral Analysis (MS) for identification and determination of physical properties. The previous literature review was also studied and compared with the results obtained.
Results and Discussion
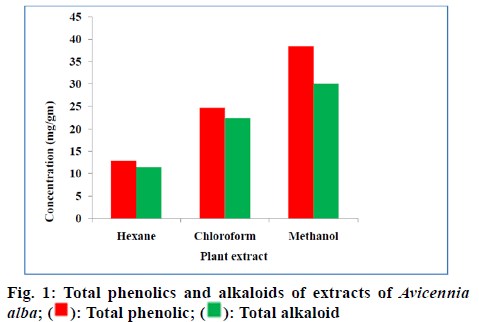
The qualitative chemical testing indicated that the hexane, chloroform and methanolic extracts of A. alba stem and leaves were found to possess different phytochemical constituents like terpenoids, flavonoids, glycosides, carbohydrates, alkaloids and tannins. All the plant extracts (hexane, chloroform and methanol) gave negative report for amino acids. Hexane and chloroform extracts support only 7 of 11 phytochemicals tested which include phytosterols, terpenoids, glycosides, flavonoids, carbohydrates, alkaloids and phenols(fig 1).
The methanolic extract showed the presence of all the phytochemicals (phytosterols, terpenoids, glycosides, saponins, flavonoids, tannins, carbohydrates, alkaloids, essential oils and phenols) except amino acids on comparison with hexane and chloroform extract (Table 1).
| Phytochemical Constituents | Avicennia alba | ||
|---|---|---|---|
| Hexane extract | Chloroform extract | Methanolic extract | |
| Phytosterols | + | + | + |
| Terpenoids | + | + | + |
| Glycosides | + | + | + |
| Saponins | - | - | + |
| Flavonoids | + | + | + |
| Tannins | - | - | + |
| Carbohydrates | + | + | + |
| Alkaloids | + | + | + |
| Amino acids | - | - | - |
| Esential oils | - | - | + |
| Phenols | + | + | + |
Table 1: Determination of Qualitative Phytochemical Tests for Avicennia Alba Plantextracts
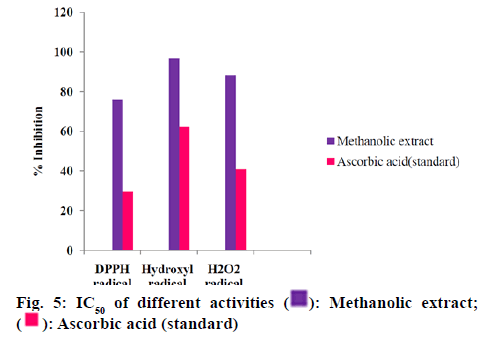
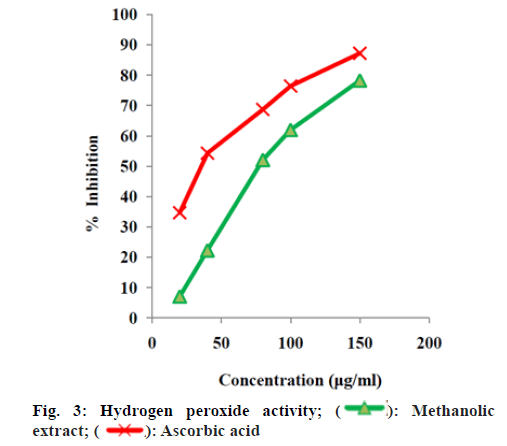
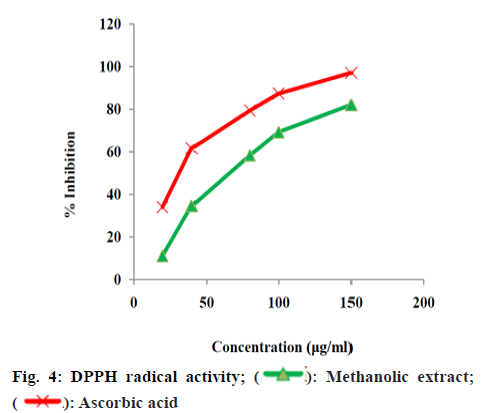
The quantified phenolic content of A. alba extracts depicted that the methanolic extract have more phenolic content than other extracts. The total alkaloid content depicted that the methanolic extract has more alkaloid content than other extracts. Upon these results methanolic extract was selected for further studies. The methanolic leaf and stem extract of A. alba showed dose dependent hydroxyl radical, hydrogen peroxide and DPPH radical-scavenging activities from fig. 2-fig. 5. The standard drug ascorbic acid also showed similar dose-dependent activity and produced maximum scavenging activity at a dose of 150 μg/ml. The results of percentage protection of the methanolic extract were well comparable with the standard drug and methanolic extract also showed the significant antioxidant activity on different free radicals. The IC50 values for hydroxyl radical, Hydrogen peroxide and DPPH radical scavenging activity of test extract depicts standard Ascorbic acid has higher strength than methanolic extract.
Upon considering the below data (fig. 2-fig. 5) methanolic extract of A. alba has high antioxidant activity due to the presence of various qualitative and quantitative phytochemicals. The results of percentage protection of the methanolic extract were well comparable with the standard drug and methanolic extract also showed the significant antioxidant activity on different free radicals. Upon considering the above data methanolic extract of A. alba has high antioxidant activity due to the presence of various qualitative and quantitative phytochemicals.
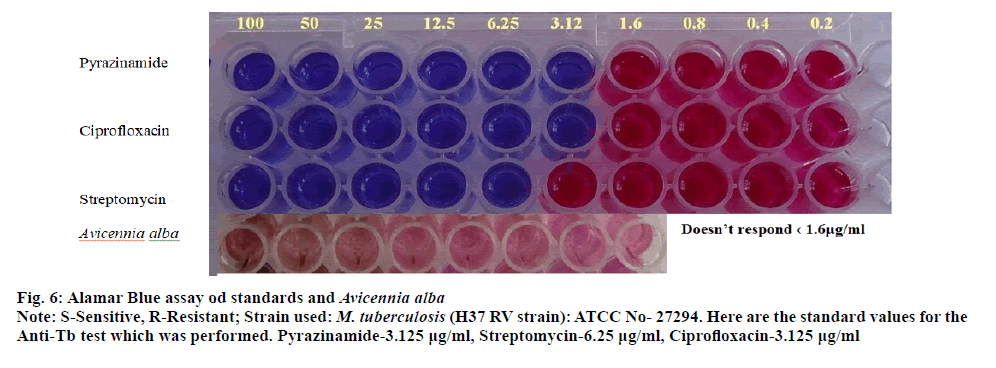
Figure 6: Alamar Blue assay od standards and Avicennia alba
Note: S-Sensitive, R-Resistant; Strain used: M. tuberculosis (H37 RV strain): ATCC No- 27294. Here are the standard values for the Anti-Tb test which was performed. Pyrazinamide-3.125 μg/ml, Streptomycin-6.25 μg/ml, Ciprofloxacin-3.125 μg/ml
The qualitative data based on calibrating blue colour was determined by Alamar Blue assay. Here the strain used was M. tuberculosis (H37 RV strain): ATCC No- 27294. The result depicts that A. alba doesn’t showed significant effect of anti-tuberculosis activity based on color sensitivity/resistant modes when compared to standard. In the current study methanolic plant extract was subjected to column chromatography and TLC and purified three pure compounds which were further characterized using FTIR, Proton NMR (H-NMR) , Carbon NMR (C-NMR) and mass spectral techniques.
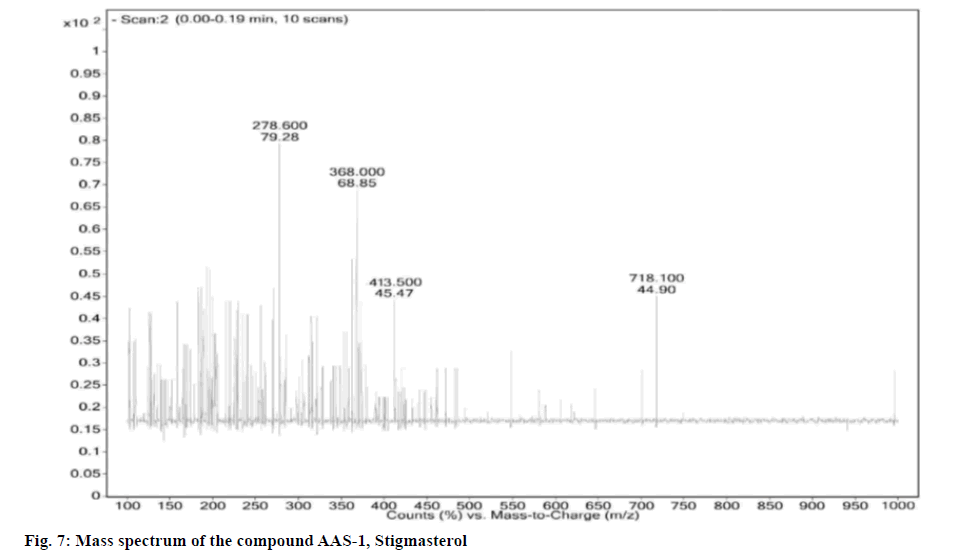
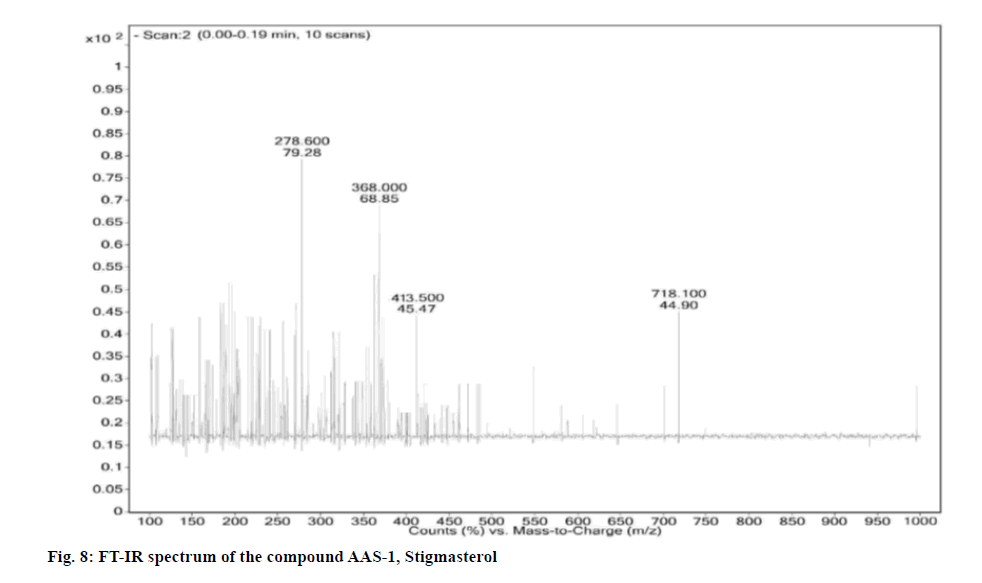
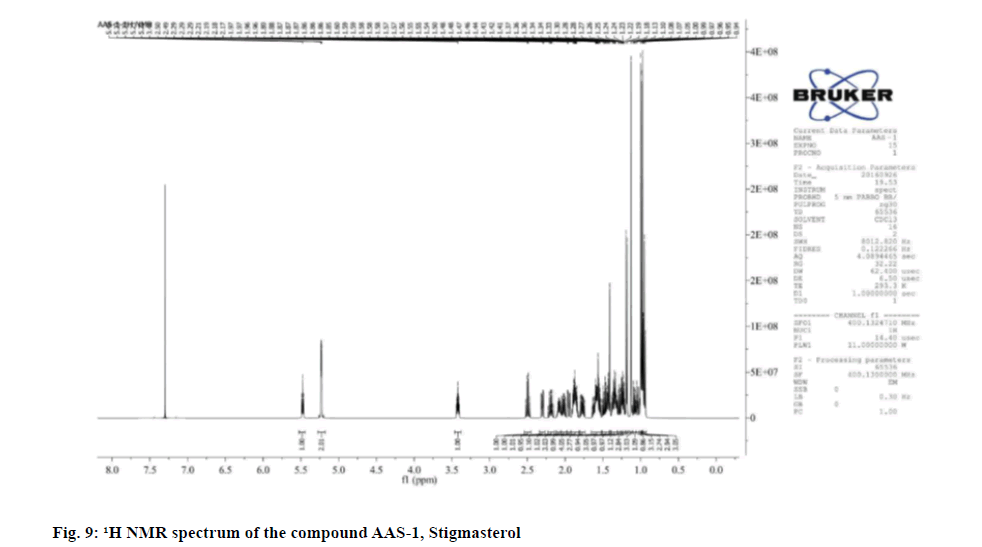
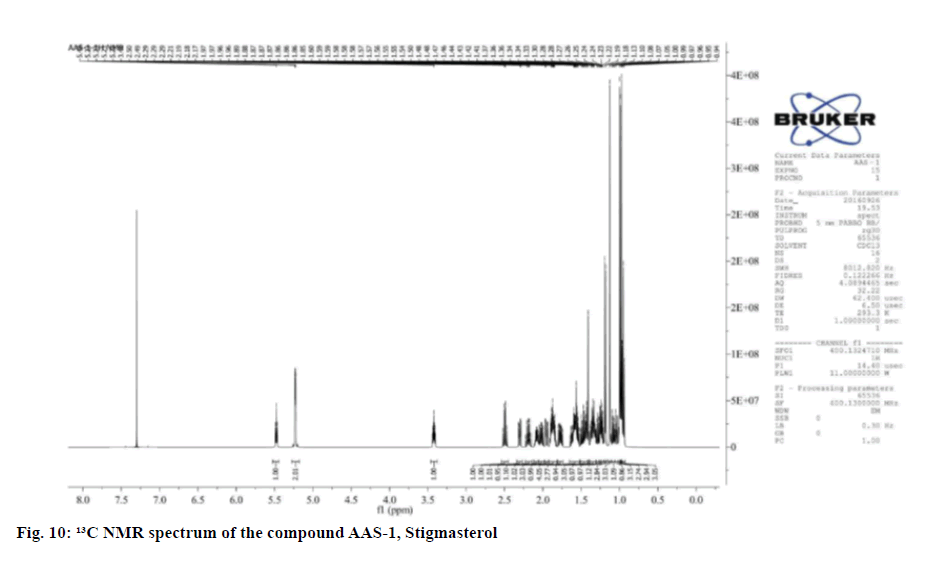
Upon investigation the three compounds separated were identified as Stigmasterol (AAS-1), Beta (β)- Sitosterol (AAS-2) and Lupeol (AAS-3), which belong to phytosterol and terpenoid class of plant secondary metabolites [19-22]. AAS-1 was obtained in hexane:ethyl acetate (95:05) fraction as colorless crystalline solid and based on the m/z peak at 413.50 (negative mode of Electrospray Ionization-Mass Spectrometry (ESI- MS)) and elemental analysis the molecular formula was confirmed as Stigmasterol (C29H48O). Upon considering the details from the fig. 7-fig. 10, the IR spectrum showed absorption bands at 1383.81, 1412.66, 1458.96, 2862.10, 2944.01, 3435.45 cm-1 indicating its steroidal moiety.
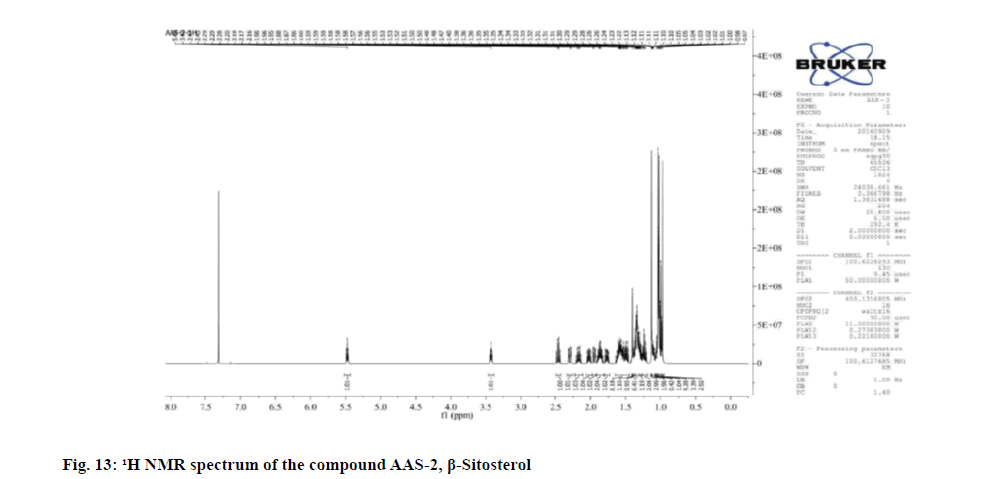
The 1H NMR revealed six methyl groups at Delta (δ) 0.94-0.96 (3H, t, CH3-23), 0.97 (3H, s), 0.99 (3H, s),1.00 (3H, s), 1.13 (3H, s) and 1.18-1.19 (3H, d, J=4 Hz) and one hydroxyl group at δ 3.40-3.44 (1H, m). The olefinic protons appeared as characteristic downfield signals at δ 5.22-5.23 and 5.46-5.49 as multiplets in the 1H NMR spectrum. The 13C NMR spectrum showed 29 carbons, among which six are methyl (CH3), 9 methylene (CH2), 11 methylidyne (CH) and three quaternary carbons. On the basis of literature and NMR assignment of the compound AAS-1 revealed the compound was stigmasterol with molecular formula confirmed as C28H48O (Table 2).
| Carbon Number | 1H NMR (CDCl3, 400 MHz) δ ppm | 13C NMR (CDCl3, 400 MHz) δ ppm |
|---|---|---|
| 1 | 1.42-1.51 (1H, m, CH-1a) | 37.27 |
| 1.21-1.26 (1H, m, CH-1b) | ||
| 2 | 1.84-1.90 (1H, m, CH-15a) | 32.97 |
| 1.32-1.38 (1H, m, CH-2b) | ||
| 3 | 1.41 (1H, m, CH-3) | 72.16 |
| 3.40-3.44 (1H, m, OH-3) | ||
| 4 | 1.94-1.97 (1H, m, CH-4a) | 43.54 |
| 2.28-2.32 (1H, m, CH-4b) | ||
| 5 | --- | 140.58 |
| 6 | 5.46-5.49 (1H, t, J= 4, 8 Hz, =CH-6) | 121.66 |
| 7 | 1.74-1.80 (1H, m, CH-7a) | 31.88 |
| 1.99-2.05 (1H, m, CH-7b) | ||
| 8 | 2.15-2.22 (1H, m, CH-8) | 33.94 |
| 9 | 2.47-2.52 (1H, m, CH-9) | 50.51 |
| 10 | --- | 39.86 |
| 11 | 1.53-1.64 (1H, m, CH-11a) | 22.38 |
| 1.32-1.38 (1H, m, CH-11b) | ||
| 12 | 1.07-1.10 (1H, m, CH-12a) | 39.11 |
| 1.53-1.64 (1H, m, CH-12b) | ||
| 13 | --- | 43.63 |
| 14 | 1.05-1.06 (1H, dd, J= 4 Hz, CH-14) | 58.13 |
| 15 | 1.84-1.90 (1H, m, CH-15a) | 24.86 |
| 1.53-1.64 (1H, m, CH-15b) | ||
| 16 | 1.32-1.38 (1H, m, CH-16a) | 29.04 |
| 1.53-1.64 (1H, m, CH-16b) | ||
| 17 | 1.24-1.26 (1H, m, CH-17) | 55.88 |
| 18 | 2.06-2.10 (1H, m, CH-18) | 39.86 |
| 19 | 5.22-5.23 (1H, m, =CH-19) | 137.38 |
| 20 | 5.22-5.23 (1H, m, =CH-20) | 130.38 |
| 21 | 1.84-1.90 (1H, m, CH-21) | 51.89 |
| 22 | 1.27-1.31 (1H, m, CH-22a) | 23.15 |
| 1.42-1.51 (1H, m, CH-22b) | ||
| 23 | 0.94-0.96 (3H, t, CH3-23) | 11.58 |
| 24 | 1.13 (3H, s, CH3-24) | 20.81 |
| 25 | 0.97 (3H, s, CH3-25) | 13.94 |
| 26 | 1.18-1.19 (3H, d, J= 4 Hz, CH3-26) | 19.9 |
| 27 | 1.42-1.51 (1H, m, CH-27) | 31.8 |
| 28 | 0.99 (3H, s, CH3-28) | 19.83 |
| 29 | 1.00 (3H, s, CH3-29) | 19.83 |
Table 2: 1H (400 MHZ) AND 13C (400 MHZ) NMR SPECTRAL DATA OF COMPOUND STIGMASTEROL IN CDCL3
Physical and spectral characteristics of isolated compound AAS-1 Stigmasterol is as follows. Compound AAS-1: Stigmasterol; Molecular formula: C29H48O; Elemental Analysis: Found C-84.76, H-11.82 (%), calcd. C, 84.40, H, 11.72 (%); Retention Factor (Rf): 0.567 (hexane:Ethyl acetate-19:1); Yield: 10 mg; melting point: 140°-141°; UV (Methanol): λmax 257; FT-IR (KBr): 592.12, 693.30, 838.62, 905.18, 958.45, 1014.51, 1080.60, 1158.20, 1185.85, 1218.63, 1251.13, 1285.59, 1383.81, 1412.66, 1458.96, 1519.55, 1554.17, 1636.71, 1704.31, 2312.74, 2378.95, 2862.10, 2944.01, 3081.48, 3435.45, 3745.87, 3859.41 cm-1; Mass (m/z): ESI-MS: 413.50 (negative mode).
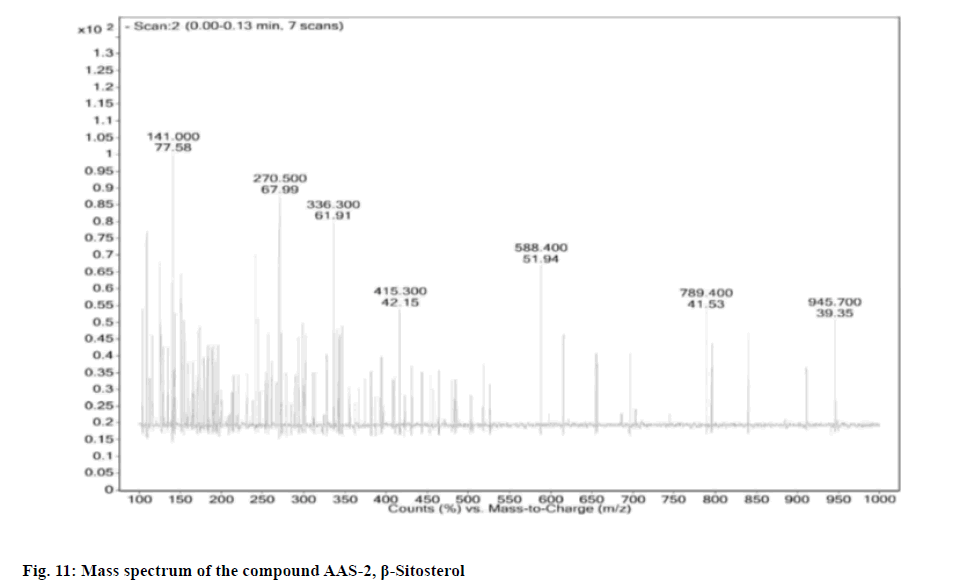
Compound AAS-2 on crystallization gave colorless to white needles. The compound was freely soluble in hexane chloroform and sparingly soluble in alcohol. The compound gave positive color reaction with Liebermann Buchard reaction and Salkowski reaction test for steroids. The compound showed melting point at 136°-137°, with Rf value: 0.50 (n-hexane:ethyl acetate-9:1). Based on the m/z peak at 415.30 (negative mode of ESI-MS) and elemental analysis the molecular formula was confirmed as C28H48O.
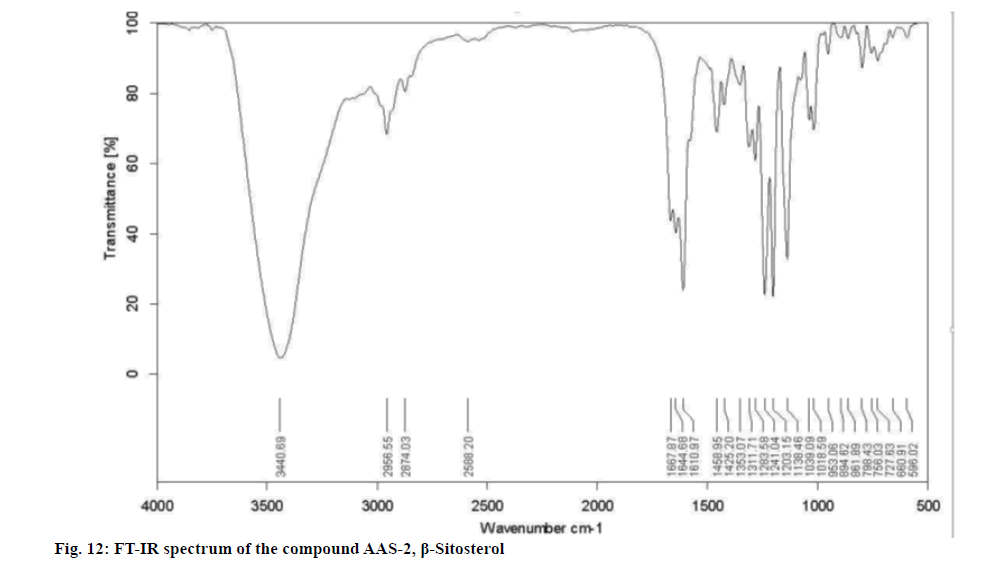
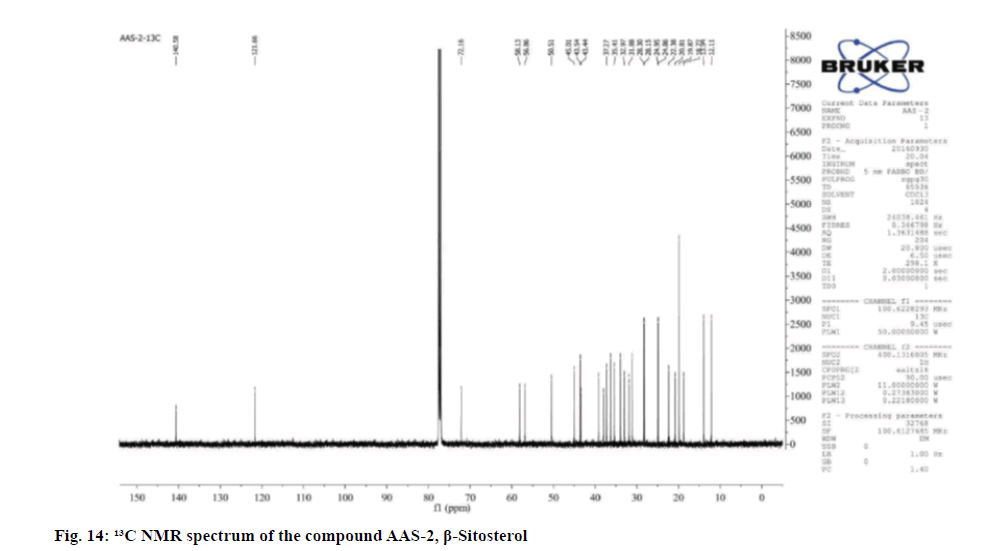
Upon considering the details from the fig. 11-fig. 14 the IR spectrum showed prominent bands at 596.02, 660.91, 727.63, 756.03, 798.43, 861.89, 894.62, 953.06, 1018.59, 1039.09, 1138.46, 1203.15, 1241.04, 1283.58, 1311.71, 1353.07, 1425.20, 1458.95, 1610.97, 1644.68, 1667.87, 2588.20, 2874.03, 2956.55 and 3440.69 cm-1.
The compound gave good color reaction to sulphuric acid test. The 1H NMR spectrum showed the presence of six methyl groups at δ 0.98-1.01 (3H, t, J=4, 8 Hz), 0.97 (3H, s), 1.02-1.04 (9H, dd, J=2, 4 Hz) and 1.13 (3H, s). The proton attached to C-3 carbon bearing the hydroxyl group appeared δ 3.40-3.44 as a multiplet.
The proton attached to the olefinic carbon appeared to δ 5.46-5.49 as a mutiplet. The 13C NMR spectra showed the presence of 6 methyl, 11 methylene, 9 methine and 3 tertiary carbons. Comparison of 1 H and 13C NMR data with literature reports the compound was identified as β- Sitosterol.
Physical and spectral characteristic of isolated compound AAS-2 is has follows. Compound AAS-2: β-Sitosterol; Molecular formula: C29H50O; Elemental Analysis: Found. C-83.63, H-12.48 (%), calcd. C, 83.99, H, 12.15 (%); Rf : 0.5 (Hexane: Ethyl acetate, 9:1); Yield: 10 mg; m.p: 136°-137°; UV (Methanol) : λmax 206; 1H and 13C NMR: FT-IR (KBr): 596.02, 660.91, 727.63, 756.03, 798.43, 861.89, 894.62, 953.06, 1018.59, 1039.09, 1138.46, 1203.15, 1241.04, 1283.58, 1311.71, 1353.07, 1425.20, 1458.95, 1610.97, 1644.68, 1667.87, 2588.20, 2874.03, 2956.55, 3440.69 cm-1; Mass (m/z): ESI-MS: 415.30 (negative mode) (Table 3).
| Carbon Number | 1H NMR (CDCl3, 400 MHz) δ ppm | 13C NMR (CDCl3, 400 MHz) δ ppm |
|---|---|---|
| 1 | 1.46-1.64 (1H, m, CH-1a) 1.21-1.26 (1H, m, CH-1b) |
37.27 |
| 2 | 1.84-1.89 (1H, m, CH-2a) 1.31-1.36 (1H, m, CH-2b) |
32.97 |
| 3 | 1.40 (1H, s, CH-3) 3.40-3.44 (1H, s, OH-3) |
72.16 |
| 4 | 1.94-1.96 (1H, m, CH-4a) 2.28-2.31 (1H, dd, J=4 Hz, CH-4b) |
43.54 |
| 5 | --- | 140.58 |
| 6 | 5.46-5.49 (1H, t, J=4, 8 Hz, CH3-6) | 121.66 |
| 7 | 1.74-1.80 (1H, m, CH-7a) 1.99-2.05 (1H, m, CH-7b) |
31.88 |
| 8 | 1.74-1.80 (1H, m, CH-8) | 33.95 |
| 9 | 2.43-2.47 (1H, m, CH-9) | 50.51 |
| 10 | --- | 37.28 |
| 11 | 1.46-1.64 (1H, m, CH-11a) 1.31-1.36 (1H, m, CH-11b) |
22.38 |
| 12 | 1.06-1.07 (1H, d, J=4 Hz, CH-12a) 1.46-1.64 (1H, m, CH-12b) |
39.11 |
| 13 | --- | 43.44 |
| 14 | 1.05 (1H, d, J=1.8 Hz, CH-14) | 58.13 |
| 15 | 1.84-1.89 (1H, m, CH-15a) 1.46-1.64 (1H, m, CH-15b) |
24.86 |
| 16 | 1.46-1.64 (1H, m, CH-16a) 1.31-1.36 (1H, m, CH-16b) |
28.15 |
| 17 | 1.08-1.12 (1H, m, CH-17) | 56.86 |
| 18 | 1.38-1.39 (1H, m, CH-18) | 36.29 |
| 19 | 1.31-1.36 (1H, m, CH-19a) 1.27-1.31 (1H, m, CH-19b) |
35.41 |
| 20 | 1.31-1.36 (1H, m, CH-20a) 1.31-1.36 (1H, m, CH-20b) |
28.30 |
| 21 | 1.08-1.12 (1H, m, CH-21) | 45.01 |
| 22 | 1.21-1.26 (1H, m, CH-22a) 1.31-1.36 (1H, m, CH-22b) |
24.95 |
| 23 | 0.98-1.01 (3H, t, J=4, 8 Hz, CH3-23) | 12.11 |
| 24 | 1.13 (3H, s, CH3-24) | 20.81 |
| 25 | 0.97 (3H, s, CH3-25) | 13.94 |
| 26 | 1.02-1.04 (3H, dd, J=2, 4 Hz, CH3-29) | 18.77 |
| 27 | 1.46-1.64 (1H, m, CH-27) | 31.13 |
| 28 | 1.02-1.04 (3H, dd, J=2, 4 Hz, CH3-28) | 19.87 |
| 29 | 1.02-1.04 (3H, dd, J=2, 4 Hz, CH3-29) | 19.87 |
Table 3: 1H (400 Mhz) and 13C (400 Mhz) NMR Spectral Data of Compound Β-Sitosterol In CDCL3
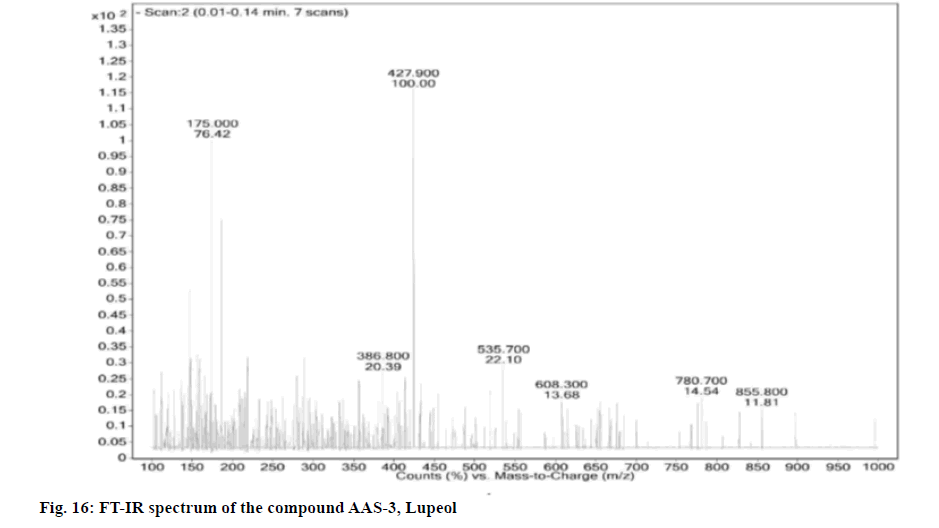
Compound was obtained as white powder with melting point 210°. Based on the m/z peak at 427.90 (negative mode of ESI-MS) and elemental analysis the molecular formula was confirmed as C30H50O.
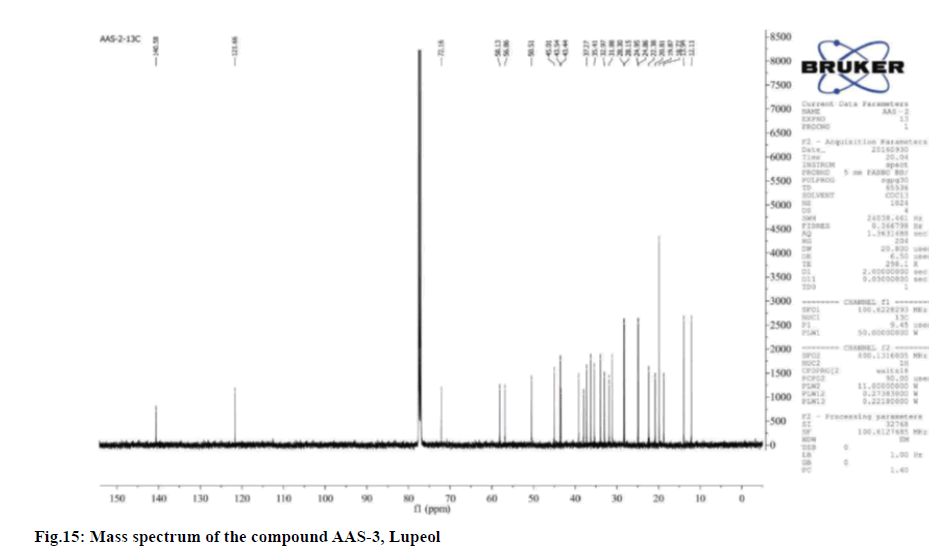
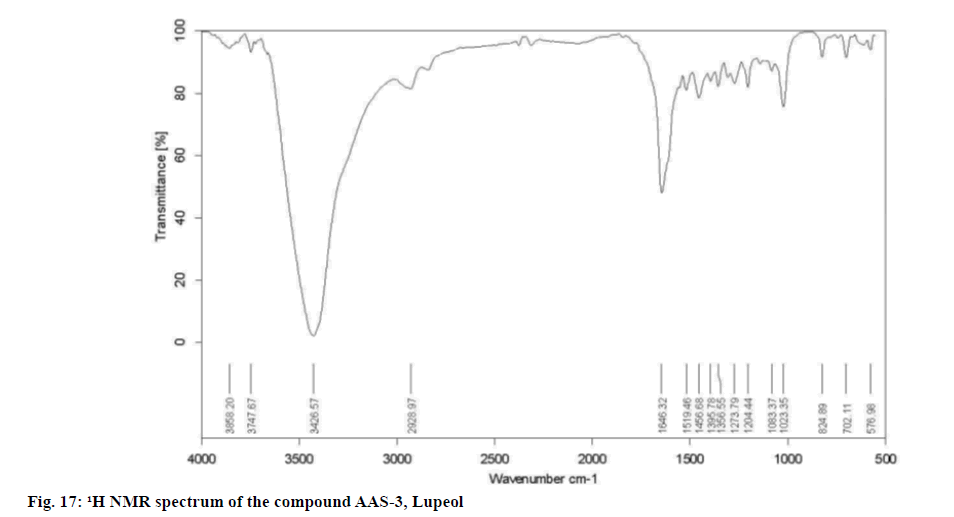
Upon considering the details from the fig. 15-fig. 18 the IR spectrum has shown a broad band at 1083.37,
1204.44, 1273.79, 1356.55, 1395.78, 1456.68, 1519.46,
1646.32, 2928.97, 3426.57, 3747.67 and 3858.20 cm-1 indicating the presence of a 1-hydroxyl and 1-double
bond in the molecule. The
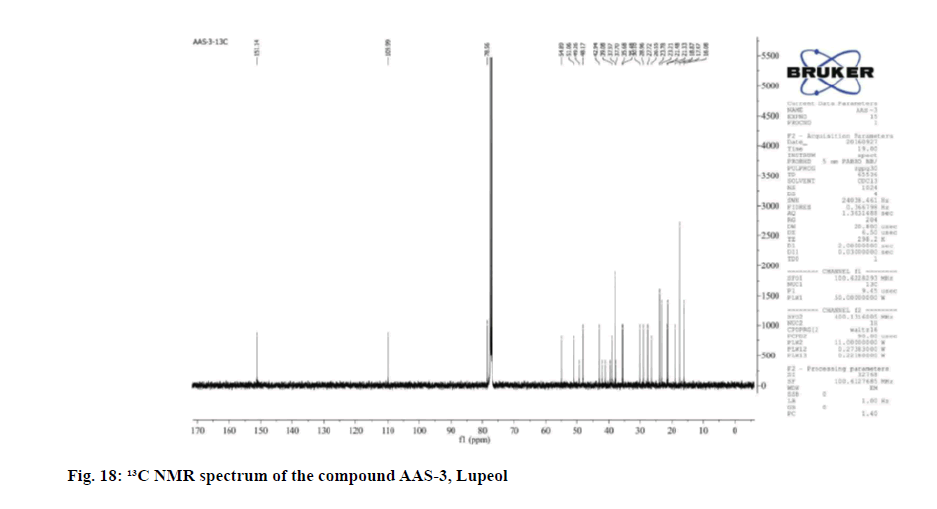
The 13C NMR data revealed 30 carbon signals where seven methyls, ten methylene, six methine carbons, five quaternary carbons and two olefinic carbons. The ¹³C NMR data was also in complete agreement with the existence of an isopropenyl group. This supported the olefinic methylene protons seen as singlets at δ 4.54 and 4.79 in the 1H NMR spectrum was found to be consistent with known compound Lupeol.
Physical and spectral characteristics of isolated compound AAS-3 Lupeol is has follows. Compound AAS-3: Lupeol; Molecular formula: C30H50O;
Elemental Analysis: Found C-84.63, H-11.39 (%), calcd. C, 84.44, H, 11.8 (%); Rf: 0.64 (hexane: ethyl acetate, 17:3); Yield: 10 mg; m.p: 210°-211°; UV (Methanol): λmax 350; 1H and 13C NMR: Tabulated in Table 4.26; FT-IR (KBr): 576.98, 702.11, 824.89, 1023.35, 1083.37, 1204.44, 1273.79, 1356.55, 1395.78, 1456.68, 1519.46, 1646.32, 2928.97, 3426.57, 3747.67, 3858.20 cm-1; Mass (m/z): ESI-MS: 427.90 (negative mode) (Table 4).
| Carbon Number | 1H NMR (CDCl3, 400 MHz) δ ppm | 13C NMR (CDCl3, 400 MHz) δ ppm |
|---|---|---|
| 1 | 1.55-1.73 (1H, m, CH-1a) 1.35-1.41 (1H, m, CH-1b) |
37.97 |
| 2 | 1.55-1.73 (1H, m, CH-2a) 1.90-1.98 (1H, m, CH-2b) |
27.72 |
| 3 | 1.42-1.49 (1H, m, CH-3) 3.46-3.48 (1H, m, OH-3) |
78.56 |
| 4 | --- | 39.59 |
| 5 | 1.90-1.98 (1H, m, CH-5) | 54.89 |
| 6 | 1.25-1.30 (1H, m, CH-6a) 1.55-1.73 (1H, m, CH-6b) |
18.87 |
| 7 | 1.35-1.41 (1H, m, CH-7a) 1.55-1.73 (1H, m, CH-7b) |
35.48 |
| 8 | --- | 41.12 |
| 9 | 1.14-1.20 (1H, m, CH-9) | 51.06 |
| 10 | --- | 37.70 |
| 11 | 1.42-1.49 (1H, m, CH-11a) 1.14-1.20 (1H, m, CH-11b) |
21.48 |
| 12 | 1.42-1.49 (1H, m, CH-12a) 0.83-0.90 (1H, m, CH-12b) |
26.55 |
| 13 | 1.03-1.08 (1H, m, CH-13) | 37.97 |
| 14 | --- | 41.98 |
| 15 | 1.35-1.41 (1H, m, CH-15a) 1.55-1.73 (1H, m, CH-15b) |
28.96 |
| 16 | 1.14-1.20 (1H, m, CH-16a) 1.35-1.41 (1H, m, CH-16b) |
35.68 |
| 17 | --- | 42.94 |
| 18 | 1.03-1.08 (1H, m, CH-18) | 49.26 |
| 19 | 2.07-2.11 (1H, m, CH-19) | 48.17 |
| 20 | 1.55-1.73 (1H, m, CH-20a) 1.35-1.41 (1H, s, CH-20b) |
30.10 |
| 21 | 1.55-1.73 (1H, m, CH-21a) 1.42-1.49 (1H, m, CH-21b) |
39.08 |
| 22 | 1.01 (3H, s, CH3-22) | 23.78 |
| 23 | 1.01 (3H, s, CH3-23) | 23.78 |
| 24 | 1.00 (3H, s, CH3-24) | 17.47 |
| 25 | 1.01 (3H, s, CH3-25) | 16.08 |
| 26 | 1.00 (3H, s, CH3-26) | 17.47 |
| 27 | 0.98 (3H, s, CH3-27) | 23.21 |
| 28 | --- | 151.14 |
| 29 | 4.79 (1H, s, =CH-29a) 4.54 (1H, s, =CH-29b) |
109.99 |
| 30 | 1.78 (3H, s, CH3-30) | 21.33 |
Upon phytochemical analysis the qualitative investigation revealed the presence of more bioactive compounds in methanolic extract than hexane and chloroform extracts of A. alba. The quantitative analysis revealed the substantial presence of total alkaloids and total phenolics in methanolic extract than hexane and chloroform extracts of A. alba. Antioxidant studies revealed that the selected plant extract produced concentration dependent inhibition on tested free radicals. The methanolic extract showed better activity on DPPH free radical than remaining free radical tests i.e hydrogen peroxide and hydroxyl radical. The methanolic extract was potent in inhibiting the free radicals upon comparison with standard Ascorbic acid. Methanolic plant extract was subjected to column chromatography and three compounds were isolated. The isolated compounds were characterized by UV, FT- IR, H NMR, C NMR and mass spectral data studies and were identified as AAS-1, AAS-2 and AAS-3.
Qualitative anti-tuberculosis activity of the A. alba depicts that there was no significant effect of plant as an anti-tuberculosis upon comparing with standard Pyrazinamide-3.125 μg/ml, Streptomycin-6.25 μg/ml, Ciprofloxacin-3.125 μg/ml. which indicates clearly that the compounds present in the plant have no tubercular activity.
Further research has to be performed to explore more biological activities. Furthermore various active biochemical compounds of the plant have to be isolated and characterized to study and identify their molecular interactions that are vital for the assessment of their curative properties. The author have reported earlier the anti-cancer ,acute toxicity studies and anti-diabetic activity of the plant and further more activities have to be performed for a detailed profile of the plant to be established in future.
The literature review and local data from the mangrove region suggests that the plant have folklore claims of various activities of no scientifically proven and recorded evidence and the author extends in-depth work in future course.
Acknowledgements
The author would like to acknowledge Andhra University college of Pharmaceutical sciences, Andhra University, Visakhapatnam for providing their lab facilities and library.
Conflict of interests:
The authors have no conflict of interest to report.
References
- Jachak SM, Saklani A. Challenges and opportunities in drug discovery from plants. Curr Sci 2007:1251-7.
- Patwardhan B, Vaidya AD, Chorghade M. Ayurveda and natural products drug discovery. Curr Sci 2004:789-99.
- Quattrocchi, U. CRC World Dictionary of Plant Names, CRC press, Boca Raton; 2000. pp 242.
- Thatoi H, Samantaray D, Das SK. The genus Avicennia, a pioneer group of dominant mangrove plant species with potential medicinal values: A review. Front in Life Sci 2016;9(4):267-91.
- Duke NC. A systematic revision of the mangrove genus Avicennia (Avicenniaceae) in Australasia. Aust Syst Bot1991;4(2):299-324.
- Terrados J, Thampanya U, Srichai N, Kheowvongsri P, Geertz-Hansen O, Boromthanarath S, et al. The Effect of Increased Sediment Accretion on the Survival and Growth of Rhizophora apiculata Seedlings. Estuar CoastShelf Sci 1997;45(5):697-701.
- Tomlinson, P.B. The Botany of Mangroves. New York. Cambridge University Press; 1986. P. 191.
- Rosenthaler LG. The chemical investigation of plants. Bell Sons Ltd. London; 1930. P. 23, 27, 30, 99, 119 and 155.
- Hawk .P.B, Osler. B.L and Summerson .W.H. The Practical Physiological Chemistry. 13th ed. MC-Graw Hill Book Co, New York; 1954. P. 51-111.
- Wagner .H, Bladt.S and Zgainski. E.M, Plant drug analysis, Springer Verlag, Berlin; 1984. p. 24-40.
- Biren, S and Seth, A. K. Test book of Pharmacognosy and Phytochemistry, Elsevier, New Delhi; 2010. P. 107-109.
- Singleton VL, Orthofer R, Lamuela-Raventós RM. Analysis of total phenols and other oxidation substrates and antioxidants by means of folin-ciocalteu reagent. Method Enzymolo 1999; 299:152-178.
- Dastmalchi K, Dorman HD, Koşar M, Hiltunen R. Chemical composition and in vitro antioxidant evaluation of a water-soluble Moldavian balm (Dracocephalum moldavica L.) extract. LWT-Food Sci Technol 2007;40(2):239-48.
- Shamsa F, Monsef H, Ghamooshi R, Verdian-rizi M. Spectrophotometric determination of total alkaloids in some Iranian medicinal plants. Thai J Pharm Sci 2008;32:17-20.
- Nagai T, Myoda T, Nagashima T. Antioxidative activities of water extract and ethanol extract from field horsetail (tsukushi) Equisetum arvense L. Food Chem 2005;91(3):389-94.
- GÜLÇin I, Alici HA, Cesur M. Determination of in vitro antioxidant and radical scavenging activities of propofol. Chem Pharm Bull 2005;53(3):281-5.
[Crossref] [Google Scholar] [Pub Med]
- Blois MS. Antioxidant determinations by the use of a stable free radical. Nat 1958;181(4617):1199-200.
- Lourenco MC, de Souza MV, Pinheiro AC, Ferreira MD, Gonçalves RS, Nogueira TC, et al. Evaluation of anti-tubercular activity of nicotinic and isoniazid analogues. Arkivoc 2007;15:181-91.
- Pouchert, C. J and Campbell, J. R. Aldrich Library of NMR spectra. Aldrich Chemical Co., Inc., Milwaukee, Wisconsin; 1974. P. 141.
- Della Greca M, Monaco P, Previtera L. Stigmasterols from Typha latifolia. J Nat Prod 1990;53(6):1430-5.
- Ikan, R. Natural Product. A laboratory guide, 2nd ed. New York: Academic Press; 1991. P. 127-235.
- Rowshanul HM, Farjana N, Matiar R, Ekramul HM, Rezaul KM. Isolation of stigmasterol and ß-sitosterol from methnolic extract of root bark of Calotropis gigantea. Pak J Bio Sci 2007;22:4174-6.
[Crossref] [Google Scholar] [Pub Med]

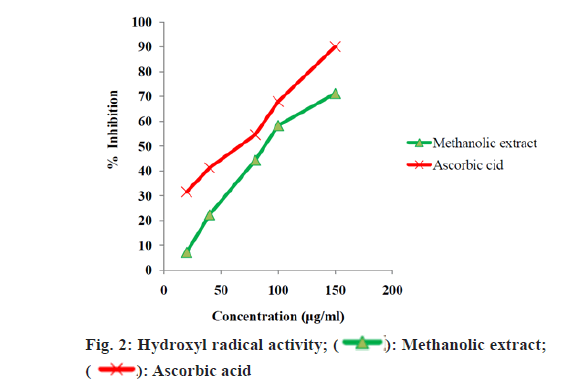
 Methanolic extract;


 Methanolic extract;
