- *Corresponding Author:
- B. S. Muddukrishna
Department of Pharmaceutical Chemistry, Manipal College of Pharmaceutical sciences, Manipal Academy of Higher Education, Manipal-576 104, India
E-mail: krishna.mbs@manipal.edu
| Date of Submission | 25 April 2017 |
| Date of Revision | 17 April 2018 |
| Date of Acceptance | 18 November 2018 |
| Indian J Pharm Sci 2019;81(1):57-62 |
This is an open access article distributed under the terms of the Creative Commons Attribution-NonCommercial-ShareAlike 3.0 License, which allows others to remix, tweak, and build upon the work non-commercially, as long as the author is credited and the new creations are licensed under the identical terms
Abstract
Methylcobalamin is a highly photolabile and unstable molecule and hence, studies regarding photodegradation of methylcobalamin were carried out. In order to investigate the stability studies, the drug was subjected to photodegradation by exposing it to different light conditions in the validated photostability chamber as per ICH Q1B guideline. The drug was found to be less degraded in the blue light and was more prone to degradation under fluorescent light. Validated stability indicating liquid chromatography method was used for separating the methylcobalamin and its degradation products. The methylcobalamin peak with a retention time of 2.978 min was observed to decrease with a commensurate increase in a degradant peak at 4 min. The observed degradant peak was suspected to be hydroxocobalamin and was further confirmed by molecular weight determination. The fractions collected from high performance liquid chromatography were later injected into mass detector to determine the mass of the degradation products, which was found to be 665.78 amu.
Keywords
Methylcobalamin, reversed-phase HPLC, MS/MS, hydroxocobalamin
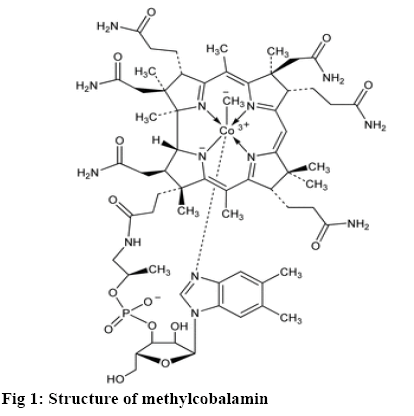
The photostability of a drug substance might be distinct as the response of the drug or drug product to the exposure to solar, UV, and visible light leads to a physical or chemical change [1]. Methylcobalamin, Cobalt(3+); [(2R,3S,4R,5S)-5-(5,6-dimethylbenzimidazol-1-yl)-4-hydroxy-2-(hydroxymethyl)oxolan-3-yl]1-[3-[(1R,2R,3R,5Z,7S,10Z,12S, 13S,15Z,17S,18S, 19R)-2,13,18-tris(2-amino-2-oxoethyl)-7,12,17-tris(3-amino-3-oxopropyl)-3,5,8,8,13,15,18,19-octamethyl-2,7,12,17-tetrahydro-1H-corrin-24-id-3-yl]propanoylamino]propan-2-yl-phosphate, is a cobalamine form of vitamin B12. It is used in the treatment of hyperhomocysteinaemia and peripheral neuropathy [2,3].It was previously reported predicted that photolysis of methylcobalamin was initiated by a ligand to ligand charge transfer (LLCT) excited state, which included elevation of an electron of the cobalt-carbon adhesion to a π* orbital of the corrin ligand. In possession by a determined proficiency of photolysis the absorption band at λmax=317 nm was assigned to LLCT (CH3 to corrin) transition of methylcobalamin. It was assumed that LLCT transition undergoes configuration interaction with the π-π* corrin intraligand excitation at wavelength above 313 nm is then also associated through the proclamation of methyl radical however with abridged efficacy. This study mentioned about the photodegraded product of methylcobalamin as aquocobalamin based on the spectroscopic nature of the degradation roduct [4]. But this study never mentioned about the mass of the degraded product. Hence the present investigation involved the determination of the mass of the degradation product using mass spectroscopy.
From this study it is possible to predict the pathway based on the mass of the degradation product. The method is more reliable when compared to the UV/ Vis spectroscopic methods [5]. The photodegradation process was carried out using photostability chamber, which was validated as per ICH Q1B guideline. The photodegradation products formed were separated by validated stability-indicating reversed-phase highperformance liquid chromatography (RP-HPLC) method [6] and the degradation products were further subjected to mass spectrometry (figure 1).
Materials and Methods
Biocon Limited, India provided an adequate amount of methylcobalamin as a gift sample. Commercial formulation A was used as the commercial formulation. HPLC grade acetonitrile (ACN) and methanol were procured from Finar Chemicals Limited (Ahemdabad, India). O-phosphoric acid (85 % pure) was purchased from Merck India Limited (Mumbai, India). MS grade methanol and MS grade ACN were obtained from Biosolve Chemicals, Bengaluru. Polytetrafluoroethylene (0.45 μ) membrane disc strainers were acquired from Pall Corporation (Mumbai, India). Millipore purification system (Siemens) provided the ultra clear water. Samples were examined on a Shimadzu HPLC (Kyoto, Japan) system equipped with LC Soln software and fortified by a LC-10 ADVP quaternary pump, a SIL- 10 ADVP auto injector, a SPD M-10A VP photo diode array detector (PDA) and a SPD-10Avp UV detection system. Further samples were analysed by Thermo Scientific Dionex Ultimate 3000 series HPLC coupled to LTQMS Mass Spectrometry through HESI interface Chromeleon system equipped with LTQ Tune, Xcalibur software. C18 Hypersil BDS (5 μ, 150×4.6 mm) column was used for the separation.
Chromatographic conditions [6]:
Validated stability indicating liquid chromatography method was used for separating and quantifying the methylcobalamin and its degradation products [3]. The separation was attained using a C18 Hypersil BDS (5 micron, 150×4.6 mm) column using mobile phase comprising of (55:45 v/v) methanol:o-phosphoric acid 0.02 % v/v pH 2.3 with a flow rate of 1.0 ml/min and effluents were monitored at 223 nm. The retension time of methylcobalamin was observed to be 2.9 min.
Photodegradation studies:
To obtain O-phosphoric acid (0.02 % v/v) solution, 20 μl of o-phosphoric acid was taken and made up to 100 ml with water. In order to obtain the diluent (mobile phase), 55 ml of methanol and 45 ml of 0.02 % o-phosphoric acid were mixed for dilutions in ratio of 55:45. Methylcobalamin working standard 10 mg was weighed accurately and then transferred in 10 ml volumetric flask. The volume was made up to the mark with diluent. The concentration was 1000 μg/ml. The solution was further diluted to get 100 μg/ml concentration by using mobile phase. The sample was kept in photo stability chamber and different colour of light bulbs were used for the degradation study such as yellow light, sodium vapour lamp, orange light, fluorescent light (lab light), green light, and blue light (Table 1) [7,8]. The sample was taken initially and at different time intervals and loaded into HPLC system.
| Light colour | Wavelength (nm) |
|---|---|
| Blue | 492-455 |
| Green | 577-492 |
| Orange | 622-597 |
| Yellow | 597-577 |
| Sodium vapor lamp | 589 |
| Fluorescent light | 253.7 and 189 |
Table 1: Different Sources of Light and Wave Length
Commercial formulation A of 500 μg/ml strength was used as test formulation. One millilitre of commercial formulation A was diluted up to 5 ml with mobile phase to get 100 μg/ml concentration. The sample was kept in photo stability chamber and exposed to fluorescent light. The sample was taken initially and at different time intervals and loaded into HPLC system. Tuning parameters for the determination of mass of degradation product are as follows, Table 2 [9,10].
| Polarity | Positive |
|---|---|
| Capillary voltage | 49.00 volts |
| Tube lens | 250.00 |
| Sheath gas flow rate | 5 ml/min |
| Auxiliary gas flow rate | 5 ml/min |
| Capillary temperature | 180° |
| Multipole 00 | –7.75 |
| Lens 0 | –8.00 |
| Multipole 1 | –11.00 |
| Multipole 0 | –8.50 |
| Lens 1 | –13.00 |
| Gate lens | –54.00 |
| Front lens | –11.00 |
Table 2: Tuning Parameters for Mass of Degradation Products Using LC-MS/MS
Results and Discussion
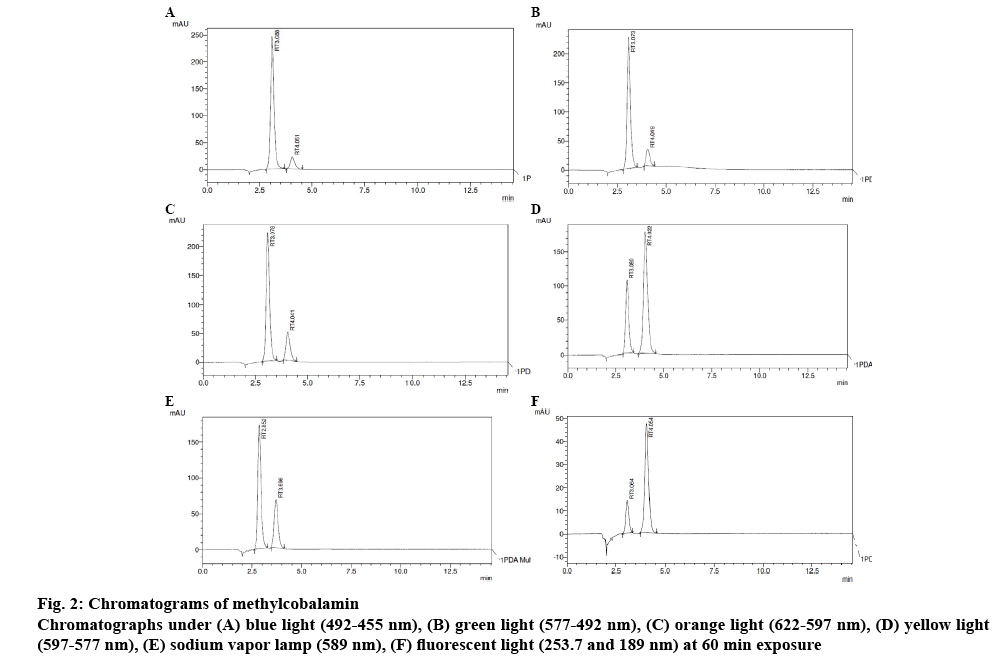
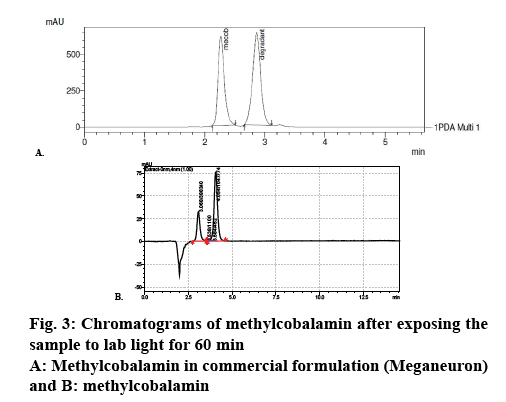
Methylcobalamine was subjected to photodegradation studies under different colour lights corresponding to various wave lengths (Table 3) [11], trend of photodegradation shows that under fluorescent light degradation of the methylcobalamine was maximum and under blue light drug degradation was minimum, which clearly indicated that blue light is best suitable for formulating methylcobalamine parenteral formulation. Chromatograms in figures 2 and 3 can be used as an evidence for these studies.
| ID | Sample | Time of exposure (min) | Retention time(min) | Area | % Degradation | Concentration (µg/ml) |
|---|---|---|---|---|---|---|
| Green light (577-492 nm) | Drug | 60 | 3.073 | 2686981 | 35.31 | 100 |
| Degradant | 60 | 4.049 | 388183 | - | - | |
| Orange light (622-597 nm) | Drug | 60 | 3.078 | 2533636 | 33.24 | 100 |
| Degradant | 60 | 4.041 | 680041 | - | - | |
| Yellow light (597-577 nm) | Drug | 60 | 3.080 | 1198372 | 17.72 | 100 |
| Degradant | 60 | 4.022 | 2660119 | - | - | |
| Blue light (492-455 nm) | Drug | 60 | 3.088 | 2870092 | 37.32 | 100 |
| Degradant | 60 | 4.051 | 328981 | - | - | |
| Sodium vapour lamp (589 nm) | Drug | 60 | 2.852 | 1928701 | 12.23 | 100 |
| Degradant | 60 | 3.696 | 931178 | - | - | |
| Fluorescent light (253.7 and 189 nm) | Drug | 60 | 3.064 | 160281 | 44.46 | 100 |
| Degradant | 60 | 4.054 | 637815 | - | - |
Table 3: Photodegradation Studies Using Various Lights
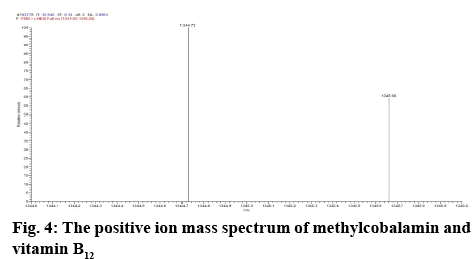
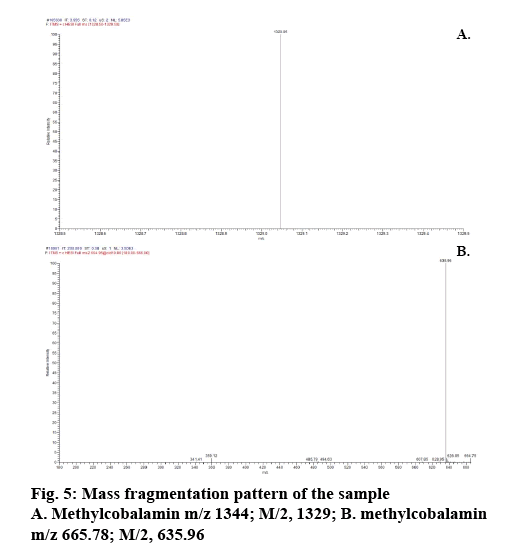
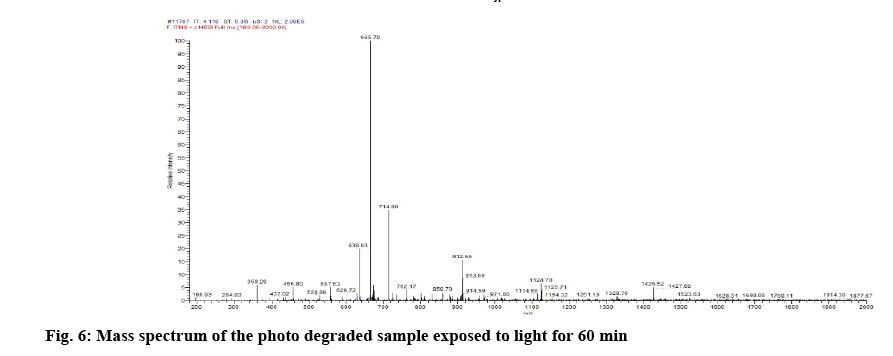
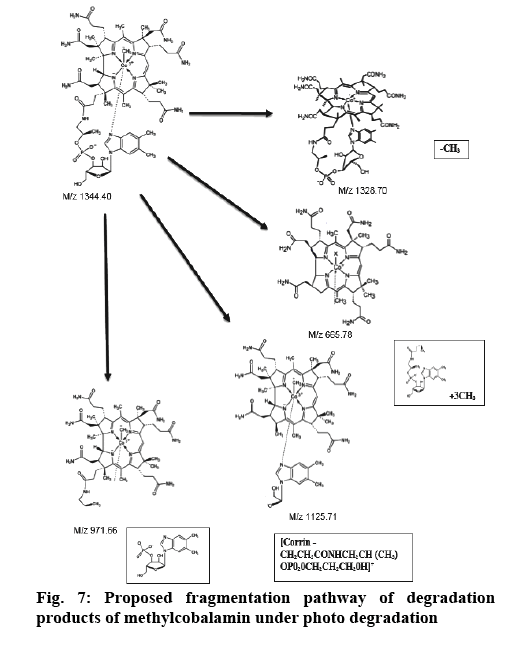
Determination of mass of the degraded products and its determination in commercial formulations were carried out. Samples were introduced into the ion source by means of an axially mounted direct insertion probe, which was terminated with a stainless-steel sample support. Samples were deposited from ACN solution onto the sample support (figures 4-7 and Table 4).
| m/z | Possible composition |
|---|---|
| 1329 | [M + H -axial ligand]+ |
| 1286 | [1329-CONH]+ |
| 1270 | [1329-CH3CONH2]+ or [1329-CO]+ |
| 1257 | [Corrin-benz-sugar-OPO2OCH(CH3)CH2]+ |
| 1199 | [Corrin-benz-sugar-OPO2]+ |
| 1183 | [1329-benz]+ |
| 1126 | [Corrin-CH2CH2CONHCH2CH(CH3) OPO2OCH2CH2CH2OH]+ |
| 1069 | [Corrin-CH2CH2 CONHCH2CH(CH3)0PO2OH+ H]+ |
| 1051 | [ 1069-H2O]+ |
| 989 | [Corrin - CH2CH2CONHCH2CH(CH3)OH]+ |
| 971 | [989-H2O]+ |
| 957 | [Corrin-CH2CH2CONHCHCH2]+ |
| 914 | [Corrin-CH2HCO]+ |
| 841 | [Corrin-H2O]+ |
| 801 | [Corrin+H-CH3CONH2]+ or [Corrin+H-CO]+ |
Benz = dimethylbenzimidazol
Table 4: Possible Compositions of the Major Cobalamine Fragments
It was found that methylcobalamin decomposes under the ambient light of laboratory and other lights used for the photodegradation studies. The methylcobalamin was found to be very less degraded under blue light. The methylcobalamin peak decreased with a commensurate increase in a degradant peak at 4 min. The peak was suspected to be hydroxocobalamin as methylcobalamin is susceptible to photolysis. The fact was further confirmed by determination of molecular weight of the degradant. Therefore methylcobalamin is extremely light sensitive, enduring the homolytic cleavage of cobalt-carbon bond.
The peak corresponding with standard methylcobalamin was ionized. The ionized peak mass confirms the existence of methylcobalamin in the sample. The mass of methylcobalamin is m/z 1344. Similarly, spectra of methylcobalamin was achieved, which displays [M+H] ion at m/z 1344.73. The methylcobalamin provides an intense peak at m/z 1329 conforming to the loss of the axially involved ligand. The [M+H]+ ion intensities qualified to this peak are in the 1344+ i.e. RCH3 where R' is the coenzyme of the axial group.
From the literature and our work, it has been observed that all the cobalamine molecules exhibit similar fragmentation patterns when subjected to MS fragmentation in the mass range of 1329- 800 amu. From the fragmentation, we have observed loss of acetamide from corrin as well as its major fragmentation is focused on the chain, which is axially attached to cobalt. Direct injection of degradation sample was onto MS/MS and found out that its peak is seen at 665.0 amu, which corresponded to peak 1328.5 amu, first major fragmentation peak. Methylcobalamin on fragmentation lost dimethylbenzimidazol group at cobalt end and few sugar and phosphate groups, which gives peak at m/z 971.
A simple, efficient and sensitive method was developed using PDA detector by utilizing the λmax of the drug methylcobalamin in order to determine its stability. The methylcobalamin peak decreased with a commensurate increase in degradant peak. The peak was found to be of hydroxycobalamin. Therefore, methylcobalamin is very light sensitive and undergoes the homolytic cleavage of the cobalt-carbon bond. This method could be used for stability studies of methylcobalamin API and its commercial formulations.
Acknowledgements
The authors are grateful to Biocon Ltd India for provding methylcobalamine and Manipal College of Pharmaceutical Sciences, Manipal Academy of Higher Education, Manipal for providing laboratory support.
Conflict of interest
None.
Financial assistance and scholarship
Nil.
References
- Ahmad I, Ahmed S, Anwar Z, Sheraz MA, Sikorski M. Photostability and Photostabilization of Drugs and Drug Products. Int J Photoenergy2016;2016:8135608.
- Zhang YF, Ning G. Mecobalamin. Expert Opin Investig Drugs 2008;17:953-64.
- Reddy LS, Reddy SLNP, Reddy GS. Validated stability indicating liquid chromatographic method for simultaneous estimation dosulepin and methylcobalamin in combined pharmaceutical dosage form. Orient J Chem 2014;30(3):1243-51.
- Kunkely H, Vogler A. Photolysis of methylcobalamin. Nature of the reactive excited state. J Organomet Chem1992;453:269-72.
- Kuntzleman TS, Jacobson EC. Teaching Beer’s law and absorption spectrophotometry with a smart phone: a substantially simplified protocol. J Chem Educ 2016;93:1249-52.
- Chamle A, Shane NLJ, Pai G, Pai A, Sathyanarayana MB. RP-HPLC Method Development and Validation for the Estimation of Methylcobalamin in Bulk. J Global Pharm Technol 2017;9:6-12.
- LED Color Chart. [cited 2017 June 24]. Available from: http://www.theledlight.com/color_chart.html.
- Wavelengths of the basic colors (Red, Orange, Yellow, Green, Blue, Violet) in the color spectrum [cited 2017 June 28]. Available from: http://www.physlink.com/education/askexperts/ae2.cfm.
- Mohsin S, Zumwalt M, Singh I. Quantitative Analysis of Water-Soluble B-Vitamins in Cereal Using Rapid Resolution LC/MS/MS. Agilent Technologies, Inc. Available from: https://cn.agilent.com/cs/library/applications/5989-7084EN.pdf.
- Dayle RM. Quantitative analysis of the major Water Soluble Vitamins in human serum by Liquid Chromatography Triple Quadrople mass Spectrometry on the Agilent Triple Quad 6460 Mass Spectrometer. Agilent Technologies Inc. Wilmington, Delaware 19808. Available from: https://www.cerilliant.com/shopOnline/OpenDocument.aspx?DocumentID=215.
- Barber M, Bordoli RS, Sedgwick RD, Tyler AN. Fast atomic bombardment mass spectrometry of cobalamines. Biomed Mass Spectrom 1981;8:492-5.
