- *Corresponding Author:
- U. Nazim
Department of Pharmaceutical Chemistry, Faculty of Pharmaceutical Sciences, Baqai Medical University, Gadap Road, Toll Plaza, Super Highway, Karachi-74600, Pakistan
E-mail: urooj.nazim@yahoo.com
| Date of Submission | 16 September 2010 |
| Date of Revision | 1 July 2011 |
| Date of Acceptance | 8 July 2011 |
| Indian J Pharm Sci, 2011, 73 (4): 387-391 |
Abstract
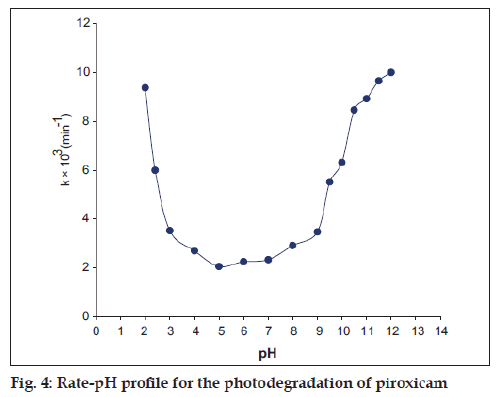
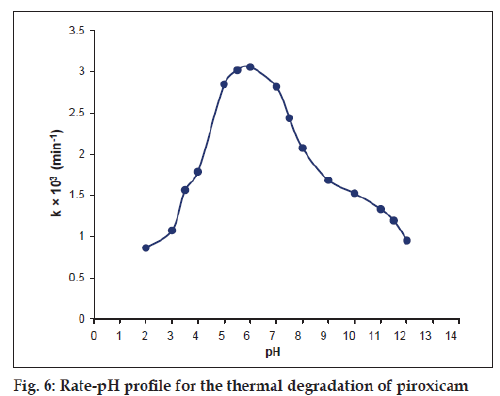
Light and temperature have considerable effect on the degradation of piroxicam in aqueous solutions. The pH and acetate buffer ions also affect the degradation process. The apparent first-order rate constants for the photochemical and thermal degradation of piroxicam have been determined as 2.04–10.01 and 0.86-3.06×10⁻³ min−1, respectively. The first-order plots for the degradation of piroxicam showed good linearity within a range of 20-50% loss of piroxicam at pH 2.0-12.0. The rate-pH profile for the photodegradation of piroxicam is a U-shaped curve and for the thermal degradation a bell-shaped curve in the pH range of 2.0-12.0. The thermal degradation of piroxicam was maximum around pH 6.0. It is increased in the presence of acetate ions but was not affected by citrate and phosphate ions.
Keywords
Buffer effect, kinetics, piroxicam, photodegradation, thermal degradation
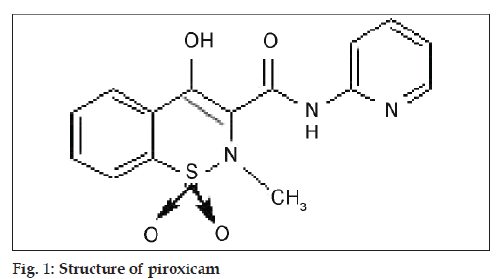
Piroxicam, 4-hydroxy-2-methyl-N-(2-pyridyl)-2H- 1,2-benzothiazine-3-carboxamide-1,1-dioxide) (fig. 1) belongs to the class of nonsteroidal antiinflammatory drugs (NSAIDs), which is structurally unrelated but pharmacologically similar to other NSAIDs [1]. A number of degradation products of piroxicam are reported in British Pharmacopoeia [2], including 2-aminopyridine, which has been identified as a hydrolytic product by some workers [3,4]. The hydrolysis of cinnoxicam follows a pseudo-first order reaction as a function of temperature [5]. Some studies on the thermal degradation [5-7] and photodegradation [8-10] of piroxicam have been conducted in the solid state and in aqueous solution.
In the present work the degradation of piroxicam over a wide pH range under the influence of heat, light and buffers has been studied and the kinetics of theses reactions evaluated. The relation of rates of degradation with pH has been developed and the pH of maximum stability has been reported.
Materials And Methods
Piroxicam was obtained from Sigma Chemical Co., 1,10–phenanthroline, ammonium iron (III) sulphate dodecahydrate, hydrochloric acid and methanol were obtained from Merck. The reagents were analytical grade from BDH. The following buffers were used throughout: KCl + HCl buffer, pH. 2.0; Citric acid + Na2HPO4, pH 3.0-7.0; Na2B4O7.10H2O + NaOH, pH 8.0-10.0; NaHCO3 + NaOH, pH 11.0; Na2HPO4 + NaOH, pH 11.5-12.0; the ionic strength in each case was 0.05 M.
All absorbance measurements were made on a Shimadzu UV/Vis model UV-1601 spectrophotometer (range 190-1100 nm).
Assay method:
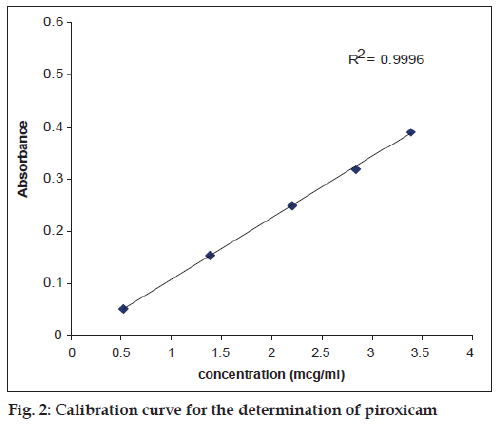
The assay of piroxicam in pure and degraded solutions was carried out by a previously reported method [11], according to the following procedure: A 0.6 ml of the degraded solution was placed in a 10 ml volumetric flask, 8 ml of acidified 1,10– phenanthroline solution was added, the pH was adjusted to 3.5 with 0.5M NaOH/HCl and the solution made up to volume. The contents were mixed, allowed to stand for 25 min. at room temperature and the absorbance measured at 510 nm. The concentration of piroxicam in the degraded solutions was determined using a calibration curve (fig. 2). The validity of Beer’s law was confirmed in the concentration range used for the assay.
Photodegradation:
A 10 ml aliquot of piroxicam solution (3.31 mg) was placed in a 250 ml beaker and diluted to almost 80 ml. The pH of the solution was adjusted to the desired value (2.0-12.0) with appropriate buffer. The solution was transferred to a 100 ml volumetric flask, made up to volume with the buffer and irradiated with a Philips 30 W TUV- tube fixed horizontally at a distance of 30 cm from the centre of the flask. Samples were withdrawn at appropriate intervals for spectrophotometric assay.
Thermal degradation:
A volumetric flask containing 3.31 mg/100 ml solution of piroxicam, adjusted to the desired pH value (2.0-12.0) with appropriate buffer, was placed in a thermostat water bath and heated to 100°. Samples were withdrawn at appropriate intervals, cooled to room temperature and assayed for piroxicam content.
Results And Discussion
Piroxicam shows absorption maxima at 242 nm (0.1 M HCl), and 256, 290 and 358 nm (methanol) [12]. Photochemical degradation of piroxicam solution at pH 2.0 (maximum degradation) showed absorption maxima at 242 and 356 nm [12], which gradually decreased with time, indicating the degradation of piroxicam on UV exposure. However, after 3 h the spectrum was almost stable in the 270-330 nm region. Similar spectral changes were observed in piroxicam solutions degraded in neutral and alkaline solutions.
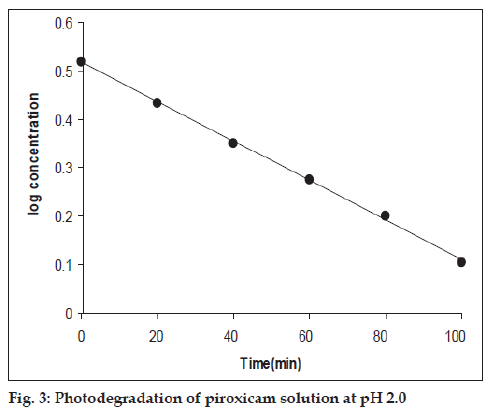
First-order plots of log concentration versus time for the photochemical reactions (pH 2.0-12.0) showed good linearity within a range of 20-50% loss of piroxicam (fig. 3) and the rates were found to be affected by the pH of the solution (Table 1). The rate-pH profile for the photodegradation of piroxicam is U-shaped which shows that the photodegradation may undergo specific acid-base catalysis. This results in an increase in the rate with a decrease in pH in the acid region and with an increase of rate in pH in the alkaline region. The almost constant photodegradation rate between pH 4 and 6 appears to be due to the solvent catalytic effect that is, the un-ionized watercatalyzed reaction (Table 1, fig. 4). The rate law for the acid-base catalyzed reaction may be written as: Kobs=k0+k1[H+]+[OH−]. At low pH, the term k1 [H+] is greater and specific hydrogen ion catalysis is observed. Similarly at high pH, the concentration of [OH−] is greater and specific hydroxyl ion catalysis is observed.
| pH | k×103(min−1) | Corr. coeff. |
|---|---|---|
| 2.0 | 9.380 | 0.999 |
| 2.4 | 6.010 | 0.993 |
| 3.0 | 3.510 | 0.992 |
| 4.0 | 2.680 | 0.996 |
| 5.0 | 2.040 | 0.993 |
| 6.0 | 2.240 | 0.992 |
| 7.0 | 2.320 | 0.993 |
| 8.0 | 2.900 | 0.992 |
| 9.0 | 3.460 | 0.998 |
| 9.5 | 5.500 | 0.994 |
| 10.0 | 6.330 | 0.997 |
| 10.5 | 8.480 | 0.999 |
| 11.0 | 8.935 | 0.997 |
| 11.5 | 9.670 | 0.999 |
| 12.0 | 10.01 | 0.998 |
Table 1: Apparent first-order rate constants For the photo-degradation of piroxicam at Ph 2.0-12.0
Many drugs undergo degradation to give U-shaped rate-pH profiles; such profiles have been observed for the degradation of penicillin [13], cytarabine [14], amphotericin B [15], carbenicillin [16], cyanocobalamin [17], and diltiazem [18].
The spectral changes in the absorption spectra of piroxicam solution (pH 6.0) on heating at 100° for two hours showed a gradual loss of absorbance around 356 and 250 nm indicating degradation of the molecule to unknown products. The degradation may be due to the hydrolysis of piroxicam by cleavage of the amide bond attached to the 2-pyridine ring [3,4] and the resultant absorption in the 200-400 nm regions. Similar changes were observed at other pH values.
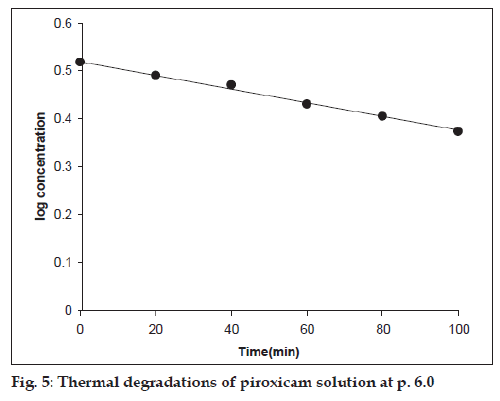
The thermal degradation of piroxicam solution carried out at pH range 2.0-12.0 also followed firstorder kinetics (fig. 5). The apparent first-order rate constants for the reactions are reported in Table 2.
| pH | k×103(min−1) | Corr. coeff. |
|---|---|---|
| 2.0 | 0.86 | 0.993 |
| 3.0 | 1.07 | 0.992 |
| 3.5 | 1.56 | 0.994 |
| 4.0 | 1.79 | 0.997 |
| 5.0 | 2.85 | 0.993 |
| 5.5 | 3.02 | 0.996 |
| 6.0 | 3.06 | 0.993 |
| 7.0 | 2.82 | 0.991 |
| 7.5 | 2.44 | 0.995 |
| 8.0 | 2.08 | 0.992 |
| 9.0 | 1.68 | 0.992 |
| 10.0 | 1.52 | 0.992 |
| 11.0 | 1.33 | 0.998 |
| 11.5 | 1.19 | 0.996 |
| 12.0 | 0.95 | 0.996 |
Table 2: Apparent first-order rate constants For the thermal degradation of piroxicam at Ph 2.0-12.0
The thermal degradation of piroxicam represents a bell-shaped pH-rate profile in the pH range 2.0-12.0 (fig. 6) showing the pH of maximum degradation around 6.0, which then slows down due to ionization of the molecule. Such curves indicate the presence of two ionisable groups in the molecule and the most reactive species is the non-ionized form [19]. The bell-shaped pH-rate profile of piroxicam shows the pH of maximum degradation at 6.0. The rate of the reaction is enhanced with pH up to 6.0 due to the pH dependent change in the rate-determining step and then slows down due to ionization of the molecule. This may be applied to the degradation of piroxicam by hydrolysis in which the rate of reaction depends on the species present at a particular pH and its variation with the ionization of the molecule.
Examples of bell-shaped pH-rate profiles include the hydrolysis of estrone phosphate[20], dicarbazine [21], hydrochlorothiazide [22], tyrphostins [23] and decarboxylation of 4-aminosalicylic acid [24].
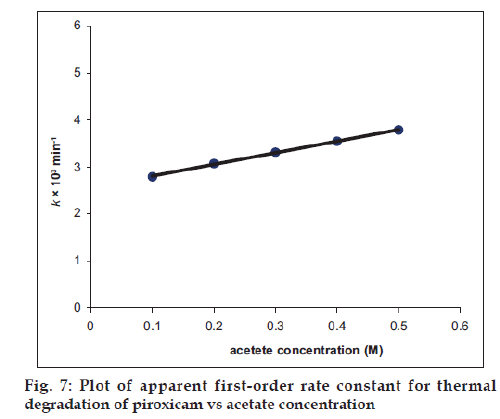
The Effect of buffer ions (acetate, citrate, phosphate) on the rate of thermal degradation of piroxicam (100°) has been studied at pH 5.6 (pHmax). The citrate and phosphate ions do not exert any effect on the rate of degradation. However, the acetate ions were found to increase the rate of thermal degradation.
The second-order rate constant for the base-catalyzed degradation of piroxicam in the presence of acetate ions is 1.90×10⁻³ M−1 min−1. Thus the presence of acetate ions in the solution containing piroxicam leads to an increase in the rate of degradation due to the catalytic effect of these ions and should be avoided in the preparation of piroxicam solutions (Table 3, fig. 7).
| Buffer conc. (M) | k*103(min-1) | Corr. coeff. |
|---|---|---|
| 0.1 | 2.79 | 0.999 |
| 0.2 | 3.08 | 0.998 |
| 0.3 | 3.32 | 0.998 |
| 0.4 | 3.55 | 0.999 |
| 0.5 | 3.79 | 0.999 |
Table 3: Apparent first-order rate constants For the thermal degradation of piroxicam at Ph 5.6 in the presence of acetate ions
Acknowledgements
I (U.N.) wish to express my feelings of thanks to Prof. Dr. S. Fazal Hussain, C.E.O and Dr. Shaukat Khalid, Acting Dean, Baqai Institute of Pharmaceutical Sciences, Baqai Medical University, Karachi who provided me the necessary research facilities to carry out this research work.
References
- Raffa RB. Analgesic-antipyretic and antiinflammatory drugs. In: Henderickson R, editor. Ramington?s The Science and Practice of Pharmacy. 21st ed. Baltimore: Lippincott Williams and Wilkins; 2006. p. 1540.
- British Pharmacopoeia. London: HMSO Publication; 2009. Electronic Version.
- Puthli SP, Vavia, PR. Stability indicating HPTLC determination of piroxicam. J Pharm Biomed Anal 2000;22:673-7.
- Puthli SP, Vavia PR. Stability studies of micro particulate system with piroxicam as model drug. AAPS PharmSciTech 2009;10:872-80.
- Ficarra R, Villari A, Micali N, Tommasini S, Calahro ML, Di Bella?M, et? al. Stability study of piroxicam and cinnoxicam in solidpharmaceuticals. J Pharm Biomed Anal 1999;20:283-8.
- Florey K, editor. Analytical Profile of Drug Substances. Vol. 15. New?York: Academic Press; 1986. p.?526.
- Drebushchak VA, Shakhtshneider TP, Apenina SA, Drebushchak TN, Medvedeva AS, Safronoval LP, et al.Thermoanalytical investigation of drug-excipient interaction, Part 1, Piroxicam, cellulose and chitosan as starting material. J Thermal Anal Calorim 2006;84:643-9.
- Miranda M, Vargas F, Serrano G. Photodegradation of piroxicam under aerobic conditions, the photochemical keys of the piroxicam enigma. J PhotochemPhotobiol B 1991;48:199-202.
- Bartsch H, EiperKopelent-Frank H. Stability indicating assays for the determination of piroxicam comparison methods. J Pharm Biomed Anal 1999;20:531-41.
- Lemp E, Zanocco AL, Gunther G. Sentilizedphotoxygenation of piroxicam in neat solvents and solvent mixtures. J PhotochemPhotobiol B 2001;31:165-70.
- Nagaralli BS, Seetharamappa J, Melwanki MB. Spectrophotometric methods for the determination of amoxycillin, ciprofloxacin and piroxicam in pure and pharmaceutical formulations. J Pharm Biomed Anal 2002;29:859-64.
- Mihalic M, Hofan H, Kuftinec J, Krile B, Caplar V, Kajfez F, et?al.Piroxicam. In: Florey K, editor. Analytical Profiles of Drug Substances. Vol. 15. New York: Academic Press; 1986. p. 509-31.
- Schwarts MA. Catalysis of penicillin hydrolysis by catechol and 3,6-bis(dimethylaminomethyl) catechols. J Pharm Sci 1964;53:1433-6.
- Notari RE, Chin ML, Wittbort R. Arabinosycytosine stability in aqueous solutions: pH profile and shelf life predictions. J Pharm Sci 1975;61:1189-96.
- Hamilton-Miller JM. The effect of pH and of temperature on the stability and bioactivity of nystatin and amphotericin B. J Pharm Pharmacol 1973;25:401-7.
- Zia H, Teharan M, Zargarbashi R. Kinetics of carbenicillin degradation in aqueous solutions. Can J Pharm Sci 1974;9:112-7.
- Ahmad I, Hussain W, Faridi AA. Photolysis of cyanocobalamin in aqueous solution. J Pharm Biomed Anal 1992;10:9-15.
- Won CM, Iula AK. Kinetics of hydrolysis of diltiazem. Int J Pharm 1992;79:183-90.
- Yoshioka S, Stella VJ. Stability of Drugs and Dosage Forms. New York: Kluwer Academic Press; 2000. p. 80-99.
- Kearney AS, Stella VJ. Hydrolysis of pharmaceutically relevant phosphate monoester monoanions: Correlation to an established structure-reactivity relationship. J Pharm Sci 1993;82:69-72.
- Shetty BV, Schowman RL, Slivak M, Riley CM. Degradation of dicarbazine in aqueous solution. J Pharm Biomed Anal 1992;10:675-83
- Molica JA, Rehin CR, Smith JB. Govern HK. Hydrolysis of benzothiadiazines. J Pharm Sci 1971;60:1380-4.
- Won CM. Kinetics and mechanism of hydrolysis of tyrphostin. Int J Pharm 1994;104:29-40.
- Jivani SG, Stella VJ. Mechanism of decarboxylation of p-aminosalicylic acid. J Pharm Sci 1985;74:1274-82.
