- *Corresponding Author:
- A. Ravikiran
Department of Chemistry, SRM University, SRM Nagar, Kattankulathur-603 203, Kancheepuram, India
E-mail: ravianalytical@gmail.com
| Date of Submission | 16 January 2013 |
| Date of Revision | 07 April 2013 |
| Date of Acceptance | 12 April 2013 |
| Indian J Pharm Sci 2013; 75(3):361-364 |
Abstract
In the current work the kinetics of dehydration of ziprasidone hydrochloride monohydrate was studied by nonisothermal thermogravimetry. Ziprasidone hydrochloride monohydrate was heated from 30 to 150° with a heating rate of 5° per min under nitrogen gas atmosphere and weight loss data were collected. Powder X-ray difraction was used to characterize the solid before and after dehydration. The well accepted Coats-Redfern model fitting approach was applied to the thermogravimetry data for the kinetic analysis. Thirteen solid state reaction models were studied; among them one-dimensional diffusion model was found to be the best fit model for this reaction with an excellent correlation 0.9994. The Arrhenius parameters, activation energy, and pre-exponential factor were determined, the values were found to be 28 k.cal/mol and 9.53×10 13 sec−1 , respectively.
Keywords
Model fitting, kinetics, dehydration, thermogravimetry, ziprasidone hydrochloride
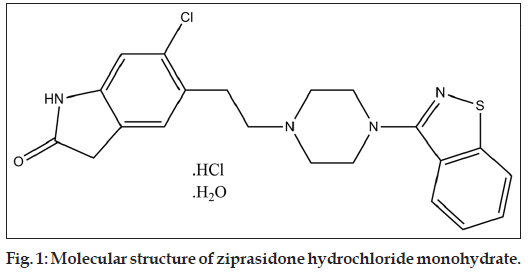
Ziprasidone hydrochloride (ZH), chemically 5-[2-[4-(1,2benzisothiazol-3-yl)-1-piperazinyl] ethyl]-6-chloro-1,3-dihydro-2H-indol-2-one, monohydrochloride, represented in fig. 1, is a typical antipsychotic drug used for the treatment of schizophrenia, a mental disorder. It is commercially available as Geodon® capsules[1]. Anhydrous and monohydrate forms of ZH are known from literature[2].
In view of increasing regulatory concern related to solid form of the drug substance in the recent days, it is highly important to understand the physical stability of different solid forms of a drug substance and their inter-convertibility[3,4]. Understanding the kinetics of solid state reactions in relation to phase transformations of drug substance leaves an opportunity to optimize the operational conditions so as to prevent and have control over the changes in solid from, during manufacturing process and shelf life of the drug product. In the present work dehydration of ZH monohydrate to ZH anhydrous form, as represented in Eqn. (1) was studied by thermogravimetry (TG). ZH.H2O→ZH+H2O.(1) TG is often used to study the kinetics of solid state reactions involving weight change during reaction. Some examples of such reactions include thermal decomposition, oxidation, and dehydration or desolvation[5,6]. Since the number of data points is high enough for kinetic analysis of weight loss data, TG has become useful for this purpose. In the present work TA’s Thermo gravimetric analyzer (TGA), Model Q5000IR was used for the study. Temperature calibration of TGA was performed by measuring Nickel Curie point (CP) at 354°. The Curie point is a physical property of a metal; it is the temperature point above which the metal loses ferromagnetic properties. Weight calibration of TGA was performed by using 50 mg standard reference material. About 15.7 mg of ZH-monohydrate was taken into aluminum pan. The instrument was programmed to heat the specimen from 30 to 150° with a heating rate 5° per min. Nitrogen was used as a purge gas with a flow rate of 50 ml/min. Model fitting approach[7-9] was applied on the collected weight loss data using Coats-Redfern method[10]. Powder X-Ray diffraction (PXRD) patterns of the ZH-Anhydrous and ZH-Monohydrate were collected by using Bruker D8 ADVANCE Powder X-ray Diffractometer equipped with Cu anode.
General form of rate equation of solid state reactions
used for isothermal analysis is  where α is the extent of reaction, t is the time, T is
the temperature, and f (α) is reaction model. For the
current dehydration study:
  where wo,
wt and B are the initial mass of the sample, the mass
at time t and the fraction of weight loss for complete
dehydration of the reaction, respectively. Integral form
of Eqn. (2) is
  According to Arrhenius equation
 ….(5), where k, Ea, and A are the rate constant,
the activation energy, and the pre-exponential
factor, respectively.
  under
nonisothermal conditions integral form of Eqn. (6) is
  where b is the heating rate.
 is replaced by a variable x, the temperature
integral Eqn. (7) becomes
 then the Eqn. (8) becomes
 where, p(x) is the
exponential integral, it has no analytical solutions but
has many approximations[11]. The Eqn. (9) can be used
for several model fitting methods for the analysis of
nonisothermal kinetics.
Model-fitting approach involves fitting different models to α-temperature curves. A model is a mathematical expression, developed based on mechanistic assumptions, transforms a solid state reaction process into a rate equation. Therefore, different rate expressions are produced from these models. To explain solid state reactions, there are four models such as (i) nucleation, (ii) geometrical contraction, (iii) diffusion, and (iv) reaction order models. Briefly, nucleation model is often used for reactions like crystallization, crystallographic transition, decomposition, adsorption hydration, and desolvation. The geometrical contraction model assumes that nucleation occurs rapidly on the surface of the crystal and the rate of degradation is controlled by the resulting reaction interface progress toward the center of the crystal. The diffusion model best explains solid state reactions involving gaseous products, where the reaction rate is controlled by the movement of reactants or products from the reaction interface or product layer. The order-based models are the simplest models as they are similar to those used in homogeneous kinetics. In these models, the reaction rate is proportional to concentration, amount or fraction remaining of reactant(s) raised to a particular power (integral or fractional) which is the reaction order[12].
In the current study popular Coats-Redfern method
was used in which the asymptotic series expansion for
approximating Eqn. (9) is used to get the following
equation:  where T is the mean experimental temperature. Using
this Eqn. (10), the values of Ea and A can be obtained
from slope and intercept values, respectively, from the graph plotted for
 versus 1/T for different
models, as represented in Table 1.
| Reaction model | f(α) | g(α) | Ea (kcal/mol) | A | -R |
|---|---|---|---|---|---|
| Nucleation models | |||||
| Power law | 4α3/4 | α1/4 | 2 | 0.01 | 0.9988 |
| Power law | 3α2/3 | α1/3 | 4 | 0.03 | 0.9990 |
| Power law | 2α1/2 | α1/2 | 0 | 0.00 | 0.9945 |
| Avrami-Erofeev | 4 (1-α) [-ln (1-α)]3/4 | [-ln (1-α)]1/4 | 3 | 0.01 | 0.9956 |
| Avrami-Erofeev | 3 (1-α) [-ln (1-α)]2/3 | [-ln (1-α)]1/3 | 4 | 0.12 | 0.9963 |
| Avrami-Erofeev | 2 (1-α) [-ln (1-α)]1/2 | [-ln (1-α)]1/2 | 7 | 9.18 | 0.9969 |
| Diffusion models | |||||
| One dimensional diffusion | 1/2 α-1 | α2 | 28 | 9.53×10¹³ | 0.9994 |
| Diffusion control (Janders) | 2 (1-α)2/3 [1-(1-α)1/3]-1 | [1-(1-α)1/3]2 | 31 | 1.47×10¹⁵ | 0.9983 |
| Diffusion control (Crank) | 3/2[(1-α)-1/3-1]-1 | 1-2/3 α-(1-α)2/3 | 30 | 2.66×10¹⁴ | 0.9987 |
| Reaction order and geometrical contraction models | |||||
| Mampel (first order) | 1-α | [-ln (1-α)] | 16 | 3.06×10⁶ | 0.9974 |
| Second Order | (1-α)2 | (1-α)-1-1 | 18 | 2.20×10⁸ | 0.9944 |
| Contracting cylinder | 2 (1-α)1/2 | 1-(1-α)1/2 | 14 | 2.12×10⁵ | 0.9985 |
| Contracting Sphere | 3 (1-α)2/3 | 1-(1-α)1/3 | 15 | 2.70×10⁵ | 0.9981 |
Table 1: Solid state reaction models used and arrhenius parameters for nonisothermal dehydration of ziprasidone hydrochloride monohydrate using coats-redfern method
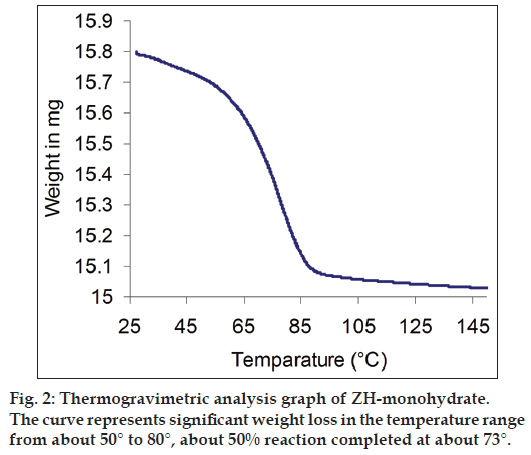
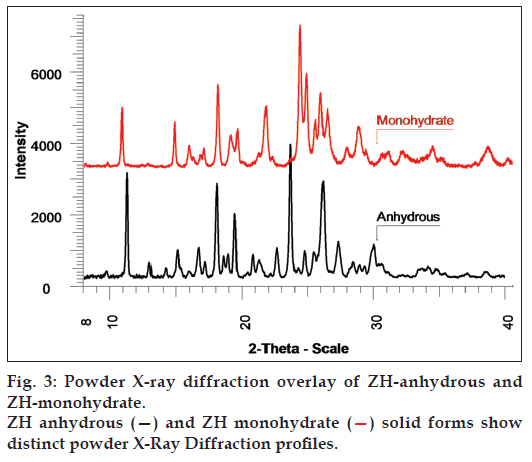
The TG data indicated a total weight loss of about 4.067% w/w in the temperature range from about 30 to 90° and it was also observed that the fraction of extent of reaction was reached 0.5 at about 73°. The TG thermogram is represented in fig. 2. The comparison of PXRD patterns of ZH-anhydrous and ZH-monohydrate is represented in fig. 3, which shows the change in the PXRD profile of ZH-monohydrate after dehydration process, indicating conversion of the monohydrate into an anhydrous form, having a different crystalline structure.
By using various expressions for g(α ) in Eqn. (10),
Arrhenius parameters were calculated from the plot of  against 1/T. The set of calculated Arrhenius
parameters for dehydration of ZH monohydrate are listed in Table 1. For each model, goodness fit was
determined by the correlation value, as mentioned in
Table 1. All models have resultant correlation greater
than 0.99. The first six reaction models have very
small values of pre-exponential factor demonstrating
that these models cannot explain the reaction kinetics.
Among the remaining models, one-dimensional
diffusion model has got maximum correlation of
0.9994.
In conclusion, dehydration of ZH-monohydrate was successfully studied using TG and PXRD. A distinct Powder XRD pattern was observed for dehydrated solid when compared with the monohydrate, indicating transformation into different crystalline phase. The nonisothermal weight loss data obtained from TG were used for kinetics analysis, one dimensional diffusion model was found to be the best fit among 13 models evaluated using Coats-Redfern method and the calculated values of Ea and A are 28 kcal/mol and 9.53×10¹³ sec−1, respectively. Thus, reliable evaluation of kinetic parameters of dehydration process of pharmaceutical hydrates is very important to optimize the operating conditions required during manufacturing process and shelf-life of its formulation. TG in combination with powder XRD can be used to evaluate dehydration kinetics and to determine Arrhenius parameters, in relatively short time.
References
- Geodon.com [Internet]. New York: Pfizer Inc.; c2012-Available from: https://www.geodon.com/about-geodon.aspx [Last cited on 2012 Nov 20].
- United States Patent Number 5,312,925 (1994 May 17), Monohydrate of 5-(2-(4-(1,2-benzisothiazol-3-yl)-1-piperazinyl)-ethyl)-6-chloro-1,3-dih ydro-2H-indol-2-one-hydrochloride. Available from: http://patft.uspto. gov/[Last updated on 2010 Aug 26; cited on 2012 Nov 20].
- Yu LX, Furness MS, Raw A, Outlaw KP, Nashed NE, Ramos E, Miller SP, et al. Scientific considerations of pharmaceutical solid polymorphism in abbreviated new drug application. Pharm Res 2003;20:531-6.
- Raw AS, Furness MS, Gill DS, Adams RC, Holcombe FO Jr, Yu LX. Regulatory considerations of pharmaceutical solid polymorphism in Abbreviated New Drug Applications (ANDAs). Adv Drug Deliv Rev 2004;56:397-414.
- Giron D. Applications of thermal analysis in the pharmaceutical industry. J Pharm Biomed Anal 1986;4:755-70.
- MacCallum JR, Tanner J. The kinetics of thermogravimetry. EurPolym J 1970;6:1033-9.
- Doyle CD. Kinetic analysis of thermogravimetric data. J ApplPolymSci 1961;5:285-92.
- Vyazovkin S, Wight CA. Model-free and model-fitting approaches to kinetic analysis of isothermal and nonisothermal data. ThermochimActa 1999;340:53-68.
- Tanaka H. Thermal analysis and kinetics of solid state reactions. ThermochimActa 1995;267:29-44.
- Coats AW, Redfern JP. Kinetic parameters from thermogravimetric data. Nature 1964;201:68-9.
- Doyle CD. Series Approximations to the equation of thermogravimetric data. Nature 1965;207:290-1.
- Khawam A, Flanagan DR. Solid-state kinetic models: Basics and mathematical fundamentals. J PhysChem B 2006;110:17315-28.


