- *Corresponding Author:
- B. A. Bhongade
Department of Pharmaceutical Chemistry, RAK College of Pharmaceutical Sciences, RAK Medical and Health Sciences University, Ras Al Khaimah 11172, United Arab Emirates
E-mail: bhoomendra@rakmhsu.ac.ae
| Date of Received | 10 December 2019 |
| Date of Revision | 07 February 2021 |
| Date of Acceptance | 28 March 2021 |
| Indian J Pharm Sci 2021; 83(3):430-436 |
This is an open access article distributed under the terms of the Creative Commons Attribution-NonCommercial-ShareAlike 3.0 License, which allows others to remix, tweak, and build upon the work non-commercially, as long as the author is credited and the new creations are licensed under the identical terms
Abstract
Levofloxacin is a synthetic fluoroquinolone antibiotic available in different dosage forms for the treatment of various bacterial infections. Here in, we report the validated diffuse reflectance infrared Fourier transform spectroscopic method for quantitative analysis of levofloxacin in the solid dosage forms. This method offers the advantage of being eco-friendly that is applied for solid state samples. Appropriate quantities of levofloxacin and dry potassium bromide were mixed to get the desired concentration of samples for Fourier transform infrared spectroscopic analysis using a diffuse reflectance sampling interface. The peak in the Fourier transform infrared spectrum around 1724 cm-1 was observed for the carbonyl group of levofloxacin. The calibration curve was plotted for the area under the curve of carbonyl peak against the concentration of calibration standards. A linear calibration curve with a correlation coefficient of 0.999 was obtained in the range of 0.3-1.8 % w/w of levofloxacin. The calibration curve method was linear, precise and accurate as per guidelines. The method employed for quantification of levofloxacin in three marketed tablet dosage forms and laboratory physical mixture yielded a mean recovery of 101.32 and 98.11 percent by weight, respectively. Overall, the precision, accuracy and reproducibility of the proposed diffuse reflectance infrared Fourier transform spectroscopy method make it appropriate for quantitative analysis of levofloxacin in solid dosage forms.
Keywords
Levofloxacin, Fourier transform infrared spectroscopy, diffuse reflectance infrared fourier transform spectroscopy, validation, quantification, analysis
The role of pharmaceutical analysis in the drug developmentand manufacturing is mainly focused on the identification and quantification of drugs and organic impurities. The most important aspect of quality control of pharmaceuticals includes the availability of robust, time and cost effective established analytical methods. Infrared (IR) spectroscopy is a widely recommended official method for the identification of pharmaceuticals. The use of IR and near infrared (NIR) spectroscopy for the identification of pharmaceuticals almost eliminated the use of classical identification techniques such as color and chemical tests [1,2]. Many chromatographic methods are used for the quantification of bulk drugs and pharmaceuticals of which high performance liquid chromatography (HPLC) is a widely recommended official methods [3]. In about 45 % of the monographs in the twenty-ninth United States Pharmacopoeia (USP), HPLC is recommended for the analysis of small organic molecules in bulk materials. The other official methods recommended for the analysis of pharmaceuticals include gas chromatography, thin layer chromatography, ultraviolet spectrophotometry and electroanalytical techniques [4].
Diffuse reflectance infrared Fourier transform (DRIFT) spectroscopy is a relatively newer IR technique that has shown potential for the quantification of solid samples [5,6]. DRIFT spectroscopic methodology has the advantages of being the least complex procedures involving simple sample preparation, eco-friendly solid state analysis and do not need the drug extraction procedure. Analysis of various drug samples using the DRIFT spectroscopic method is reported in the literature [7-15]. The USP describes the IR method for quantification of simethicone in bulk and pharmaceutical formulations [16].
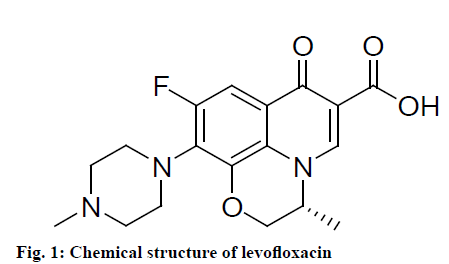
Chemically, levofloxacin is the S enantiomer (Lisomer) of ofloxacin and has approximately twice the potency and substantially less toxicity than ofloxacin (fig. 1) [17]. Levofloxacin acts as an antibacterial against a wide range of bacterial pathogens. It inhibits deoxyribonucleic acid (DNA) gyrase in susceptible organisms resulting in the degradation of chromosomal DNA and interference with cell division and gene expressions [18]. Various analytical methods are reported for the estimation of levofloxacin in pharmaceuticals such as UV spectrophotometric [19-22], spectrofluorometric [23], HPLC [24-26], reverse phase (RP) HPLC [27], Reverse Phase ultra-performance liquid chromatography (RP-UPLC) [28], high-performance thin layer chromatography (HPTLC) [29] and voltammetry [30]. For the quantification of levofloxacin in bulk and pharmaceutical dosage forms, the liquid chromatography method is described in USP [31]. To the best of our knowledge, the Fourier transform infrared spectroscopy (FTIR) method using diffuse reflectance sampling technique for the quantitative analysis of levofloxacin in bulk or tablet dosage form was not available in the literature. Therefore, the objective of the present study was to develop and validate the solid state quantification method for levofloxacin in tablet dosage forms employing the DRIFT spectroscopic method.
Materials and Methods
Chemicals and reagents:
Julphar Gulf Pharmaceutical Industries, Ras Al Khaimah provided the gift sample of levofloxacin and analytical grade potassium bromide (KBr) procured from the HiMedia, India.
FTIR Instrumentation:
All the diffuse reflectance spectra were collected using a Cary 630 FTIR spectrophotometer (Agilent Technologies, USA) equipped with a diffuse reflectance sampling interface (650-4000 cm-1, 32 scans, resolution of 8 cm-1 and background spectrum of gold). Data collection and analysis were carried out using Cary 630 MicroLab PC and Agilent Resolution Pro software, respectively.
Calibration curve:
The calibration curve was plotted using six different solid state calibration standards of levofloxacin with the concentration in the range of 0.3 to 1.8 % w/w. Around 1000 mg calibration standards were prepared by diluting pure levofloxacin with dry KBr, followed by trituration using mortar and pastel. The area under the curve (AUC) for the peak around 1724 cm-1 for each standard in the replicate of six was recorded. The calibration curve was prepared by plotting the average AUC of six analyses vs. the concentration of calibration standard. StatFlex version 6.0 software for Windows was used (Artech, Osaka, Japan, http://www.statflex. net).
Method validation:
The proposed diffuse reflectance infrared Fourier transform spectroscopy (DRIFTS) method for quantification of levofloxacin was validated for linearity, precision and accuracy [32-34].
Linearity:
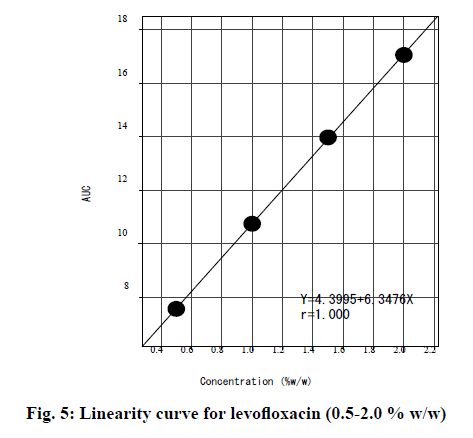
Samples of levofloxacin in the range of 0.5-2.0 % w/w in three replicates as described in the calibration curve were analyzed to check the linearity of the calibration curve.
Precision:
Method precision was assessed by intraday and interday repeatability. Three samples of 1.2 % w/w of levofloxacin were analyzed three consecutive times in the same day (d 1). For the same samples, analyses were repeated on d 3 (interday) to check the intermediate precision of the assay method.
Accuracy:
A standard addition method for the recovery of pure drug from the excipients at three different levels (80, 100 and 120 % by weight) was used to check the accuracy of the assay method. Pure levofloxacin equivalent to 80, 100 and 120 % by weight of label claim were added to pre analyzed tablet powder (Brand 1). Samples appropriately 1.2 % w/w of levofloxacin in six replicates were prepared by dilution with dry KBr and analyzed.
Analysis of physical mixture:
A physical mixture of levofloxacin was prepared in the laboratory using the composition as shown in Table 1. Six samples of a physical mixture containing approximately 1.2 % w/w levofloxacin were analyzed in three replicates.
| Composition | Quantity (mg) |
|---|---|
| Levofloxacin | 500 |
| Lactose | 150 |
| Microcrystalline cellulose (MCC) | 75 |
| Sodium starch glycolate | 25 |
| Starch | 25 |
| (Hydroxypropyl) methyl cellulose (HPMC) | 10 |
Table 1: Composition of the Physical Mixture
Analysis of marketed tablet formulations:
For the quantification of levofloxacin in tablet formulation, three brands (Label claim 500 mg) available in the pharmacy were used. After determining the average weight, ten tablets were finely powdered. Six (around 1000 mg) samples containing approximate 1.2 % w/w levofloxacin were prepared by diluting the appropriate quantity of levofloxacin with dry KBr. All the samples were analyzed in three replicates and the percent recovery of levofloxacin was calculated using the following formula.
Percent recovery=(Ru/Rs)×(Cs/Cu)×Avg weight/Label claim×100
Where, Ru=AUC for sample; Rs=AUC for standard; Cu=nominal concentration of sample (% w/w); Cs=concentration of USP levofloxacin (% w/w); Avg weight=Average weight of tablet dosage form.
Results and Discussion
DRIFT spectroscopy is a well-known technique for the characterization and quantification of solid state samples. Since the organic compounds exhibit intense adsorptions peaks in the 4000-650 cm-1 region of the IR spectrum, it is possible to quantitatively analyze them using DRIFT spectroscopy.
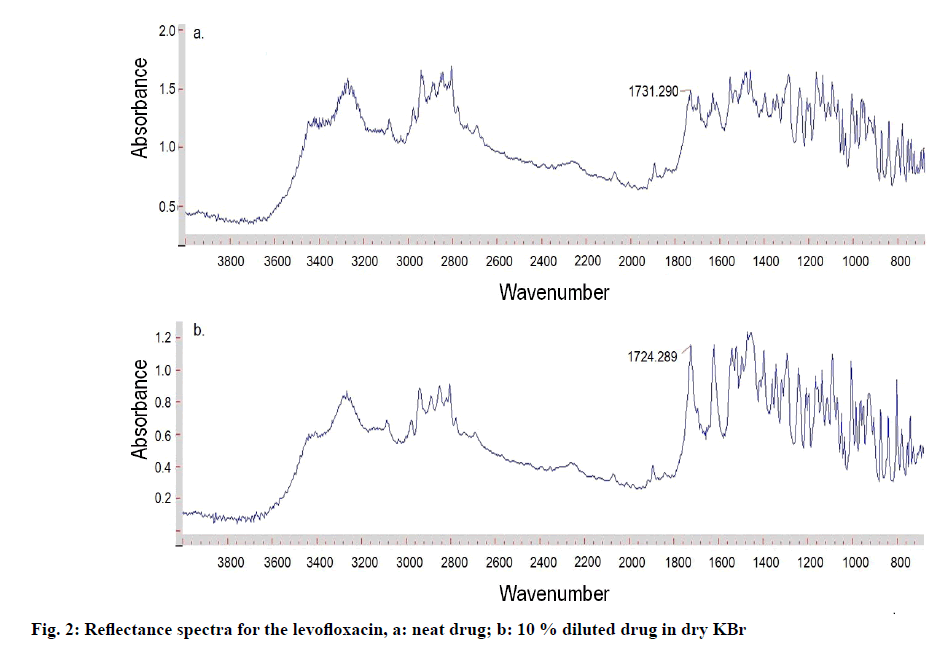
The reflectance spectrum for neat sample of levofloxacin exhibited absorbance bands in the range of 3272 (NHstr), 3082, 2974, 2936 (CHstr), 2888, 2850, 2803, 2262, 2070, 1891, 1735, 1731 (C=Ostr), 1696, 1629, 1551, 1544, 1486, 1305, 1288, 1241, 1193, 1007, 953, 903, 873, 799, 779, 695 cm−1 (fig. 2a). The most prominent absorbance band corresponding to the carbonyl group in the neat levofloxacin was around 1731 cm-1, while that of diluted samples in dry KBr was within 2.0 absorbance units around 1724 cm-1. The involvement of a range of different path lengths within the sample in reflectance spectroscopy generally results in the enhanced intensities of the weaker bands relative to that of the stronger bands. Dilution with the non-absorbing matrix (such as KBr) ensures all the absorptions are weak, thus minimizes this distortion of band intensities. However, in the spectrum of the neat powder, the stronger bands have approximately the same intensities and their shapes are distorted by the contribution of surface reflection [35], whereas the weaker bands appear similar in both spectra. The representative reflectance spectrum for 10 % w/w levofloxacin in dry KBr is shown in fig. 2b.
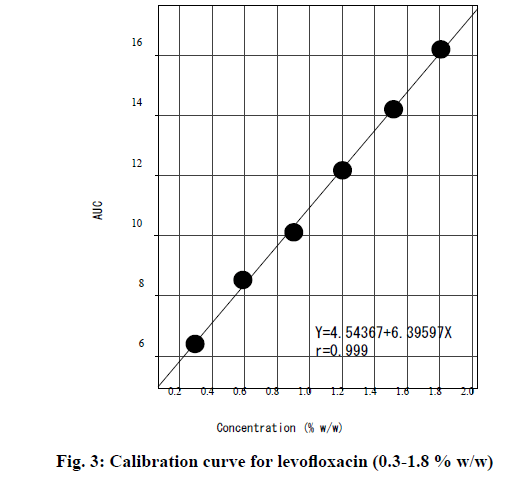
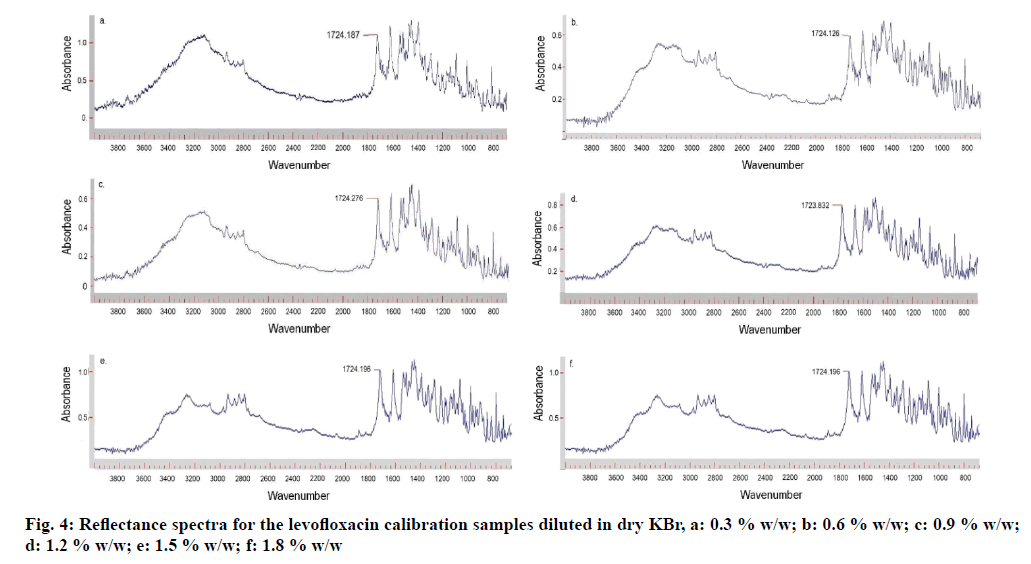
The calibration curve was prepared by plotting the mean AUC obtained for the carbonyl peak versus nominal concentrations (0.3-1.8 % w/w) is shown in fig. 3. The reflectance spectra for the levofloxacin calibration samples diluted with dry KBr are depicted in fig. 4a-f. The mean AUC was calculated for each concentration and the data is shown in Table 2. The calibration curve is described by the equation y=a+bx, where “y” represents peak area and “x” represents the concentration of levofloxacin. The regression equation was found to be “y=4.54367+6.3959x” with a coefficient of correlation of 0.999 for the calibration curve.
| Nominal Concentration (% w/w) | AUC | SD | RSD (%) |
|---|---|---|---|
| 0.295 | 6.402 | 0.091 | 1.42 |
| 0.589 | 8.530 | 0.154 | 1.81 |
| 0.902 | 10.114 | 0.142 | 1.40 |
| 1.202 | 12.175 | 0.230 | 1.89 |
| 1.516 | 14.207 | 0.162 | 1.14 |
| 1.807 | 16.199 | 0.251 | 1.55 |
| Linear regression data | |||
| Statistical Parameters | Values | ||
| Concentration range | 0.3-1.8 % w/w | ||
| Regression equation | y= 6.3959x+4.54367 | ||
| Correlation coefficient | 0.999 | ||
Table 2: Calibration Curve and Linear Regression Data For Levofloxacin (N=6)
The linearity curve was prepared by plotting the mean AUC obtained for the carbonyl peak (around 1724 cm-1) for the diluted levofloxacin samples (0.5 to 2.0 % w/w in dry KBr) verses nominal concentrations (fig. 5). The regression equation for the linearity curve was “y=4.3995+6.3476x” with a coefficient of correlation of 1.0. This supports that in the concentration range of 0.5-2.0 % w/w the proposed method was linear.
The coefficient of variation (percentage relative standard deviation (% RSD)) is used to express the precision, whereas the mean of standard deviation (SD) is used for the expression of the accuracy of an analytical method. The intraday and inter day precision study data for levofloxacin are shown in Table 3. For 1st d precision studies, the RSD (%) values for the three samples were observed in the range of 1.37-1.67 while for 3rd d precision studies, the range was 1.47-1.84. The intraday and inter day precision results were found to be satisfactory. The percentage RSD for the method was within the limit. There was no statistically significant difference between the results of 1st d and 3rd d analysis (t=0.057359, p=0.596).
| Conc. (1.2 % w/v) | 1st d | 3rd d | |||||
|---|---|---|---|---|---|---|---|
| AUC | SD | % RSD | AUC | SD | % RSD | p Value* | |
| 1 | 12.072 | 0.20 | 1.67 | 12.04 | 0.18 | 1.47 | 0.596 (t=0.57359) |
| 2 | 12.482 | 0.20 | 1.61 | 12.29 | 0.23 | 1.84 | |
| 3 | 12.456 | 0.17 | 1.37 | 12.39 | 0.21 | 1.66 | |
| Average | 12.336 | 0.19 | 1.55 | 12.240 | 0.20 | 1.65 | |
*Two tailed t test
Table 3: Intraday and Inter Day Precision Study Data for Levofloxacin (N=3)
The results of accuracy studies that were performed by spiking 80, 100 and 120 % of test concentration on pre analyzed tablet dosage formulation (Brand 1) are shown in Table 4. Based on the results of accuracy studies, the proposed method was found to be accurate with the average recovery of levofloxacin in the acceptable range (103.98 % w/w).
| Label claim (mg) | Amount of drug added (mg) | Total | Amount recovered (mg) |
Percentage Recovery | SD | RSD (%) |
|---|---|---|---|---|---|---|
| 500 | 400 | 900 | 954.81 | 106.09 | 3.36 | 3.17 |
| 500 | 500 | 1000 | 999.90 | 99.9 | 4.70 | 4.70 |
| 500 | 600 | 1100 | 1165.67 | 105.97 | 3.75 | 3.54 |
| Average | 103.98 | 3.539 | 3.404 | |||
Table 4: Recovery Data of Levofloxacin in Tablet Dosage form (Brand 1) (N=3)
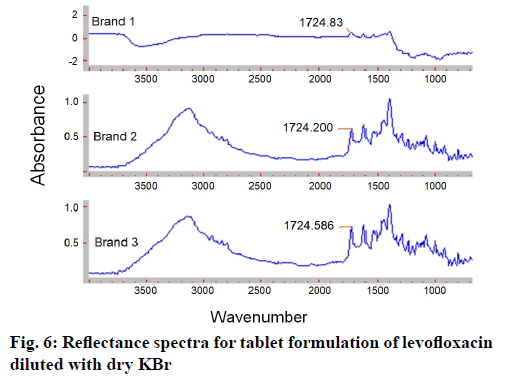
The proposed method was intended to use for the quantification of levofloxacin in the solid dosage forms. When the excipients and the composition of the marketed formulation are not known, the laboratory physical mixture prepared from the commonly used excipient for tablet formulation may help in studying the interaction of excipients in the analysis. Hence, the proposed method was employed for the analysis of levofloxacin in the three different brands of marketed tablet formulations and the laboratory physical mixture (fig. 6). The average recovery of the levofloxacin in laboratory physical mixture was 98.11 % w/w (95 % confidence interval (CI)=94.8623, 101.3577), whereas that for the three pharmaceutical tablet formulations was in the range of 98.23-105.4 % w/w (M=101.32; 95 % CI=97.8958, 104.7442) of the label claim (Table 5).
| Formulation | Label claim (mg) | Amount found (mg) | Recovery (%) | SD | RSD (%) |
|---|---|---|---|---|---|
| Laboratory physical mixture | 500 | 490.55 | 98.11 | 2.87 | 2.92 |
| Brand 1 | 500 | 527.0 | 105.4 | 2.46 | 2.33 |
| Brand 2 | 500 | 501.65 | 100.33 | 2.80 | 2.79 |
| Brand 3 | 500 | 491.15 | 98.23 | 3.82 | 3.89 |
Table 5: Analysis of Levofloxacin in Physical Mixture and Tablet Dosage Form (N=6)
Levofloxacin from the three marketed formulations was recovered within the good agreement of the label claim and was within the acceptable limits of USP (not less than 90.0 % and not more than 110.0 % of the stated amount of the levofloxacin). The results of recovery studies supported that that there was no interference of excipients in the analysis, hence the proposed method may have the potential to serve for in house quality control of levofloxacin.
Analytical chemistry plays a significant role in the quality control and development of pharmaceuticals including assay method and validation. A validated analytical method is an official requirement of the drug approval process by various regulatory authorities and also it can be used for in house quality control. The proposed solid state validated DRIFTS method was precise, accurate with significant recovery of levofloxacin in tablet dosage formulation. The method may be employed for the quantification of levofloxacin in bulk and in solid dosage forms.
Acknowledgements:
Authors thank Dr. S. Gurumadhva Rao, President, Ras Al Khaimah Medical and Health Sciences University (RAKMHSU), Dr. Padma GM Rao, Dean, RAK College of Pharmaceutical Sciences (RAKCOPS) for their encouragement and support. The authors acknowledge RAKMHSU Research & Ethics Committee for the approval of the research project (RAKMHSU-REC-5- 2016-PG-P). The authors are also grateful to Julphar- Gulf Pharmaceutical Industries, Ras Al Khaimah, UAE for providing the gift sample of levofloxacin.
Conflict of interest:
The authors declare no conflicts of interest.
References
- Anderton CL. Vibrational spectroscopy in pharmaceutical analysis. In: Lee DC, Webb ML, editors. Pharmaceutical Analysis, Blackwell Publishing, Oxford; 2003. p. 203-40.
- Ciurczak EW, Drennen III JK, editors. Pharmaceutical and medical application of near-infrared spectroscopy, Marcel Dekker, New York; 2002.
- Misiuk W. The role of assay methods in characterizing the quality of bulk pharmaceuticals. J Pharm Bioallied Sci 2010;2:88-92.
- United States Pharmacopoeia. USP Convention Inc. Rockville, Maryland, USA; 2006.
- Kubelka P, Munk F. Ein beitrag zur optik der farbanstriche (Contribution to the optic of paint). J Tech Phys 1931;12:593-601.
- Christy AA, Kvalheim OM, Velapoldi RA. Quantitative analysis in diffuse reflectance spectrometry: a modified Kubelka-Munk equation. Vib Spectrosc 1995;9(1):19-27.
- Hrebicik M, Budinova G, Godarska T, Vlacil D, Vogenseh SB, Volka K. Diffuse-reflectance infrared Fourier transform spectroscopy: new technique of sample preparation. J Mol Struct 1997;410:527-30.
- Mazurek S, Szostak R. Quantitative analysis of thiamine hydrochloride in tablets-Comparison of infrared attenuated total reflection, diffuse reflectance infrared and Raman spectroscopy. Vib Spectrosc 2012;62:10-6.
- Boroumand F, Van Den Bergh H, Moser JE. Quantitative diffuse reflectance and diffuse transmittance infrared spectroscopy of surface-derivatized silica powders. Anal Chem 1994;66(14):2260-6.
- Fuller MP, Griffiths PR. Diffuse reflectance measurements by infrared Fourier transform spectrometry. Anal Chem 1978;50(13):1906-10.
- Hartauer KJ, Miller ES, Guillory JK. Diffuse reflectance infrared Fourier transform spectroscopy for the quantitative analysis of mixtures of polymorphs. Int J Pharm 1992;85(1):163-74.
- Baucells M, Ferrer N, Gomez P, Lacort G, Roura M. Quantitative analysis of caffeine applied to pharmaceutical industry. J Mol Struct 1993;294:219-22.
- Park M, Yoon H, Kim K, Cho J. Quantitative analysis by diffuse reflectance infrared Fourier transform and linear stepwise multiple regression analysis I-Simultaneous quantitation of ethenzamide, isopropylantipyrine, caffeine and allylisopropylacetylurea in tablet by DRIFT and linear stepwise multiple regression analysis. Arch Pharm Res 1988;11(2):99-113.
- United States Pharmacopeia. United States Pharmacopeial Convention, USP29-NF24, Rockville, MD, United States; 1882. p. 1964.
- Bhongade B, Talath S, Dhaneshwar S. A validated method for the quantitation of ciprofloxacin hydrochloride using diffuse reflectance infrared fourier transform spectroscopy. Int J Spectrosc; 2014.
- Bhongade BA, Dhaneshwar SR. Diffuse reflectance infrared fourier transform spectroscopy (DRIFTS) application in pharmaceutical analysis: Method for quantification of ranolazine in tablet dosage form. Vib Spectrosc 2017;93:52-6.
- Anderson VR, Perry CM. Levofloxacin: a review of its use as a high dose, short course treatment for bacterial infection. Drugs 2008;68(4):535-65.
- Davis R, Bryson HM. Levofloxacin. a review of its antibacterial activity, pharmacokinetics and therapeutic efficacy. Drugs 1994;47(4):677-700.
- Manimala M, Ravindra Reddy K, Hepcykala Rani D. Development and validation of novel UV spectrophotometric determination of levofloxacin hemi hydrate in bulk and pharmaceutical dosage forms. Der Pharm Chem 2013;5(1):47-50.
- Rahar S, Dogra S, Panchru D, Singh P, Shah G. Development and validation of UV-visible spectroscopic method for the estimation of levofloxacin hemihydrate in bulk and marketed formulation. Int J Inst Pharm Life Sci 2011;1(2):57-69.
- Desai VN, Afieroho OE, Dagunduro BO, Okonkwo TJ, Ndu CC. A simple UV spectrophotometric method for the determination of levofloxacin in dosage formulations. Trop J Pharm Res 2011;10(1):75-9.
- Shirkhedkar AA, Surana SJ. Quantitative determination of levofloxacin hemihydrate in bulk and tablets by UV-spectrophotometry and first order derivative methods. Pak J Pharm Sci 2009;22(3):301-2.
- Gonzalez JA, Mochon MC, de la Rosa FJ. Spectrofluorimetric determination of levofloxacin in tablets, human urine and serum. Talanta 2000;52(6):1149-56.
- Hurtado FK, Nogueira DR, Bortolini F, da Silva LM, Zimmermann E, e Souza MJ, et al. Determination of levofloxacin in a pharmaceutical injectable formulation by using HPLC and UV spectrophotometric methods. J Liq Chromatogr Relat Technol 2007;30(13):1981-9.
- Czyrski A, Szalek E. An HPLC method for levofloxacin determination and its application in biomedical analysis. J Anal Chem 2016;71(8):840-3.
- Naveed S, Sultana N, Arayne MS, Dilshad H. A new HPLC method for the assay of levofloxacin and its application in drug-metal interaction studies. J Sci Innov Res 2014;3(1):91-6.
- Kumar T, Chitra A, Amrithraj V, Kumar N. New RP-HPLC method development and validation for estimation of levofloxacin in tablet dosage form. J Glob Trends Pharm Sci 2011;2(3):264-76.
- Gupta H, Aqil M, Khar RK, Ali A, Chander P. A single reversed-phase UPLC method for quantification of levofloxacin in aqueous humour and pharmaceutical dosage formsJ Chromatogr Sci 2010;48(6):484-90.
- Meyyanathan SN, Ramasarma GV, Suresh B. Analysis of levofloxacin in pharmaceutical preparations by high performance thin layer chromatography. J Sep Sci 2003;26(18):1698-700.
- Mittal SK, Sharma R, Narang P. A Green Electroanalytical Method for the Determination of Levofloxacin by Ion-Pair Formation with Picric Acid. J Anal Pharm Res 2017;4(5):00116.
- Levofloxacin, United State Pharmacopoeia (USP) 36-NF 31, U.S. Pharmacopeia Convention: Rockville, MD; 2013:4099.
- Guideline on the use of near infrared spectroscopy by the pharmaceutical industry and the data requirements for new submissions and variations. European medicines agency EMEA/CHMP/CVMP/QWP/17760/2009 Rev2; 2014:1-28.
- Development and Submission of Near Infrared Analytical Procedures Guidance for Industry. U.S. Department of Health and Human Services Food and Drug Administration Center for Drug Evaluation and Research (CDER); 2015.
- ICH Quality Guidelines Q2A, Text on Validation of Analytical Procedures, Q2B, Validation of Analytical Procedures: Methodology, Geneva, Switzerland; 1996.
- Spragg R. Reflection measurements in IR spectroscopy. Perkin Elmer, Inc., MA, USA; 2013.
