- *Corresponding Author:
- F. R. Gallo, G. Pagliuca
Department of Therapeutic Research and Medicines Evaluation, Istituto Superiore di Sanità, Viale Regina Elena 299, 00161 Rome
E-mail: giordana.pagliuca@uniroma1.it
| Date of Submission | 16 June 2014 |
| Date of Revision | 30 January 2015 |
| Date of Acceptance | 11 September 2015 |
| Indian J Pharm Sci 2015;77(5):530-535 |
This is an open access article distributed under the terms of the Creative Commons Attribution-NonCommercial-ShareAlike 3.0 License, which allows others to remix, tweak, and build upon the work non-commercially, as long as the author is credited and the new creations are licensed under the identical terms.
Abstract
Natural substances present in herbal preparations should be carefully used because they can give toxic or therapeutic effects despite of their amount or the way of administration. The safety of products of vegetable origin must be assessed before commercialisation by monitoring the active ingredients and their metabolites. This study was therefore designed to identify and quantify arbutin and its metabolite hydroquinone, naturally present in Arctostaphylos uva-ursi (L.) Spreng plant in rat plasma, after an acute and subacute administration of aqueous arbutin solution in Wistar rats. For this purpose a reversed-phase high-performance liquid chromatography coupled with photodiode array detection was developed to assess the pharmacokinetic of arbutin and hydroquinone in plasma of female rats treated with aqueous arbutin solutions. The detection (arbutin: 0.0617 µg/ml and hydroquinone 0.0120 µg/ml) and quantification (arbutin: 0.2060 µg/ml and hydroquinone: 0.0400 µg/ml) limits were determined. At the arbutin concentration level of 10.7 µg/ml repeatability was 13.33% and its recovery 93.4±6.93%, while at the hydroquinone concentration level of 10.6 µg/ml repeatability was 11.66% and its recovery 92.9±7.75%. Furthermore the method was fully validated and the obtained data indicate that the new method provides good performances.
Keywords
Arbutin, hydroquinone, HPLC-DAD validation, rat plasma extraction, plasma, pharmacokinetics
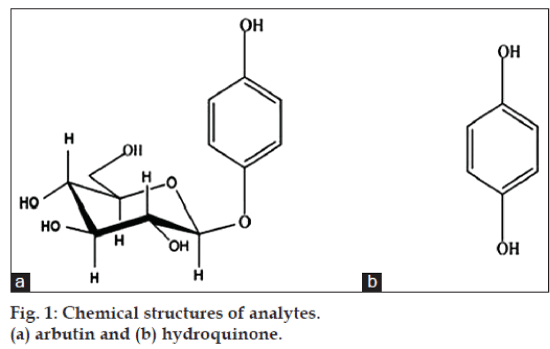
Arbutin, (4-hydroxyphenyl-β-D-glucopyranoside), the β-glucoside of hydroquinone (fig. 1), is present in several plants [1] and has mainly an antiseptic action on urinary tract [2]. Arbutin is the main constituent of Arctostaphylos uva-ursi (L.) Spreng (Ericaceae), a medicinal plant known as bearberry, and in the market many phytotherapeutic products, made with its leaves, are present and are widely used to treat a variety of urinary disorders, such as urinary tract infections, inflammatory conditions of the efferent urinary tract, cystitis, urethritis, diuresis, lithuria, dysuria, acidic urine, pyelonephritis, kidney stones [3-5].
Arbutin is generally present in plants in combination with methylarbutin, especially in those belonging to the Ericaceae family [2]. It has been observed that in physiological conditions, after oral ingestion arbutin is absorbed by the gastrointestinal tract, it reaches the liver and then it is hydrolyzed to hydroquinone, which is finally conjugated to sulphuric and glucuronic acid by phase II enzymatic system.
The 64-75% of orally ingested arbutin is excreted in urine as conjugated hydroquinone. In case of urinary tract infection, pathogenic bacteria, such as Escherichia coli, can break down the urea. As a consequence urine becomes alkaline and this pH change causes the release of the free form hydroquinone which possesses antibacterial activity [6-9].
In cosmetics hydroquinone has been used as whitening agent, and recently it has been included by the European Commission in the Annex II of substances, which must not be part of the composition of cosmetic products because of their potential toxicity [10]. The use of herbal products as dietary supplements is growing nowadays. Illegal products can be confused with authorized ones so that uncontrolled intake of these compounds can cause a potential risk to human health. There is a large number of non licensed products which have been retrieved from the market because they could pose a clear risk to public health [10]. The uncontrolled use of bearberry in herbal free sale products can be dangerous since hydroquinone can cause liver and kidney toxicity after chronic oral administration [11-13]. For this purpose, research was carried out to quantify in female rat plasma the main active ingredients of bearberry leaves and to assess arbutin and hydroquinone pharmacokinetic after administration of acute and subacute aqueous arbutin solutions. Although several methods for the extraction and quantification of these compounds from plasma have been reported, data on their validation are insufficient [14-16].
For this reason the aim of our study was to develop and validate an extraction procedure and HPLC-DAD method, according to international guidelines, in order to determine arbutin and its metabolite in rat plasma [17-21].
Materials and Methods
All chemical standards were of analytical grade. Arbutin (AR, purity≥96%) and hydroquinone (HQ, purity≥99.0%) were obtained from Sigma-Aldrich (Milan, Italy); p-chlorophenol was purchased from Acros organics (purity 99%; Geel, Belgium) and was used as internal standard (IS). Monohydrate citric acid (Phargam s.r.l., Varese, Italy purity 99.9%), disodium hydrogen phosphate (Rieldel-deHaën purity 99%, Seelze, Germany), sodium hydroxide (J. T. Baker, Deventer Holland), ascorbic acid (Aldrich Germany, purity≥99%) were analytical grade reagents. Ethyl acetate (Panreac, Barcelona Espana), methanol and acetonitrile for HPLC were purchased from Aldrich (Milan, Italy). Isobutanol (Lab-Scan, Dublin, Ireland) and n-propanol (Carlo Erba, Milan, Italy) were analytical grade reagents. Distilled water (Milli-Q gradient, Millipore, Vimidrone, Italy), for the mobile phase, was acidified with phosphoric acid (BDH Prolabo, England, purity≥85%). Tubes containing EDTA (BD Vacutainer System; UK) were used to collect rat blood samples. Supelco Visiprep and Supelco Visidry evaporation chamber (Sigma Aldrich, Milan, Italy) were used to evaporate extracted samples.
Other laboratory equipment included, calibrated automatic pipettes from Gilson (Villiers-le-Bel, France), Hettich centrifuge Mikro 22 R (Tuttlingen, Germany) with rotor Hettich centrifuge 1015 speed max 6000 rpm (12×35 g). The HPLC system, purchased from Perkin Elmer (Waltham, MA, USA) consisted of a pump (Biocompatible binary 250), a column oven (series 200), a vacuum degasser (series 200), an injector with a 20 μl sample loop (Rheodyne 7161), and a photodiode array detector (series 235C). The data were processed on a Perkin Elmer TotalChrom workstation system. The HPLC separation was performed on a Symmetry RP18 Waters column (250×4.6 mm i.d.; 5 μm; Milford, MA, USA) equipped with a Waters Atlantis guard column (20×3.9 mm i.d.; 5 μm).
Preparation of standard stock solutions
Stock standard solutions of arbutin and hydroquinone were prepared separately by dissolving a weighted amount of each reference standard in methanol, to obtain a final concentration of 10 mg/ml, and were stored at -20° until analysis.
Chromatographic conditions
The HPLC analysis was performed on reversed-phase high-performance liquid chromatographic system. The substances were eluted with a mobile phase consisting of water at pH 3 with phosphoric acid (solvent A) and acetonitrile (solvent B) through a binary elution gradient as shown in Table 1. The flow-rate was 1 ml/min, and arbutin and hydroquinone were detected at the wavelength of 230 nm, the column was kept at 25°.
| Time (min) | A (%) | B (%) |
|---|---|---|
| 0 | 95 | 5 |
| 10 | 80 | 20 |
| 35 | 10 | 90 |
Change of mobile phase composition during the elution
Table 1: Elution gradient
Calibration curves
Arbutin and hydroquinone solutions (10 mg/ml) were diluted with distilled water to obtain five working standard solutions with concentration ranging from 1 to 20 μg/ml. The solutions were injected using a 20 μl fixed loop system and chromatograms were recorded. A complete calibration curve was generated with each run for each of two substances. Each point of the curve was replicated six times, for each of two substances. Calibration curves were constructed by plotting average peak areas versus concentrations and regression equations were computed for both the substances.
Rat pharmacokinetic study
The pharmacokinetic study was performed on 100 female Wistar rats obtained from Charles River, Italy (200 g). The animals were housed and treated, by the Service for Biotechnology and Animal Welfare of Istituto Superiore di Sanità. According to the European and Italian Legislation the research protocol was approved on the 24th November 2004 by the Italian Ministry of Health with the decree number 133/2004-B. Rats were divided into 10 groups of 5 animals each, and housed in metabolic cages. Rats were fed a standard diet (Mucedola, Milan, Italy) and water was administered ad libitum. The animal facility temperature was about 22° and light-dark cycle was 12 h.
Procedure of arbutin administration to rats
Two aqueous arbutin solutions, 0.3 and 17 mg/ml, were prepared, respectively for the subacute toxicity and the acute toxicity studies. Fifty animals were used in the subacute toxicity study, and the remaining 50 rats in the acute toxicity study. 50 rats were used in the subacute toxicity study; 45 of them were administered twice by gavage 3 ml of 0.3 mg/ml aqueous arbutin solution and the remaining 5 were used as control and were administered always by gavage a blank solution. The other 50 rats were used in acute toxicity study; 45 of them were administered twice by gavage 3 ml of 17 mg/ml aqueous arbutin solution and the remaining 5 were used as control and were administered always by gavage a blank solution. The daily dose for each rat was 9 mg/kg for subacute toxicity study and 510 mg/kg for the acute toxicity study. The times for the sampling are shown in pharmacokinetic study section.
Plasma sample preparation
The rat blood samples (1 ml) were obtained from posterior orbital venous plexus and were collected into tubes containing ethylenediaminetetraacetic acid (EDTA). The blood samples were then centrifuged at 12 000 rpm for 5 min to separate plasma. The plasma was collected and stored at -20°.
Preparation of buffer solution
Buffer solution was prepared with monohydrate citric acid and disodium hydrogen phosphate (10 mM) and pH was adjusted to 5 adding 2 N sodium hydroxide. L-ascorbic acid solution (0.5 mg/ml), used as antioxidant agent, was dissolved in 100 ml of buffer solution. The buffer solution was used to prepare the Internal Standard work solution.
Preparation of standard solution
Standard work solution of p-chlorophenol (IS) was prepared dissolving a weighted amount of reference standard in methanol, to obtain a final concentration of 10 mg/ml, and was stored at -20° until analysis. An internal standard working solution (5 μg/ml) was prepared by diluting methanol p-chlorophenol stock solution (IS) with the L-ascorbic acid solution (0.5 mg/ml). This solution was used to prepare the plasma samples. A methanol solution, constituted of arbutin and hydroquinone (10 mg/ml), was diluted with distilled water at concentration of 0.1 mg/ml and then 50 μl were added to 450 μl blank plasma to obtain 500 μl of plasma.
Extraction procedure from plasma
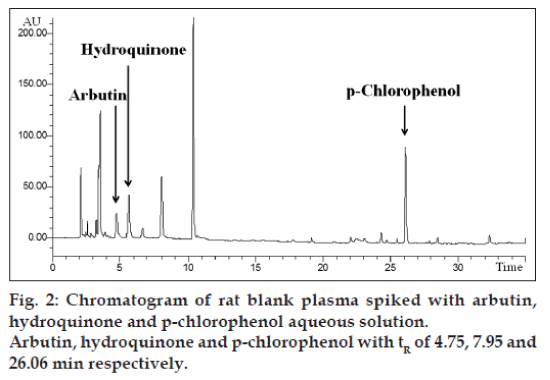
The extraction procedure was a simple liquid-liquid extraction (LLE) with protein precipitation (PPT). The use of both PPT and LLE gives a clean sample. To identify the best extraction solution, several organic mixing solvents, described in (Table 2), were investigated. The highest recovery was obtained with an organic solvent mixture constituted by ethyl acetate, isobutanol, propyl alcohol (60:30:10, v/v/v). 500 μl of plasma were added to 500 μl of internal standard solution (5 μg/ml); the mixture was vortex-mixed for 2 min and then 2 ml of organic phase ethyl acetate, isobutanol, propyl alcohol (60:30:10; v/v/v) were added. The mixture was mechanical shaken for 2 min and then centrifuged for ten minutes at 10 000 rpm (6000 rcf) at 20°. The extraction procedure was repeated twice and the two upper organic phases were collected and evaporated to dryness. For the evaporation, a chamber under nitrogen gas at room temperature under vacuous was used. The dried residue was dissolved in 250 μl of a mixture of acetonitrile:water at pH 3 (5:95 v/v) and then one aliquot (20 μl) was used for HPLC analysis. In the same way the plasma spiked was processed to assess the recovery (fig. 2).
| Ethyl acetate (%) | Isobutanol (%) | n‑propanol (%) |
|---|---|---|
| 100 | 0 | 0 |
| 90 | 10 | 0 |
| 80 | 20 | 0 |
| 70 | 30 | 0 |
| 60 | 40 | 0 |
| 60 | 10 | 30 |
Different solvent mixture ratios
Table 2: Organic mixing solvents at different ratios
Method validation
The method was validated according to the international guidelines for analytical methods [17-21]. The parameters evaluated were identity, specificity, sensibility, linearity, limits of determination (LOD) and quantification (LOQ), trueness and precision as repeatability.
Pharmacokinetic study
The new validated method was used to detect the concentration of both arbutin and hydroquinone in rat plasma, after acute and subacute administration of aqueous arbutin solution (17 and 0.3 mg/ml, respectively). Each plasma sample was collected at different times: 0, 0.5, 1, 2, 4, 8, 16, 24, 36 h and then was extracted according to the new developed and validated procedure. Sample concentrations of arbutin and hydroquinone in rat plasma were calculated from the formula:

Where, Areasample=peak area of sample; AreaSTD=peak area of standard; CSTD=arbutin or hydroquinone standard concentration; Areasample STDi=peak area of internal standard for sample; AreaSTD STDi=peak area of internal standard for standard; DF=dilution factor.
Results and Discussion
The confirmation of identity for arbutin and hydroquinone was obtained by comparing the retention times of the calibration solutions with those of test samples. In all cases the retention times were 4.74 min for arbutin, 7.95 min for hydroquinone and 26.06 min for p-clorophenol (fig. 2). In addition, to guarantee the identity and specificity of the analytical method, the diode array detection was used to compare the spectrum of arbutin and hydroquinone in aqueous solution with the substances separated in rat samples. Linearity and sensibility was determined through the calibration curve. Calibration curve was studied in the following concentration range: 1-20 μg/ml for both arbutin and hydroquinone. Calibration curve was replicated 6 times and the mean of the determination coefficient was R2=0.9996±0.0006 and 0.9996±0.0002 for arbutin and hydroquinone, respectively. The sensibility was evaluated as the mean slope (ms) of 6 calibration curves: ms=11.7783±0.5342 for arbutin and ms=28.4417±0.6167 for hydroquinone (Table 3). As described in international guidelines [17], LOD and LOQ can be determined respectively as 3 and 10 times the SD of repeated measurements of a blank matrix or as “mean+3 times the SD” and “mean+10 times the SD” of repeated measurements of aqueous solution.
| Parameter (units) | Arbutin | Hydroquinone |
|---|---|---|
| Linearity range (µg/ml) | 1–20 | 1–20 |
| Correlation coefficient (R2) | 0.9996±0.0006 | 0.9996±0.0002 |
| Sensibility (ms) | 11.7783±0.5342 | 28.4417±0.6167 |
| LOD (µg/ml) | 0.0617 | 0.0120 |
| LOQ (µg/ml) | 0.206 | 0.0400 |
| Mean (µg/ml) | 10.7 | 10.6 |
| SD | 1.4 | 1.2 |
| Repeatability (percentage of RSD) | 13.33 | 11.67 |
| Recovery (percentage of Rm) | 93.40 | 92.94 |
| n | 6 | 6 |
Quantitative parameters for validation method. SD: standard deviation, LOD: limits of determination, LOQ: limits of quantification, RSD: relative standard deviation, Rm: mean recovery
Table 3: Results of repeatability and recovery.
We analyzed ten times a low level aqueous solution of each analytes under repeatability conditions. LOD was 0.0617 μg/ml for arbutin and 0.0120 μg/ml for hydroquinone. LOQ was 0.206 μg/ml for arbutin and 0.0400 μg/ml for hydroquinone (Table 3). Trueness was studied by analyzing, under repeatability conditions, spiked materials at one level of concentration (CM). Control material (CM) was analyzed and the mean recovery (Rm%) was estimated. Results are shown in Table 3.
Intraday and interday precision studies of aqueous solution of each analyte were carried out by estimating the corresponding responses 3 times on the same day and on 3 different days for the concentration of 0.01 mg/ml of arbutin and hydroquinone, respectively. Precision as repeatability was studied by repeated measurements (N=6) of the CM used for the trueness study. The results of repeatability are given in Table 3.
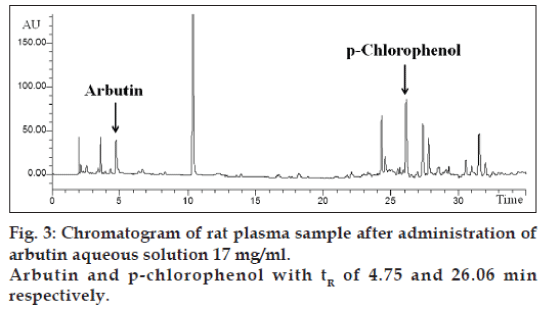
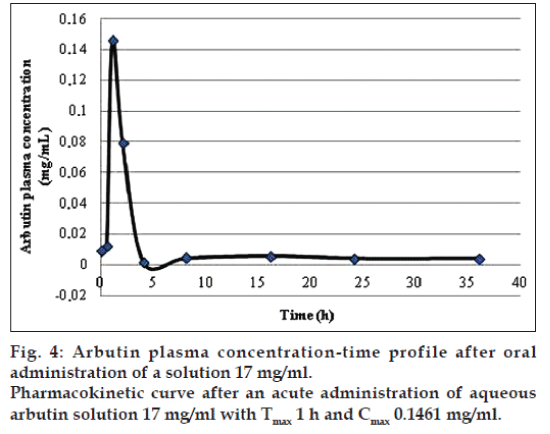
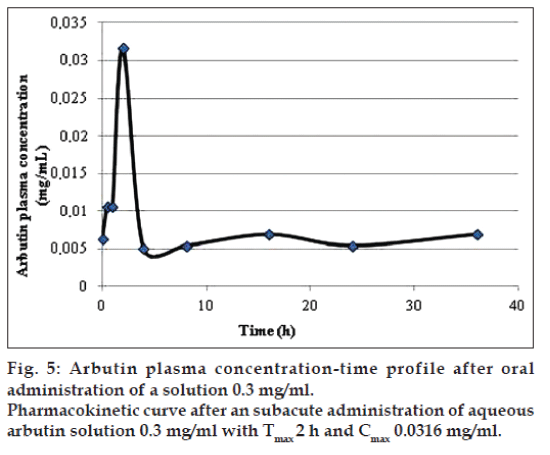
The application of the new method allowed to evaluate both arbutin and hydroquinone in an animal model treated with aqueous arbutin solution (fig. 3). The pharmacokinetics of two oral arbutin solutions were studied at nine different time points: 0, 0.5, 1, 2, 4, 8, 16, 24, 36 h. The two pharmacokinetic profiles were represented in figs. 4 and 5.
A new extraction procedure and HPLC method for the arbutin and its metabolite hydroquinone in rat plasma were fully assessed and validated. The obtained data show good sensitivity, selectivity, linearity, precision and repeatability in the observed concentration range.
This validated method had allowed to assess the pharmacokinetic in animal model (Wistar rat) that could be fed with herbal products that contain the two main active ingredients arbutin and hydroquinone. The concentrations of arbutin and hydroquinone were determined in rat plasma to evaluate the potentially toxicity of commercially products containing these two substances.
In both the pharmacokinetics curves it was possible to observe that arbutin was quickly metabolized in the blood. The maximum arbutin concentration in the blood (Table 4) was not toxic for the rats and free of adverse events. As shown in figs. 4 and 5 and in the Table 4, the half-life value of the acute toxicity analyses is much lower than the one of the subacute toxicity analyses; this may mean that a high concentration of arbutin in the blood induce an effective and rapid detoxification which leads to a good elimination of the substance.
| Sample | AUC (h·mg/ml) | t1/2 (h) | Cmax (mg/ml) | tmax (h) |
|---|---|---|---|---|
| Arbutin 0.3 mg/ml | 0.2591 | 43.0561 | 0.0316 | 2 |
| Arbutin 17 mg/ml | 0.3790 | 12.7066 | 0.1461 | 1 |
AUC (h·mg/ml) is the area under the plot of plasma concentration of drug against time after drug administration, t1/2 (h) the time required to reduce the plasma concentration to one half its initial value, Cmax (mg/ml) the mean maximum plasma concentration, tmax (h) time to reach the maximum plasma concentration
Table 4: Arbutin pharmacokinetic parameters
The results showed only the presence of arbutin in the plasma, while there was no trace of hydroquinone that is probably present in other forms in plasma or is directly hydrolyzed in the urine.
Financial support and sponsorship
Nil.
Conflicts of interest
There are no conflicts of interest.
References
- Cui T, Nakamura K, Ma L, Li JZ, Kayahara H. Analyses of arbutinand chlorogenic acid, the major phenolic constituents in oriental pear. J Agric Food Chem 2005;53:3882-7.
- European Scientific Cooperative on Phytotherapy, ESCOP. Uvaeursi folium. In: ESCOP Monographs. 2nd ed. Exeter, UK: ESCOP; 2003.
- Nycz JE, Malecki G, Morag M, Nowak G, Ponikiewski L, Kusz J, et al. Arbutin: Isolation, X-ray structure and computionalstudies. J MolStruct 2010;980:13-7.
- Blumenthal M. The Complete German Commission E Monographs: Therapeutic Guide to Herbal Medicines. London: Churchill Livingstone; 1998.
- Yarnell E. Botanical medicines for the urinary tract. World J Urol 2002;20:285-93.
- Blaut M, Braune A, Wunderlich S, Sauer P, Schneider H, Glatt HMutagenicity of arbutin in mammalian cells after activation by human intestinal bacteria. Food ChemToxicol 2006;44:1940-7.
- Quintus J, Kovar KA, Link P, Hamacher H. Urinary excretion of arbutin metabolites after oral administration of bearberry leaf extracts. Planta Med 2005;71:147-52.
- Schindler G, Patzak U, Brinkhaus B, von Niecieck A, Wittig J, Krähmer N, et al.Urinary excretion and metabolism of arbutin afteroral administration of Arctostaphylosuvaeursiextract as film-coated tablets and aqueous solution in healthy humans. J ClinPharmacol 2002;42:920-7.
- Integrated Laboratory Systems, Inc. Chemical Information Review Document for Arbutin [CAS No. 497-76-7] and Extracts from Arctostaphylosuva-ursi; 2006. Available from: http://www.ntp-server.niehs.nih.gov/ntp/htdocs/Chem_Background/ExSumPdf/Arbutin_508.pdf. [Last accessed on 2015 Jan 21].
- Commission Regulation (EU) No. 344/2013 of 4 April 2013 Amending Annexes II, III, V and VI to Regulation (EC) No 1223/2009 of the European Parliament and of the Council on Cosmetic Products. OJEU 2013, L114/1; 2013. Available from: http://www.eurlex.europa.eu/ LexUriServ/LexUriServ.do?uri=OJ:L:2013:114:0001:0059:EN:PDF. [Last accessed on 2015 Jan 21].
- Poet TS, Wu H, English JC, Corley RA. Metabolic rate constants for hydroquinone in F344 rat and human liver isolated hepatocytes: Application to a PBPK model. ToxicolSci 2004;82:9-25.
- Mizutani T, Miyamoto Y. Modulation of halobenzene-induced hepatotoxicity by DT-diaphorase modulators, butylated hydroxyanisole and dicoumarol: Evidence for possible involvement of quinonemetabolites in the toxicity of halobenzenes. Toxicol Lett 1999;105:25-30.
- Nowak AK, Shilkin KB, Jeffrey GP. Darkroom hepatitis after exposure to hydroquinone. Lancet 1995;345:1187.
- Deisinger PJ, Hill TS, English JC. Human exposure to naturally occurring hydroquinone. J Toxicol Environ Health 1996;47:31-46.
- Ding M, Ma S, Liu D. Simultaneous determination of hydroxyanthraquinones in rhubarb and experimental animal bodies by high-performance liquid chromatography. Anal Sci 2003;19:1163-5.
- Cummings J, Milroy R, Banham, SW, Kaye, SB. Methodfor the determination of 4-demethoxydaunorubicin, its quinonand hydroquinone metabolites in human plasma and urine byhigh-performance liquid chromatography. Cancer Chemother Pharmacol1987;19:296-300
- EURACHEM, The Fitness for Purpose of Analytical Methods: A Laboratory Guide to Method Validation and Related Topics1998. Available from: http://www.eurachem.org/images/stories/Guides/ pdf/valid.pdf. [Last accessed on 2015 Jan 21].
- EURACHEM/CITAC Guide CG 4, Quantifying Uncertainty in Analytical Measurement, 3rd ed.; 2012. Available from: http://www. eurachem.org/images/stories/Guides/pdf/QUAM2012_P1.pdf. [Last accessed on 2015 Jan 21].
- Thompson M, Ellison SL, Wood R. Harmonized guidelines for single-laboratory validation of methods of analysis (IUPAC Technical Report). Pure ApplChem 2002;74:835-55.
- VIM, International Vocabulary of Metrology, Basic and General Concepts and Associated Terms, ISO/IEC Guide 99. Geneva: International Organization for Standardization (ISO)/International Electrotechnical Commission (IEC); 2007.
- Pasquinelli F. Diagnostica di laboratorio. Vol. III. Florence: Rosini Editor; 1997.
