- *Corresponding Author:
- S. C. Archakam
Department of Pharmaceutical Analysis, Sri Padmavathi School of Pharmacy, Tirupati, Andhra Pradesh 517503, India
E-mail: charan4ma@gmail.com
| Date of Received | 05 July 2023 |
| Date of Revision | 13 March 2024 |
| Date of Acceptance | 24 October 2024 |
| Indian J Pharm Sci 2024;86(5):1642-1651 |
This is an open access article distributed under the terms of the Creative Commons Attribution-NonCommercial-ShareAlike 3.0 License, which allows others to remix, tweak, and build upon the work non-commercially, as long as the author is credited and the new creations are licensed under the identical terms
Abstract
Analysis of multi component dosage forms poses a greater challenge for the precise and accurate determination of individual concentrations of the drugs in the mixtures without prior separation steps if conventional ultraviolet spectrophotometric methods are applied for the analysis. In this research, similar problem was identified where the estimation of lidocaine and phenazone by conventional ultraviolet methods is quite difficult because of their spectral overlapping. This problem is solved by applying the chemometric models like principal component regression and partial least squares for the analysis of individual drugs in ear drops dosage form. Two different set of mixtures namely calibration set and validation set were prepared containing the synthetic mixtures of two drugs in different non-repetitive concentration sets. Spectra of these mixtures were recorded and the wavelength range of 240-300 nm with a data interval of 2 nm was used for transforming the data in to the principal component regression and partial least squares models. The calibration set serves to optimize the model and whereas the validation serves to affirm the model accuracy. Both the developed models showed accurate predictive abilities for the determination of these drugs which was evident from the results obtained for these models. One-way analysis of variance was performed to prove that there are no significant differences in these two models for the assay determination of the drugs in the ear drops. Greenness was evaluated for this analytical method and the score indicates that the method relatively much greener which encourages the analysts to use more often than not.
Keywords
Principal component regression, partial least squares, assay method, analysis of variance, greenness
Lidocaine (LDC) and Phenazone (PNZ) fixed dose combination is used in the systematic treatment of a condition otitis media which is very common in children. Chemically, LDC is 2-(diethylamino)-N- (2,6-dimethylphenyl)-acetamide and is used as a local anesthetic that helps in reducing the pain by blocking the pain signals reaching the brain. On the other hand, chemically, PNZ is 1,2-dihydro-1,5-dimethyl- 2-phenyl-3H-pyrazol-3-one, which is an analgesic and anti-inflammatory agent and also synergizes the action of LDC. This combination is available in the market in the form of ear drops. Review of literature reveals that both the individual drug monographs are available in various pharmacopoeias and are analyzed by liquid chromatography. Only one High-Performance Liquid Chromatography (HPLC) method was reported for the simultaneous analysis of these drugs in their dosage form and few other methods were reported with other drug combinations[1-3]. The reported method employed the high concentration ranges for both the drugs. In this method, the linearity of PNZ was established in the range of 50-150 μg/ml. In comparison to this, the present work employed the PNZ concentration at a low level in the range of 2-10 μg/ml. Whereas for LDC, due its low molar absorptivity in Ultraviolet (UV) spectrophotometer, the concentration range selected was little higher at 50-300 μg/ml which satisfies the Beer-Lambert’s law. Thus the proposed method is superior in terms of concentration ranges. Moreover, the mobile phase has acetonitrile as one of its components which decreases the greenness score of the reported HPLC method. The proposed chemometric methods can be more effective because of their ability to resolve the complex spectral data using various multi linear regression approaches. Two important multi linear regression models, namely Principal Component Regression (PCR) and Partial Least Squares (PLS) models were employed in the present research work for the simultaneous analysis of these drugs in the ear drops[4-11]. Both these methods have been widely reported in the literature for the UV spectrophotometric data analysis of combined dosage forms. These methods basically reduce the given data sets using multi-linear regression approaches in to predictable sets which can be further used to predict the concentrations of the given mixtures of samples.
Materials and Methods
Instruments and software:
Sample weighing was done using Shimadzu analytical balance (Model-AY 220). All the UV spectral recordings were done using Shimadzu UV-visible spectrophotometer (Model UV-1800) which was operated using UVProbe software. For generating the chemometric models like PCR and PLS, Unscrambler X (Camo Analytics, version 10.5) software was used. Statistical treatment and analysis of the data was done using Minitab 16 and Microsoft Excel 2016 softwares. Analytical GREEnness calculator (AGREE) software was used to evaluate the greenness of the proposed analytical method.
Materials:
Pure drug samples of LDC and PNZ were purchased from TCI Chemicals (India) Pvt. Ltd. In-house distilled water was used in the experimentation. Methanol (Analytical Reagent (AR) grade) was purchased from local supplier belonging to Merck Millipore. The marketed formulation Lidazone ear drops containing 4 % w/v of PNZ and 1 % w/v of LDC, manufactured by Delcure Life Sciences Ltd., was purchased from the local pharmacy.
All the glassware used in the experimentation were class A borosilicate glassware and were calibrated before use.
Experimental methods:
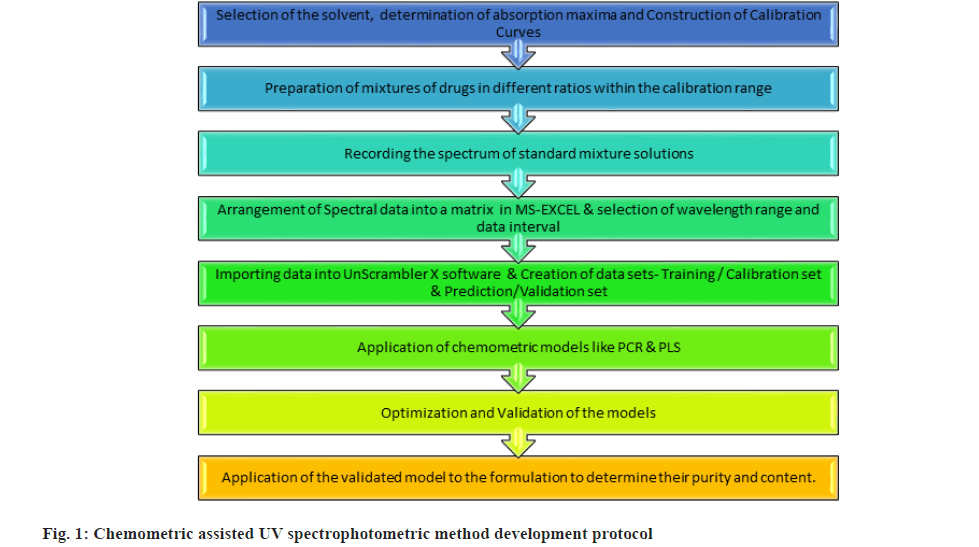
In this research work, two chemometric approaches namely PCR and PLS were employed for the simultaneous analysis of LDC and PNZ in the dosage form. The protocol followed in the research work was based on the review of various analytical methods based on chemomteric approaches like PCR, PLS and multivariate analysis methods (fig. 1)[12-18].
Preliminary investigations:
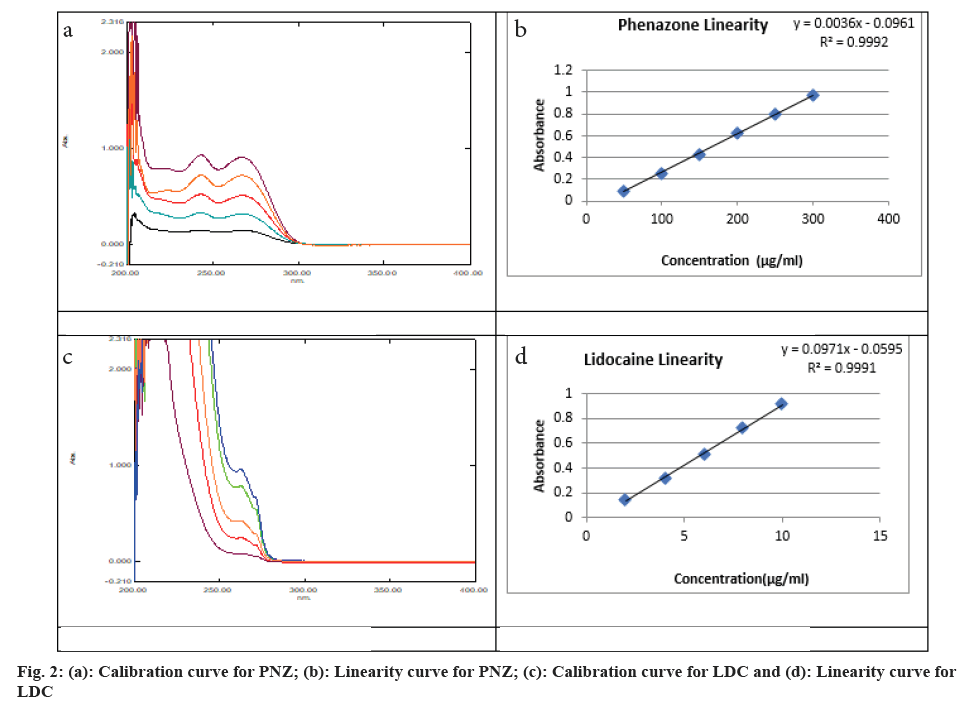
The solubility studies of both LDC and PNZ was carried out using various solvents as per their solubility profiles and methanol was chosen as a common solvent for both the drugs because of its good solubility properties and relatively better environmental friendly nature. Compared to other organic solvents. The UV spectra of both the drugs were recorded separately using suitable concentration of drugs in methanol. The wavelength of maximum absorbance of LDC was at 263 nm and for PNZ it was at 267 nm. This preliminary observation of the overlaid spectra reveals that both the drugs have a very close absorption maxima values and their spectra are overlapping with each other which makes the analysis of these drugs in the mixtures a very difficult process by using the conventional UV spectrophotometric methods. Thus, application of spectral resolving approaches like chemometric models were necessary for the analysis of these drugs in combined dosage forms.
Preparation of calibration curves:
Individual standard stock solutions of LDC and PNZ were prepared separately to get a concentration of 1000 μg/ml each drug from which further dilutions were made to get a series of solutions of LDC in the range of 50-300 μg/ml and PNZ in the range of 2-10 μg/ ml. All these solutions were scanned in a UV-visible spectrophotometer and the calibration curves were constructed to establish the Beer's limits of individual drugs (fig. 2). The linearity (>0.999) of the calibration curves is essential for further steps of the method.
Application of chemometric models:
Standard mixture solutions containing different ratios of LDC and PNZ were prepared with their concentrations encompassing the Beer's limits of individual drugs. The spectral recording of these series of mixtures was done and the data in terms of absorbance vs. wavelength for each mixture is exported to Microsoft Excel (MS Excel) in the form of rows and columns. The wavelength range and data interval for further processing of the data was selected based on the results obtained in the models. Two different sets of synthetic mixtures, namely calibration set and validation set with different concentrations of LDC and PNZ were prepared for executing the models in the software (Table 1).
| Calibration set | Validation set | ||||
|---|---|---|---|---|---|
| Mixture | Phenazone (µg/ml) | Lidocaine (µg/ml) | Mixture | Phenazone (µg/ml) | Lidocaine (µg/ml) |
| 1 | 2 | 50 | 11 | 4 | 100 |
| 2 | 2 | 100 | |||
| 3 | 2 | 150 | 12 | 6 | 150 |
| 4 | 4 | 50 | |||
| 5 | 4 | 250 | 13 | 6 | 250 |
| 6 | 4 | 300 | |||
| 7 | 6 | 300 | 14 | 8 | 250 |
| 8 | 8 | 200 | |||
| 9 | 10 | 100 | 15 | 10 | 150 |
| 10 | 10 | 300 | |||
Table 1: Calibration and Validation Sets for PCR and PLS Methods
Firstly, the data of calibration set of mixtures was executed to construct the PCR and PLS models. PCR and PLS models were assessed by the estimation of different statistical parameters like correlation coefficient (R2), Root Mean Square Error of Calibration (RMSEC), Root Mean Square Error of Cross Validation (RMSECV). Later, to check the accuracy of the constructed models, the validation set of mixtures were run and the models were validated. The predictive ability of the developed models was defined by accuracy (the difference between actual and predicted values) which was reported as percentage recovery and Root Mean Square Error of Prediction (RMSEP).
Preparation of assay samples:
The ear drops containing LDC and PNZ were taken and diluted with methanol to get a final concentration of 4 μg/ml of PNZ and 1 μg/ml of LDC respectively and these samples were treated in the same way as the validation set mixtures and the final concentrations were calculated. One-way ANOVA testing was hypothesized to test whether there are any significant differences in the developed models and to test which model is more effective for the analysis of the drugs in the mixtures.
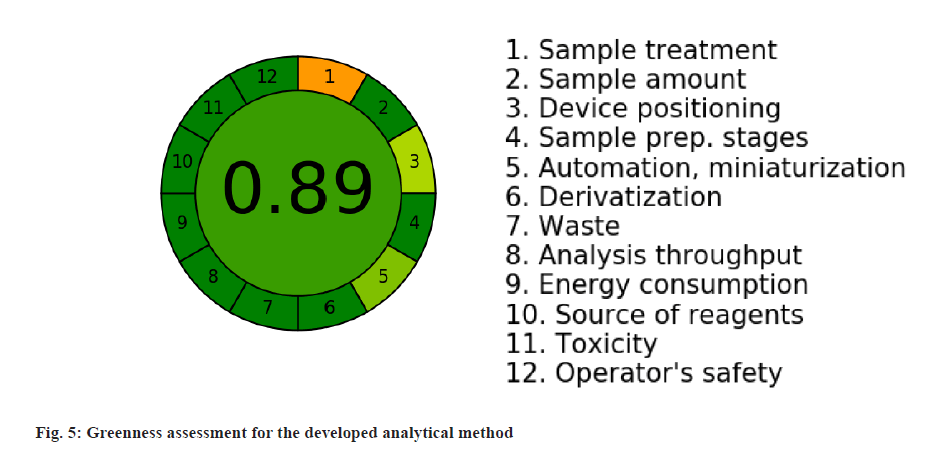
Greenness assessment was done to evaluate the analytical procedures were more environmentally benign and safer to humans. AGREE was used in this work to test the greenness of the proposed methods by applying the twelve principles with respect to the way the method was developed and performed.
Results and Discussion
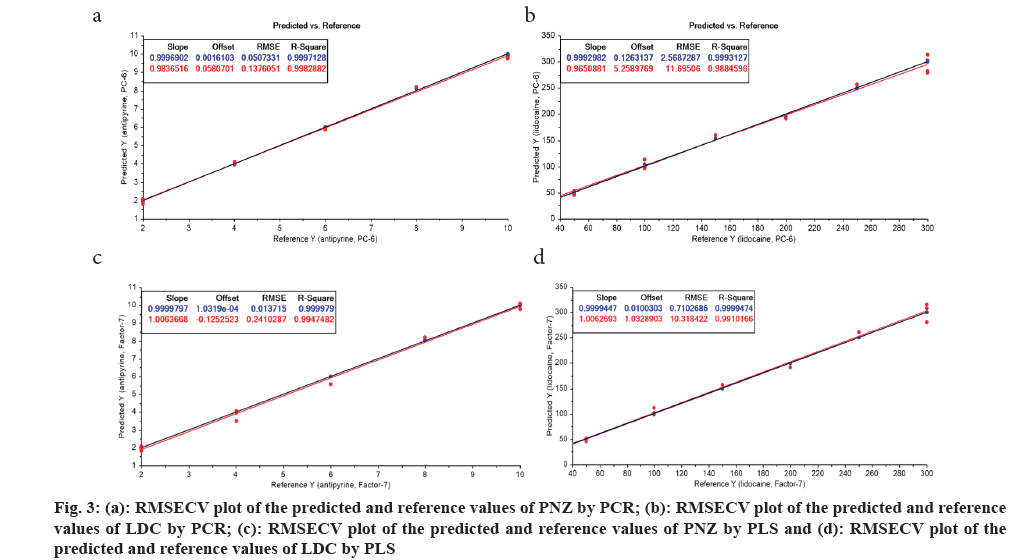
As the absorption maxima of both the drugs were very close and spectra were overlapping, there is a necessity for the spectral resolving approaches for the estimation of these drugs in the mixture solutions. Selection of wavelength range in the obtained UV spectrum for mixture solution was done in a way that the selected range contained a considerable positive absorbance values and the data interval was selected based on the fact to decrease the variance among the predicted and actual values. Thus, a wavelength range of 240-300 nm with a data interval of 2 nm was optimized for the chemometric models after the execution of several runs with different ranges and intervals. For constructing the models, the calibration set with ten different mixtures containing LDC and PNZ in varied concentrations were taken and their spectrum was recorded. The optimal Principal Component (PC) and Latent Variable (LV) were chosen in the PCR and PLS models respectively based on the criteria that the generated RMSECV values were minimized and correlation co-efficient values are maximized. Thus at PC-6 and LV-7 of PCR and PLS models, the above stated criteria was satisfied (fig. 3) and hence these were further used for the prediction of validation and assay sets. The statistical results obtained for the calibration set were also recorded (Table 2-Table 4).
| RMSECV values obtained at different PCs and LVs | |||||
|---|---|---|---|---|---|
| PCs | PCR | PLS | |||
| Phenazone | Lidocaine | PLs | Phenazone | Lidocaine | |
| PC-1 | 2.49 | 47.5 | Factor-1 | 2.41 | 46.39 |
| PC-2 | 0.29 | 19.4 | Factor-2 | 0.28 | 19.33 |
| PC-3 | 0.21 | 10.11 | Factor-3 | 0.11 | 8.06 |
| PC-4 | 0.12 | 8.88 | Factor-4 | 0.13 | 11.64 |
| PC-5 | 0.14 | 11.93 | Factor-5 | 0.17 | 10.85 |
| PC-6 | 0.11 | 7.69 | Factor-6 | 0.23 | 9.7 |
| PC-7 | 0.6 | 25.24 | Factor-7 | 0.09 | 7.31 |
Table 2: Cross Validation Results of Data Set of Phenazone and Lidocaine
| Calibration mixture | Principal Component Regression (PCR) | |||
|---|---|---|---|---|
| Predicted values (µg/ml) | % Recovery | |||
| Phenazone | Lidocaine | Phenazone | Lidocaine | |
| 1 | 2.06 | 52.42 | 103.1 | 104.84 |
| 2 | 2.03 | 96.53 | 101.39 | 96.53 |
| 3 | 1.84 | 159.32 | 91.92 | 106.22 |
| 4 | 4.0 | 45.98 | 99.99 | 91.95 |
| 5 | 4.04 | 256.62 | 101.02 | 102.65 |
| 6 | 4.1 | 314.09 | 102.45 | 104.7 |
| 7 | 5.88 | 279.42 | 97.92 | 93.14 |
| 8 | 8.21 | 191.06 | 102.59 | 95.53 |
| 9 | 9.77 | 109.16 | 97.68 | 109.16 |
| 10 | 9.81 | 282.15 | 98.14 | 94.05 |
| Mean | 99.62 | 99.88 | ||
| SD | 3.37 | 6.27 | ||
| RMSEC | 0.14 | 11.7 | ||
| Correlation coefficient (R2) | 0.9997128 | 0.9993127 | ||
| RMSECV | 0.11 | 7.69 | ||
Table 3: Results Obtained for Calibration Set of Phenazone and Lidocaine by PCR
| Calibration mixture | Partial least squares regression (PLS) | |||
|---|---|---|---|---|
| Predicted values (µg/ml) | % Recovery | |||
| Phenazone | Lidocaine | Phenazone | Lidocaine | |
| 1 | 2.09 | 50.18 | 104.29 | 100.37 |
| 2 | 1.96 | 101.34 | 98.09 | 101.34 |
| 3 | 1.82 | 149.27 | 90.91 | 99.51 |
| 4 | 3.98 | 48.86 | 99.62 | 97.71 |
| 5 | 4.08 | 250.23 | 101.89 | 100.09 |
| 6 | 3.84 | 300.12 | 96.07 | 100.04 |
| 7 | 5.57 | 300.00 | 92.85 | 100.00 |
| 8 | 8.2 | 199.17 | 102.55 | 99.59 |
| 9 | 9.77 | 100.79 | 97.73 | 100.79 |
| 10 | 10.1 | 300.04 | 101.00 | 100.01 |
| Mean | 98.5 | 99.5 | ||
| SD | 4.28 | 0.95 | ||
| % RSD | 4.35 | 0.96 | ||
| RMSEC | 0.24 | 10.32 | ||
| Correlation coefficient (R2) | 0.9999474 | 0.9999474 | ||
| RMSECV | 0.09 | 7.31 | ||
Table 4: Results Obtained for Calibration Set of Phenazone and Lidocaine by PLS
According to the literature, the validation parameters like accuracy and precision were evaluated by the assessment of the obtained statistical results (error should be near to zero) in the chemometric models. The validation of the developed models was performed by employing five different sample mixtures of validation set. The model accuracy can be understood by the RMSEP values generated for the validation set (Table 5 and Table 6). The accepted accuracy limits for is from 90 %-110 % as per United States Pharmacopeia/International Council for Harmonisation, which is the predefined limit set for the present work. From the obtained results, it is evident that the developed models have very good predictable nature even for the validation set containing the additional five mixtures. Thus, these models can be further applied for the assay samples.
| Validation mixture | Principal Component Regression (PCR) | |||
|---|---|---|---|---|
| Predicted values (µg/ml) | % Recovery | |||
| Phenazone | Lidocaine | Phenazone | Lidocaine | |
| 1 | 4.33 | 105.72 | 108.21 | 105.72 |
| 2 | 6.57 | 145.65 | 109.48 | 97.10 |
| 3 | 5.61 | 273.90 | 93.42 | 109.56 |
| 4 | 8.73 | 274.16 | 109.06 | 109.66 |
| 5 | 9.31 | 159.51 | 93.06 | 106.34 |
| Mean | 102.65 | 105.68 | ||
| SD | 8.60 | 5.12 | ||
| % RSD | 8.38 | 4.85 | ||
| Root Mean Square of Prediction (RMSEP) | 0.15 | 0.23 | ||
Table 5: Results Obtained for Validation Set of Phenazone & Lidocaine by PCR
| Validation mixture | Partial Least Squares (PLS) regression | |||
|---|---|---|---|---|
| Predicted values (µg/ml) | % Recovery | |||
| Phenazone | Lidocaine | Phenazone | Lidocaine | |
| 1 | 4.30 | 105.76 | 107.61 | 105.76 |
| 2 | 6.48 | 145.64 | 107.96 | 97.10 |
| 3 | 5.41 | 273.90 | 90.15 | 109.56 |
| 4 | 8.72 | 274.28 | 108.95 | 109.71 |
| 5 | 9.27 | 159.49 | 92.67 | 106.33 |
| Mean | 101.47 | 105.69 | ||
| SD | 9.24 | 5.13 | ||
| % RSD | 9.10 | 4.86 | ||
| Root Mean Square of Prediction (RMSEP) | 0.15 | 0.23 | ||
Table 6: Results Obtained for Validation Set of Phenazone & Lidocaine by PLS
The spectra of the assay samples were recorded in the instrument and the data obtained was treated in the same way as that of calibration set and validation set data. Further the data in the form of MS Excel were imported in to the software and the validated models were applied to this data. The data was analyzed at the previously optimized PC-6 and LV-7 for PCR and PLS models. The percentage assay of all the mixture solutions for both the drugs was within the acceptable limits and model was found to be fit enough for the accurate and precise prediction of assay samples. The results obtained for the assay mixtures (Table 7 and Table 8) showed very good correlation with the actual concentrations of the assay mixtures.
| Marketed formulation | Principal Component Regression (PCR) | |||
|---|---|---|---|---|
| Predicted values (µg/ml) | % Assay (w/w) | |||
| Phenazone | Lidocaine | Phenazone | Lidocaine | |
| 1 | 4.17 | 1.03 | 104.25 | 103 |
| 2 | 4.13 | 1.02 | 103.25 | 102 |
| 3 | 4.23 | 0.99 | 105.75 | 99 |
| Mean | 104.42 | 101.33 | ||
| SD | 1.26 | 2.08 | ||
| % RSD | 1.21 | 2.05 | ||
Table 7: Assay Results Obtained for Phenazone and Lidocaine by PCR
| Marketed formulation | Partial least squares regression (PLS) | |||
|---|---|---|---|---|
| Predicted values (µg/ml) | % Assay (w/w) | |||
| Phenazone | Lidocaine | Phenazone | Lidocaine | |
| 1 | 4.17 | 0.98 | 104.25 | 98 |
| 2 | 4.14 | 1.01 | 103.50 | 101 |
| 3 | 4.25 | 0.94 | 106.25 | 94 |
| Mean | 104.67 | 97.67 | ||
| SD | 1.42 | 3.51 | ||
| % RSD | 1.36 | 3.6 | ||
Table 8: Assay Results Obtained for Phenazone and Lidocaine by PLS
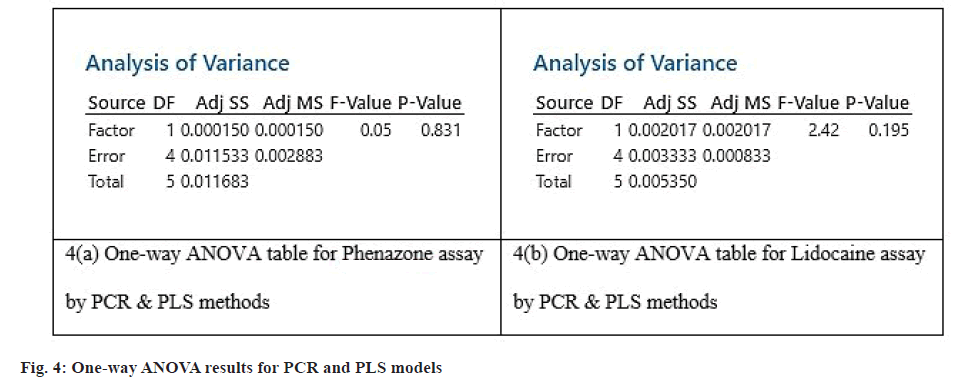
The summary of statistical parameters obtained for PCR and PLS models for the estimation of LDC and PNZ were represented below (Table 9 and Table 10). Oneway ANOVA was carried out to test whether there are any significant differences between the PCR and PLS models for the prediction of assay concentrations of the drugs. The obtained p-values and F-values indicated that there is no statistical difference between the two models for their predictive abilities of assay mixtures (fig. 4). Thus both the methods can be used as per the user flexibility.
| Statistical parameters | Principal Component Regression [PCR] | |
|---|---|---|
| Phenazone | Lidocaine | |
| Concentration range (µg/ml) | 2-10 µg/ml | 50-300 µg/ml |
| No. of factors | 7 | 7 |
| R2 | 0.9997128 | 0.9993127 |
| RMSEC | 0.14 | 11.70 |
| RMSECV | 0.11 | 7.69 |
| RMSEP | 0.15 | 0.23 |
| Calibration set mean±SD | 99.62±3.37 | 99.88±6.27 |
| Validation set mean±SD | 102.65±8.60 | 105.68±5.12 |
| Assay mean±SD | 104.42±1.26 | 101.33±2.08 |
Table 9: Statistical Parameters Obtained for Phenazone and Lidocaine by PCR
| Statistical parameters | Partial least squares regression (PLS) | |
|---|---|---|
| PHENAZONE | LIDOCAINE | |
| Concentration range (µg/ml) | 2-10 µg/ml | 50-300 µg/ml |
| No. of factors | 7 | 7 |
| R2 | 0.999979 | 0.9999474 |
| RMSEC | 0.24 | 10.32 |
| RMSECV | 0.09 | 7.31 |
| RMSEP | 0.15 | 0.23 |
| Calibration set mean±SD | 98.5±4.28 | 99.5±0.95 |
| Validation set mean±SD | 101.47±9.24 | 105.69±5.13 |
| Assay mean±SD | 104.67±1.42 | 97.67±3.51 |
Table 10: Statistical Parameters Obtained for Phenazone, Lidocaine by PLS
For the developed analytical method, the greenness assessment was done using the AGREE software application to demonstrate the rating on the greenness parameters. For all the twelve principles of greenness assessment, equal weightage was given assuming that all are equally important. The results of the assessment was represented in the fig. 5 and the greenness score was found to be 0.89 out of 1, which indicates the method is relatively greener.
To conclude, in this research work an attempt was made to effectively analyze the concentration of LDC and PNZ in their ear drops dosage form without prior separation steps. Two chemometric models namely PCR and PLS were employed for the prediction of concentration of these drugs by using multi-linear regression approaches. The models were first tested with calibration set and then validated with validation set containing different mixtures of two drugs. Statistical parameters like RMSECV and RMSEP values suggest that the developed models were accurate in determining the concentration of the drugs. The assay of the ear drops dosage form was carried out and the results were found to be good. One-way ANOVA predicted that there is no variance between the two developed models. Greenness assessment results showed that the developed method followed the principles of green analytical chemistry. Thus, the developed model can be successfully employed for the analysis of these drugs in their combined dosage form with high accuracy.
Acknowledgements:
The authors express thankfulness to the chairperson Smt. P. Sulochana and director-Sri. P. Praneeth of Sri Padmavathi School of Pharmacy for their valuable support in doing this research work.
Conflict of interest:
The authors declared no conflict of interests.
References
- Bhangale CJ, Hiremath S. Validated stability indicating RP-HPLC method for the determination of phenazone and lidocaine hydrochloride in bulk and dosage form. Int J Pharm Chem Anal 2021;7(4):172-8.
- Noaba R. Identification of sulfanilamide, phenazone, and lidocaine hydrochloride by HPLC technique. J Al-Baath Univ 2009;31(11):249-70.
- Dubois P, Martinez JR, Levillain P. Determination of five components in a pharmaceutical formulation using near infrared reflectance spectrophotometry. Analyst 1987;112(12):1675-9.
- El-Gindy A, Hadad GM. Chemometrics in pharmaceutical analysis: An introduction, review, and future perspectives. J AOAC Int 2012;95(3):609-23.
[Crossref] [Google Scholar] [PubMed]
- Adams MJ. Chemometrics in analytical spectroscopy. Royal Society of Chemistry; 2004.
- Brereton RG. Applied chemometrics for scientists. John Wiley & Sons; 2007.
- De Juan A, Tauler R. Chemometrics applied to unravel multicomponent processes and mixtures: Revisiting latest trends in multivariate resolution. Anal Chim Acta 2003;500(1-2):195-210.
- De Luca M, Ioele G, Spatari C, Ragno G. Optimization of wavelength range and data interval in chemometric analysis of complex pharmaceutical mixtures. J Pharm Anal 2016;6(1):64-9.
[Crossref] [Google Scholar] [PubMed]
- De Luca M, Oliverio F, Ioele G, Ragno G. Multivariate calibration techniques applied to derivative spectroscopy data for the analysis of pharmaceutical mixtures. Chemometr Intell Lab Syst 2009;96(1):14-21.
- Hopke PK. The evolution of chemometrics. Anal Chim Acta 2003;500(1-2):365-77.
- Kumar N, Bansal A, Sarma GS, Rawal RK. Chemometrics tools used in analytical chemistry: An overview. Talanta 2014;123:186-99.
[Crossref] [Google Scholar] [PubMed]
- Palur K, Archakam SC, Koganti B. Development and validation of chemometric assisted uv methods for the simultaneous determination of ambroxol hydrochloride, terbutaline sulphate and guaiphenesin in pharmaceutical dosage form. Indian J Pharm Edu Res 2023;57(1):242-9.
- Archakam SC, Palur K, Arikatla S, Bojaraju V, Kadiyala K, Poojitha KP, et al. A review on chemometric assisted UV spectroscopic and RP-HPLC methods for multicomponent analysis. YMER Digital 2023;22(6):761-72.
- Palur K, Archakam SC, Koganti B. Chemometric assisted UV spectrophotometric and RP-HPLC methods for simultaneous determination of paracetamol, diphenhydramine, caffeine and phenylephrine in tablet dosage form. Spectrochim Acta A Mol Biomol Spectrosc 2020;243:118801-8.
[Crossref] [Google Scholar] [PubMed]
- Palur K, Archakam SC, Koganti B. Development and validation of chemometric assisted uv methods for the simultaneous determination of ambroxol hydrochloride, terbutaline sulphate and guaiphenesin in pharmaceutical dosage form. Indian J Pharm Edu Res 2023;57(1):242-9.
- Archakam SC, Palur K, Arava P. Multivariate analytical methods for simultaneous estimation of Atenolol and Hydrochlorothiazide in bulk and tablet dosage form. IP Int J Comp Adv Pharmacol 2021;6(4):205-8.
- Palur K, Archakam SC, Koganti B. Development and validation of chemometric assisted analytical methods for simultaneous estimation of atorvastatin calcium and aspirin in capsule dosage form. Int J Res Pharm Sci 2019;10(3):1692-1697.
- Palur K, Koganti B, Archakam SC, Chenchugari S, Nagireddy B, Devabhaktuni MB, et al. Simultaneous estimation of atorvastatin and aspirin in bulk and capsule dosage form by chemometric assisted spectrophotometric methods. J Young Pharm 2016;8(4):424-9.
