- *Corresponding Author:
- Harish Padh
B. V. Patel pharmaceutical education and research development (PERD) centre, Thaltej, Ahmedabad-380 054, India
E-mail: perd@perdcentre.com
| Date of Submission | 25 June 2005 |
| Date of Revision | 20 March 2006 |
| Date of Acceptance | 02 December 2006 |
| Indian J Pharm Sci, 2006, 68 (6): 754-759 |
Abstract
Proton pump inhibitors have revolutionized the management of acid-peptic disorders in recent years. They have a broadly similar mechanism of action and are extensively metabolized in the liver via cytochrome P450 2C19 and 3A4 enzymes. A wide inter-individual variability in pharmacokinetics due to polymorphism in cytochrome P450 2C19 has been demonstrated for the first-generation proton pump inhibitors. Since this report, cytochrome P450 2C19 related pharmacokinetics of proton pump inhibitors has been demonstrated in populations other than Indians. Hence, it was of interest to explore inter-individual variations in pharmacokinetics of proton pump inhibitors, i.e., pantoprazole, omeprazole, rabeprazole, and lansoprazole in healthy Asian Indian male subjects after oral administration of the respective formulations. In this report, the pharmacokinetics of four proton pump inhibitors were investigated after single oral dose administered to healthy Indian male subjects. The plasma concentration time profiles of subjects showed high inter-individual variations for all four proton pump inhibitors. Furthermore, the subjects can be classified in groups based on the various patterns of pharmacokinetic profiles. Subjects with higher concentrations of the drug can be grouped as apparent poor metabolizers of the drug and subjects with comparatively lower concentrations of the drug can be categorized as apparent extensive metabolizers of the drug. The mean pharmacokinetic parameters C max , T max , AUC 0-t , AUC 0-00 and t 1/2 for the various groups were statistically significantly different from each other. The results demonstrated that the phenotypic polymorphism and extent of variability in plasma concentration - time profiles of proton pump inhibitors in healthy Indian males were in line with the other populations. Moreover, this information will be helpful in deciding the dose regimens that take the differences in drug metabolic capacity into account as Klotz has already suggested that the lower dosage of pantoprazole should be given to patients of poor metabolizer group with severe liver impairment for the same pharmacodynamic response.
Proton pump inhibitors (PPIs) have dramatically influenced the management of acid-peptic disorders in recent years [1]. As a therapeutic group, the PPIs are highly useful for the relief of symptoms and healing of gastro esophageal reflux disease, gastric and duodenal ulcer disease, eradication of Helicobacter pylori infection, prevention and treatment of NSAID associated damage, management of hypersecretory states such as Zollinger-Ellison syndrome, and care of patients with non-variceal upper gastrointestinal bleeding, or non-ulcer dyspepsia [2]. Since their release, various studies have confirmed that PPIs are superior to H2-receptor antagonists as acid inhibitory agents [3,4]. Their ability to control 24-hour intragastric pH and, in particular, maintain a pH above 4 is important for healing of acid peptic lesions in the oesophagus.
PPIs have a broadly similar mechanism of action and are extensively metabolized in the liver via cytochrome P450 (CYP) 2C19 and 3A4 enzymes [5,6]. The metabolic capacity of the CYP2C19 and 3A4 enzyme system is not equal in all members of a population. A number of cytochrome P450 enzymes are known to be genetically polymorphic. Mutant alleles carrying certain nucleotide substitutions, deletions, insertions or gene conversions are known, which may result in cytochrome P450 enzymes with abnormal activity. Some mutants, the so-called null alleles, lead to enzyme deficiency or total absence of enzyme activity. CYP2C19 also shows genetically determined polymorphism [7], which is expected to affect the pharmacokinetics of these PPIs. As a result, the metabolic conversion and excretion rate of drugs vary between individuals, from extremely slow to ultra fast. A wide inter-individual variability in gastric acid suppression has been demonstrated with the first-generation proton pump inhibitors and imperfect healing rates reported in those with the most severe grades of erosive reflux disease [8]. In addition, as Helicobacter pylori plays an important role in the aetiopathogenesis of peptic ulcers, therapeutic strategies aimed at maintaining long term remission have shifted from the control of intragastric pH to targeting H. pylori. According to recent international guidelines, the clinical goals can be best accomplished by combination therapy consisting of an antisecretory drug (proton pump inhibitors or ranitidine) and two anti-microbial agents. When applying such multidrug regimens, possible synergy between the agents suggests that pharmacokinetic considerations might help to improve H. pylori eradication rates [9]. Since this report, CYP2C19 related pharmacokinetics of PPIs has been demonstrated in populations other than Indians. This article was aimed to bring out the inter-individual variations seen in pharmacokinetics of PPIs, i.e., pantoprazole, omeprazole, rabeprazole and lansoprazole in healthy Asian Indian male subjects after single oral administration of the respective formulations.
Materials and Methods
Oral pharmacokinetics of pantoprazole, omeprazole, rabeprazole and lansoprazole, were studied in 13, 31, 14, and 8 healthy male Indian subjects after administration of a 40, 20, 20, and 30 mg oral dose in separate studies, respectively. All the subjects underwent a thorough physical examination, urine analyses, and routine blood tests. The subjects were also screened for the absence of Australia Antigen and HIV virus not more than seven days prior to the actual study date. They were instructed to refrain from all medications 7 d prior to the study, and until the study was completed. Alcohol was not permitted 24 h prior to and during the study. Subjects gave a written consent before initiation of the study.
After an overnight fast, subjects received medication and blood samples (5.0 ml) were drawn at 0 h pre-dose and 0.5, 1, 1.5, 2, 2.5, 3, 3.5, 4, 4.5, 5, 6, 7, 8, 9, and 10 h post-dose for pantoprazole; 0 h pre-dose and 0.5, 1, 1.5, 2, 2.5, 3, 3.5, 4, 4.5, 5, 6, 7, 8, 9 and 10 h post-dose for omeprazole; 0 h pre-dose and 1, 1.5, 2, 2.5, 3, 3.5, 4, 4.5, 5, 5.5, 6, 6.5, 7, 7.5 and 8 h post-dose for rabeprazole; and 0 h pre-dose and 0.25, 0.5, 0.75, 1, 1.25, 1.5, 1.75, 2, 3, 4, 5, 5.5, 6, 6.5, 7 and 8 h post-dose for lansoprazole. Water and food intake was under supervision. A light standardized lunch was provided 4 h post-dose in all the studies.
All the studies were done according to the guidelines of the World Medical Assembly of Helsinki concerning the ethical consideration in human experiments. Protocols were approved by the Institute Ethics Committee.
Analysis
Pantoprazole was chromatographed on a reverse phase LiChro CART RP-18 Merck cartridge column (250 × 4.6 mm, Merck, Germany) and guard column C18 (Corasil) maintained at room temperature. The mobile phase consisting of a v/v mixture of 33% acetonitrile, 64% of buffer (3.8 mM KH2PO4 + 17 mM K2HPO4, pH 6.8), was pumped at a flow rate of 0.9 ml/min. Water’s UV detector (Lambda max model - 481) was used at 290 nm and Borwin software was used for data analysis. The retention time of pantoprazole and internal standard (lansoprazole) were 8.0 min and 12.0 min, respectively.
Omeprazole was chromatographed on a reverse phase KROMASIL RP-8 column (100 × 4.0 mm, Flexit-Jour, India) and guard column C18 (Corasil) maintained at room temperature. The mobile phase consisting of a v/v mixture of 40% acetonitrile, 60% of buffer (5 mM Na H2 PO4 + 0.03 M Na2 H PO4), pH adjusted to 7.0, was pumped at a flow rate of 0.8 ml/min, using Jasco pump. Borwin software was used for data analysis. The retention time of omeprazole and internal standard (pantoprazole) were between 7.0-8.0 min and 9.0-10.0 min, respectively. Toward the end of analysis, it was observed that an additional interfering peak appeared near the internal standard peak. Hence a slight change in mobile phase was made (v/v mixture of 40% acetonitrile, 60% of buffer (5 mM Na H2 PO4 + 0.03 M Na2 H PO4 and pH 5.8)) to get clear separation. The method was revalidated.
Rabeprazole was chromatographed on a reverse phase RP-18 column (250 × 4.0 mm, Flexit-Jour, India) and guard column C18 (Corasil) maintained at room temperature. The mobile phase was (v/v) 63% buffer, 27% ACN, 5% methanol, and 5% THF. Buffer was consisting of 17 mM KH2PO4, 3.8 mM K2HPO4, and pH adjusted to 3.0 with H3PO4. The mobile phase was pumped at a flow rate of 0.7 ml/min. The UV detector was used at 284 nm. Borwin software was used for the data analysis. The retention time of rabeprazole and internal standard (lansoprazole) were ~6.5 min and ~9.5 min, respectively.
Lansoprazole was chromatographed on a reverse phase Flexit-Jour, kromasil, C8 column (150 × 4.6 mm) and guard column C8 (Corasil) maintained at room temperature, with UV as detector (at wavelength 290 nm), and the mobile phase consisting of 65% phosphate buffer (pH adjusted to 7.0) and 35% ACN. The mobile phase was pumped at a flow rate of 1.0 ml/min. Borwin software was used for the data analysis. The retention time for drug and internal standard (pantoprazole) were ~8.5 min and ~14.5 min, respectively.
All the methods were validated as per regulatory requirements which include: accuracy, precision, linearity, percent recovery, limit of quantification, limit of detection, inter- and intra-day variations and recovery. On each analysis day, a standard curve at the beginning, three quality control samples (high, mid and low) at the beginning, middle and end of the sample assay were analyzed.
Data analysis
The plasma pharmacokinetic parameters have been estimated including the observed maximum plasma concentration (Cmax), the time to reach Cmax (Tmax), the area under the plasma concentration - time curve from 0 h to t (AUCo-t), the area under the plasma concentration - time curve from 0 h to infinity (AUCo-∞) and elimination half life (t1/2). The maximum plasma concentration (Cmax) and the time to reach Cmax (Tmax) were obtained directly from the plasma - concentration time profiles. AUCo-t was calculated by the trapezoidal rule. AUCo-∞ was calculated by summing the area under the plasma concentration - time curve from 0 to t h (AUCo-t) and AUCt-∞ = Ct/Kel, with Ct defined as the last measurable plasma concentration at time t, and ‘Kel’ as the linear regression slope of the terminal portion of the ln concentration-time curve. Elimination half-life (t1/2) was calculated using the equation t1/2= 0.693/Kel.
Levels of statistical significance between the groups were assessed using the Student’s t-test. The Aspin-Welch test was used in case of unequal variances. Significant differences were judged as p< 0.05.
The subjects were grouped according to their plasma concentration-time profiles, as there were two distinct patterns of plasma concentration-time profiles of individuals for all the drugs. Moreover, this classification gave identical results to the classification based on the range (=max-min) of AUC values divided by two as the cutoff value for extensive and poor metabolizer groups.
Results
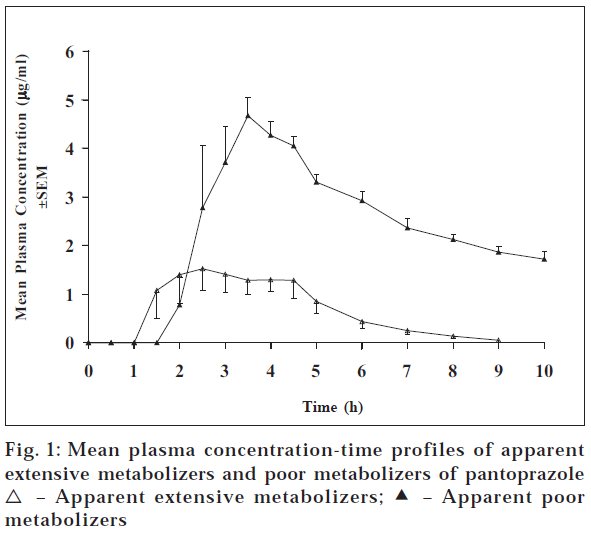
The pharmacokinetic studies of all the drugs were done separately. The subjects did not complain of any adverse reaction in any of the study. Fig. 1 shows the plasma concentration curves of pantoprazole after administering 40 mg pantoprazole, which were classified in groups by the shape of the plasma concentration time profile of the subjects. Plasma concentration-time profiles of subjects showed two types of patterns. One group showed higher concentrations of pantoprazole (apparent poor metabolizers (PMs) of pantoprazole) compared to the other group (apparent extensive metabolizers (EMs)). The mean Cmax, Tmax, AUCo-t, AUCo-∞ and t1/2 for the apparent PMs were 5.24 μg/ml, 3.13 h, 22.66 μg.h/ml, 43.5 μg.h/ml and 7.95 h, respectively, whereas these values for the EMs were 3.30 μg/ml, 2.83 h, 6.06 μg.h/ml, 6.36 μg.h/ml and 1.30 h, respectively (Table 1). The pharmacokinetic parameter values of , Cmax, Tmax, AUC0-t , AUC0-∞ and t1/2 for apparent PMs were 1.6 (p< 0.005), 1.1, 3.74 (p < 0.00005), 6.84 (p< 0.05), and 6.1 (p < 0.05) times higher than those of apparent EMs. Moreover, these values are in accordance to the literature values [9].
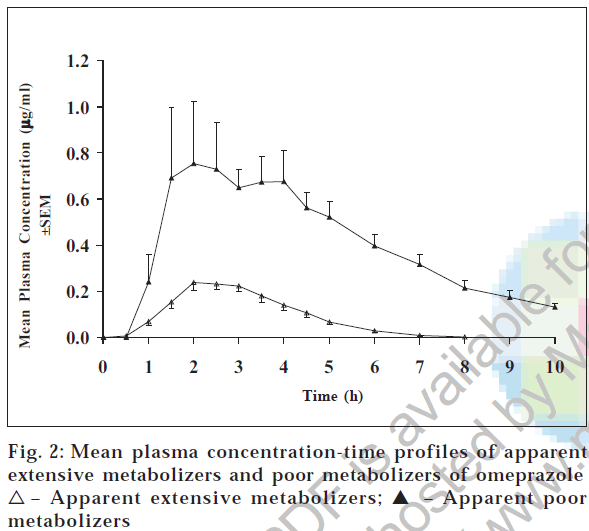
Table 1 lists the pharmacokinetic parameters for all the subjects and fig. 2 shows the plasma concentration-time curves of omeprazole after 20 mg oral dose of omeprazole. Plasma concentrations of omeprazole are much higher in one group (apparent PMs) of subjects compared to the other group (apparent EMs) of subjects. The mean pharmacokinetic parameters Cmax, Tmax, AUCo-t, and AUCo-∞ were 1.03 μg/ml, 2.40 h, 4.05 μg.h/ml, and 4.55 μg.h/ml, respectively, for PMs and 0.37 μg/ml, 2.37 h, 0.74 μg.h/ml, and 0.88 μg.h/ml, respectively, for EMs. The Cmax was three-fold (p < 0.05) and AUCs were five-fold (p < 0.00005) higher in apparent poor metabolizers compared to the apparent extensive metabolizers, whereas the Tmax was more or less same. Our results matches with the findings reported in literature [9]. The mean half life (t1/2) was 2.76 h and 1.65 h (p < 0.05) for apparent poor and extensive metabolizers.
| Phenotype of subjects | Cmax (µg/ml) | Tmax (h) | AUC0-t (µg.h/ml) | AUC0-8 (µg.h/ml) | t1/2 (h) | na |
|---|---|---|---|---|---|---|
| Pantoprazole PM EM | ||||||
| 5.24 ± 0.28 | 3.13 ± 0.24 | 22.66 ± 0.24 | 43.50 ± 6.57 | 7.95 ± 1.97 | 4 | |
| 3.30 ± 0.31** | 2.83 ± 0.38 | 6.06 ± 0.68**** | 6.36 ± 0.69* | 1.30 ± 0.10* | 9 | |
| Omeprazole PM EM | ||||||
| 1.03 ± 0.14 | 2.40 ± 0.48 | 4.05 ± 0.29 | 4.55 ± 0.27 | 2.76 ± 0.33 | 5 | |
| 0.37 ± 0.02* | 2.37 ± 0.16 | 0.74 ± 0.06**** | 0.88 ± 0.06**** | 1.65 ± 0.18* | 26 | |
| Rabeprazole PM EM | ||||||
| 0.63 ± 0.06 | 4.33 ± 0.28 | 1.50 ± 0.22 | 1.69 ± 0.26 | 1.67 ± 0.37 | 6 | |
| 0.36 ± 0.06* | 4.94 ± 0.41 | 0.55 ± 0.05* | 0.61 ± 0.05* | 0.95 ± 0.34 | 8 | |
| Lansoprazoleb PM EM | ||||||
| 1.54 | 1.75 | 5.64 | 19.54 | 13.92 | 1 | |
| 0.54 ± 0.07 | 1.50 ± 0.18 | 1.25 ± 0.21 | 2.83 ± 0.84 | 19.78 ± 9.44 | 7 |
aNumber of subjects. bStatistical significance could not be tested as there was only one subject in poor metabolizer group. *Indicates the statistically significant difference from the poor metabolizers’ group. More the number of asterisks, higher the significant difference. (*P<0.05, **P<0.005, ***P<0.0005, ****P<0.00005) All values are the mean±SEM
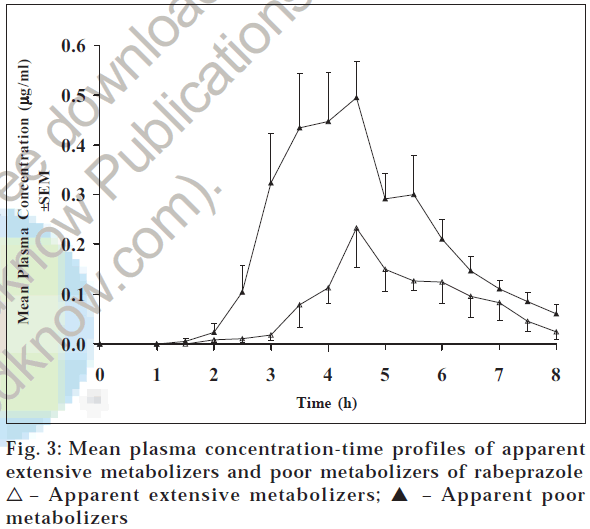
Plasma concentration - time profiles of rabeprazole after 20 mg rabeprazole administration are shown in fig. 3. The plasma concentrations of rabeprazole were comparatively higher in few subjects compared to the other subjects. The pharmacokinetic parameters Cmax, Tmax, AUC0-t, and AUC0-∞ of rabeprazole were 0.63 μg/ml, 4.33 h, 1.50 μg.h/ ml, and 1.69 μg.h/ml, respectively, for PMs and 0.36 μg/ ml, 4.94 h, 0.55 μg.h/ml, and 0.61 μg.h/ml, respectively, for EMs (Table 1). The parameter Cmax was approximately two times (p < 0.05) and AUC0-t and AUC0-∞ were 2.5 times (p < 0.05) more in the apparent poor metabolizer group compared to the apparent extensive metabolizer group of subjects. On the contrary, Tmax and t1/2 were 4.33 and 1.67 h, respectively, for apparent poor metabolizer group of subjects and 4.94 and 0.95 h, respectively, for apparent extensive metabolizer group of subjects. These values are relatively similar in both groups of subjects. This is in accordance with literature. Similar findings were reported by other researchers for other populations [9].
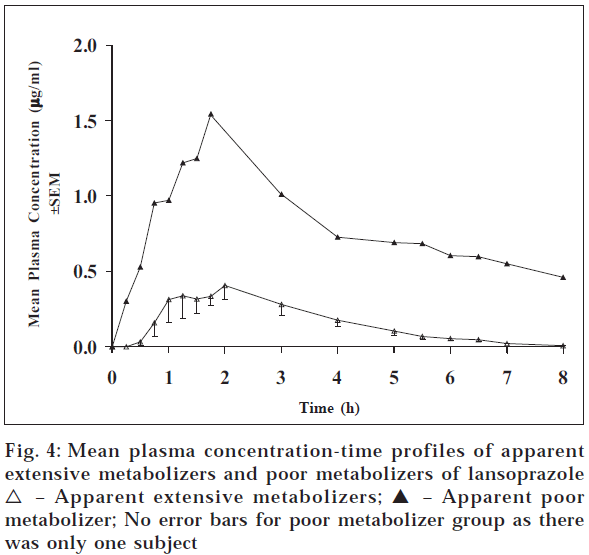
For lansoprazole, the study was conducted only with eight subjects. Fig. 4 gives the plasma concentration time profiles of subjects after 30 mg dose of lansoprazole. Table 1 gives the pharmacokinetic parameters of lansoprazole for apparent PM and EM group of subjects. Table values reveal that one subject out of eight subjects showed the higher values of pharmacokinetic parameters Cmax, Tmax, AUC0-t, AUC0-∞ whereas t1/2 was on the lower side. The mean pharmacokinetic parameter values of Cmax, Tmax , AUC0-t, AUC0-∞ and t1/2 were 1.54 μg/ml, 1.75 h, 5.64 μg.h/ml, 19.54 μg.h/ml, and 13.92 h, respectively, for the apparent PM and 0.54 μg/ml, 1.50 h, 1.25 μg.h/ml, 2.83 μg.h/ml and 19.78 h, respectively, for apparent EMs (Table 1). The pharmacokinetic parameters Cmax, AUC0-t and AUC0-∞ were 3, 4.5, and 7 times more for apparent PM compared to apparent EMs. This difference is in accordance with the reported values9 . However, there was no such difference observed in Tmax . Statistical significance could not be tested, as there was only one subject in poor metabolizer group.
Discussion
It has been observed for a long time that individuals respond differently to a given drug. A given drug may have no effect on one individual while it may work wonders in others. Many patients fail to respond completely to the drugs that they are given, and others often show serious adverse effects [10]. Therapeutic inefficacy and pharmacologic toxicity have frequently been seen in the clinical use of medicines in individuals under treatment. One of the reasons for this variation can be assumed as genetic. These genetic differences, which determine the disposition of a given drug in an individual give differences in drug response.
Recent developments in pharmacogenomics have suggested that the genetic polymorphism of drug metabolizing enzymes and/or target enzymes and receptors are responsible for inter-individual variations in efficacy and adverse events. Due to mutation in gene coding CYP2C19, 2-3% of Caucasians and African-Americans can be characterized by phenotyping and/or genotyping as poor metabolizers; however, a higher proportion (about 15%) of PMs has been reported in people of Asian origin [9]. Among people from South East Asia and Japan, up to 20% are poor metabolizers [6]. In another study done in India, the percentage of PMs of CYP2C19 was shown to be 12% in North Indians [11]. Our data also illustrated the wide variation in the plasma concentration time profiles of the PPIs in healthy Indian males and moreover, these individuals can be classified according to their plasma concentration - time profiles (Table 1; figs. 1-4). In addition, our results (PM ≈ 18% based on omeprazole data as sample size was comparatively larger to infer about the frequency) are similar to the observations reported in literature for Asians/Indians. As already reported that the metabolic disposition of PPIs is under the pharmacogenetic control of CYP2C19 in other populations, it is reasonable to attribute these observed differences in Indians to genetic polymorphism in metabolism of PPIs due to CYP2C19, key enzyme involved in the metabolism of all PPIs. Although these findings have been reported for other populations as well as other populations of Asian origin, our results do provide evidence of similar results in Indian Asians. This corroborates that the phenotypic variability seen with PPIs in other populations is also relevant for Indian males.
This is the first published report for the phenotypic polymorphism of pharmacokinetics of PPIs in healthy Indian males. This phenotypical polymorphism may be due to the genetic polymorphism. The phenotypic polymorphism and extent of variability in plasma concentration - time profiles of PPIs in healthy Indian males were in line with the other populations. Unlike the variation observed in pharmacokinetics of pantoprazole, omeprazole, and lansoprazole, the variability seen in the pharmacokinetics of rabeprazole is comparatively less. The ratio of the AUC for rabeprazole in apparent poor metabolizers compared with apparent extensive metabolizers was lower when compared with pantoprazole, omeprazole, and lansoprazole. The similar findings have been reported by other investigators also in other populations [3,9].
The observed variation in pharmacokinetics of PPIs among population poses a question about efficacy and toxicity of drugs when delivered at standard doses. The efficacy of anti-H. pylori using omeprazole and antimicrobials has been shown to be related to the CYP2C19 genotype [12-14]. In two small trials, the impact of the CYP2C19 genotype on cure rates for gastroesophageal reflux disease has also been studied in Japanese patients [15,16]. For pantoprazole, Klotz [9] has suggested that the lower dosage of pantoprazole should be given to patients of PM group with severe liver impairment for the same pharmacodynamic response. Thus modifying the dose regimens that take into account the differences in drug metabolic capacity may reduce the cases of inefficacies and minimize the adverse drug reactions [17] as with the advent of new technologies [18], it is not difficult to examine genotype of an individual and consequently, predict one’s metabolic capacity.
References
- Stedman, C.A. and Barclay, M.L., Aliment. Pharmacol. Ther., 2000, 14, 963.
- Thomson, A.B., Curr. Gastroenterol. Rep., 2000, 2, 482.
- Sakai, T., Aoyama, N., Kita, T., Sakaeda, T., Nishiguchi, K., Nishitora, Y., Hohda T., Sirasaka, D., Tamura, T., Tanigawara, Y., Kasuga, M. and Okumura, K., Pharm. Res., 2001, 18, 721.
- Joseph, R.P., J. Clin. Gastroenterol., 2001, 32, 27.
- Fitton, A. and Wiseman, L., Drugs, 1996, 51, 460.
- Andersson, T., Clin. Pharmacokinet., 1996, 31, 9.
- Daly, A. K., Pharmacogenetics of the major polymorphic metabolizing enzymes. Fundamental & Clinical Pharmacology, 2003, 17, 27.
- Keating, G.M. and Figgitt, D.P., Drugs, 2004, 64, 883.
- Klotz, U., Clin. Pharmacokinet., 2000, 38, 243.
- Padh, H., Indian Drugs, 2001, 38, 160.
- Lamba, J.K., Dhiman, R.K. and Kohli, KK.,Clin. Pharmacol. Ther., 2000, 68, 328.
- Furuta, T., Ohashi, K., Kamata, T., Takashima, M., Kosuge, K., Kawasaki, T., Hanai, H., Kubota, T., Ishizaki, T. and Kaneko, E., Ann. Int. Med., 1998, 129, 1027.
- Tanigawara, Y., Aoyama, N., Kita, T., Shirakawa, K., Komada, F., Kasuga, M. and Okumura, K., Clin. Pharmacol. Ther., 1999, 66, 528.
- Aoyama, N., Tanigawara, Y., Kita, T., Sakai, T., Shirakawa, K., Shirasaka, D., Komada, F., Okumura, K. and Kasuga, M., J. Gastroenterol., 1999, 34, 80
- Furuta, T., Shirai, N. and Watanabe, F., Clin. Pharmacol. Ther., 2002, 72, 453.
- Kawamura, M., Ohara, S. and Koike, T., Aliment. Pharmacol. Ther., 2003, 17, 965.
- Eichelbaum, M., Ingelmanfrom-Sundberg, M. and Evans, W. E., Annu. Rev. Med., 2006, 57, 119.
- Leon, J.D., Armstrong, S.C. and Cozza, K.L., Psychosomatics, January-February 2006, 47, http://psy.psychiatryonline.org.


