- *Corresponding Author:
- J. Chrenova
Institute of Automation, Measurement and Applied Informatics, Faculty of Mechanical Engineering, Slovak University of Technology, Namestie Slobody 17, 812 31 Bratislava, Slovakia
E-mail: jana.chrenova@stuba.sk
| Date of Submission | 06 June 2012 |
| Date of Revision | 15 February 2013 |
| Date of Acceptance | 20 February 2013 |
| Indian J Pharm Sci 2013;75(2):171-177 |
Abstract
This study aimed to identify the cause of atypical shape of measured concentration-time profile in the peak area by one compartment open model with a lag time (Bateman function with a lag) after single dose oral administration of drug published in "Pharmacokinetic and Pharmacodynamic Data Analysis: Concepts and Application" by Gabrielsson and Weiner (1997) and two concentration profiles after frequent sampling oral glucose tolerance test. Following the oral administration of 100 μg of substance A to human volunteer, frequent sampling was carried out and concentration-time profiles were obtained. Our hemodynamic circulatory structural model capable of parameters estimation of circulation and gastrointestinal subsystem to explain the plateau within the interval 40-100 min (substance A) and 15-30 min (glucose) of the measured concentration-time profile was developed. The mean residence time, the rate constants of absorption and elimination parameters of our model were calculated. Comparing to the Bateman function, our results demonstrate better approximation of the substance A and glucose concentration-time profile and estimation of absorption rate constant by our structural model. Obtained model results indicate that the atypical shape of measured concentration-time profile of single dose oral administration of drug was probably caused by the gastrointestinal and circulation system with deep compartment. This applies to the substances with high coefficient of absorption.
Keywords
Absorption rate constant, elimination rate constant, gastric emptying, hemodynamic circulatory model, plateau
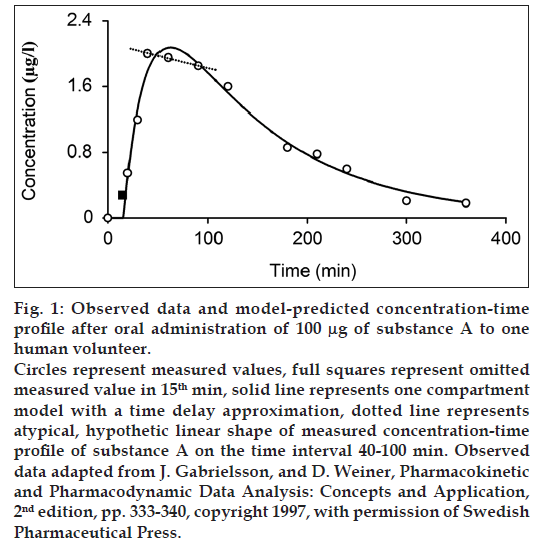
The main inspiration for creation of this work was from the book by Gabrielsson and Weiner [1]. Authors of chapter “PK 2 - One compartment oral data” (pages 333-340) aimed at the modeling of oral administered substance A using one compartment model presented first order input model known as Bateman function with a lag time [2-6]. Parameter estimation by WinNonlin version 1.1 (Scientific Consulting Inc., Apex, NC) were performed.
Bateman function in fig. 1 presents a concave function on the interval 0-100 min, but it does not satisfactorily describe the measured points on the interval 40-100 min (dashed line in fig. 1). Our working hypothesis for the explanation of the pseudolinear phenomena - plateau was that the atypical shape of the measured profile on the interval 40-100 min is caused by the gastrointestinal (GI) and the circulation system. Glucose is used as second example with the atypical shape of the measured concentration profile on the interval 15-30 min. There are also other examples of the atypical shape of the concentration-time profile of oral administered drug, such as L-arginine [7], vitamin C [8], ibuprofen [9], fenobam [10], paracetamol [11] and anthocyanins [12].
Materials and Methods
A human volunteer was given a single oral dose comprising 100 μg of substance A. Consequently, the frequent sampling to obtain the concentration-time data was done at 10, 15, 20, 30, 40, 60, 90, 120, 180, 210, 240, 300, and 360 min after substance A administration [1]. Two other human volunteers (one male and one female) were given 75 g of anhydrous glucose [13] in 250 ml water solution within 1-2 min at time zero. Approval of the study protocol was obtained from the Ethic Committee of the Institute of Experimental Endocrinology of Slovak Academy of Sciences [13]. Frequent sampling oral glucose tolerance test was performed by the criteria of Expert Committee on Diagnosis and Classification of Diabetes Mellitus [14]. The blood samples were collected at 15 min before the glucose was administered and at 8, 15, 22, 30, 45, 60, 90, 120, 140, 160, and 180 min after the glucose was administered. Determination of glucose plasma concentrations was carried out by using the glucose oxidize method (Boehringer Manheim, Germany) [13].
Structural model construction
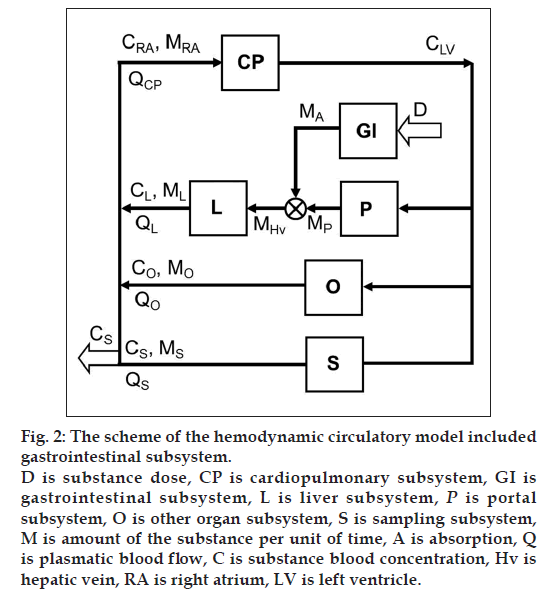
Inclusion of the GI system to the hemodynamic circulatory model (fig. 2) gives the option to analyze the plateau phenomena on the measured concentration-time profile shown in fig. 1. The scheme of the proposed structural model, with the oral substance dose D as input and the substance blood concentration in the sampling subsystem CS as output, includes the cardiopulmonary subsystem CP, the portal subsystem P, the liver subsystem L, the GI subsystem, the other subsystems O and the sampling subsystem S. Assuming that all of the significant subsystems shown in fig. 2 within the range of measured concentrations formalized behave as linear dynamic systems, then ith subsystem can be described by the transfer function Hi presented the general mathematical model of the subsystem as well-stirred model with time delay:

where s is Laplace operator, T is time constant of the subsystem and τ is time delay of the subsystem. The constant gi represented the attenuation of the subsystem and quantified the uptake of substance A in specific subsystem is expressed by the form:

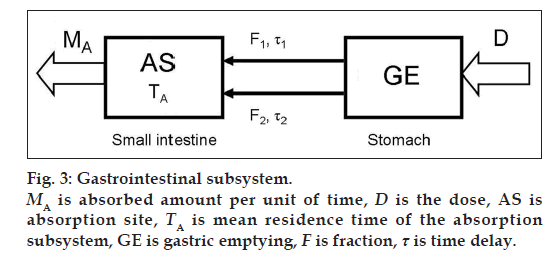
The definition and the transfer function of the GI subsystem comprising absorption part A and gastric empting (GE) (fig. 3) and respecting the mass balance is defined as

where D(t) = Dose · (t), δ(t) is Dirac function, MA is absorbed amount per unit of time in GI subsystem in the first-pass metabolism of the drug, TA is mean residence time of the absorption subsystem, F is fraction and τ is time delay of the subsystem.
For substance blood concentration in the right atrium CRA is valid

where QCP is plasmatic blood flow through CP system expressed as follows:

and ML, MO, MS are mass quantities that flow from the liver, the other organs and the sampling subsystems into right atrium RA per unit of time. QL, QO, QS are plasmatic blood flow via the liver, the other organs and the sampling subsystems.
The definitions and transfer functions of the elementary subsystems, respecting the mass balance, are considered as follows equations:
Regarding the CP subsystem is valid

where CLV is the substance concentration in the left ventricle, MRA is the substance amount per unit of time in the right atrium and QCP is plasmatic blood flow via CP subsystem.
Regarding the portal subsystem P is valid

where MP, gP, QP, GP and TP are the substance amount per unit of time, the attenuation, the plasmatic blood flow, the gain and the time constant, respectively, related to the portal subsystem.
Regarding the liver subsystem L is valid

where MHv is the substance amount per unit of time in the hepatic vein. ML, gL and TL are the substance amount per unit of time, the attenuation and the time constant, respectively, related to the liver subsystem, where gL is dimensionless value.
Regarding the other organ subsystem O is valid

where MO, gO, QO, GO, τO and TO are the substance amount per unit of time, the attenuation, the plasmatic blood flow, the gain, the time delay and the time constant, respectively, related to the other organ subsystem.
The model of peripheral sampling subsystem S was considered as ideal subsystem for which is valid

For the mean residence time of the drug in the whole body (MRTW) after the oral administration is valid following equation:
 (1)
(1)
and for the mean residence time of the GI subsystem (MRTGI) is valid

where TA is mean residence time of the absorption subsystem, F is absorbed fraction and τ is a time delay of the subsystem.
Mean residence time of the substance of the circulation system (MRTCIRC) is calculated according to:

Numerical calculation of mean residence time of the whole system MRTW from zero to infinity is expressed as

The absorption rate constant ka is expressed as

where TA is mean residence time of the absorption subsystem.
The elimination rate constant kel is expressed as
 (2)
(2)
where CS is the concentration of the substance in the sampling subsystem S.
All model calculation and parameter estimation using the Clinical Trials DataBase software [15] were performed. Employing the parameters of the developed structural mathematical model (figs. 2 and 3), the vector λ of estimated parameters was determined as follows:

The point estimate the model parameters by the Monte Carlo method [16] implemented in Computer Controlled Sequential Simulation method [17,18].
Results and Discussion
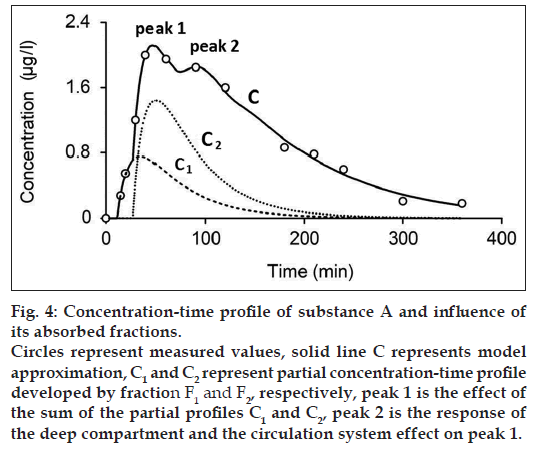
The final outcome of the processed data obtained from the human volunteer is presented in fig. 4 (substance A), 5-6 (glucose) and Tables 1-3.
| Substance | F1 | F2 | Ta | Τ1 | Τ2 | MRTGI |
|---|---|---|---|---|---|---|
| (%) | (%) | (min) | (min) | (min) | (min) | |
| Substance A | 34.348 | 65.652 | 44.717 | 11.503 | 27.227 | 68.354 |
| Glucose 1 | 33 | 66 | 2.852 | 1.731 | 13.398 | 12.271 |
| Glucose2 | 100 | 0 | 1.085 | 7.751 | 0 | 8.836 |
F1,2=Absorbed fractions of the substance dose, τ1,2=Time delays of the subsystem, Ta=Mean residence time of the absorption subsystem, MRTGI=Mean residence time of the gastrointestinal subsystem
Table 1: Model Estimated Parameters of the Gastrointestinal Subsystem
| Substance | QCP (l/min) | gl (min/l) | GP (min/l) | GO (min/l) | τO(min) | TL (min) | TP (min) | TO (min) | MRTCIRC (min) |
|---|---|---|---|---|---|---|---|---|---|
| Substance A | 1.6 | 0.969 | 1.023 | 0.323 | 43.575 | 4.239 | 1.623 | 6.733 | 62.292 |
| Glucose 1 | 2 | 0.229 | 0.453 | 1.032 | 9.704 | 10.636 | 3.877 | 1.498 | 26.485 |
| Glucose 2 | 2.48 | 1.022 | 0.445 | 0.872 | 13.568 | 15.072 | 4.689 | 1.274 | 34.231 |
QCP=Plasmatic blood flow via cardiopulmonary subsystem, g is attenuation of the subsystem, G=Gain of the subsystem, τ=Time delay of the subsystem, T=Mean residence time of the subsystem, L=Liver subsystem, P=Portal subsystem, O=Other organ subsystem, MRTCIRC=Mean residence time of the circulation subsystem
Table 2: Model Estimated Parameters of the Circulation Subsystem
| ka (1/min) |
kel (1/min) |
ka* (1/min) |
kel* (1/min) |
MRTW (min) |
|
|---|---|---|---|---|---|
| Substance A | 0.022 | 0.043 | 0.008 | 0.009 | 130.646 |
| Glucose 1 | 0.35 | 0.047 | 0.041 | 0.045 | 38.756 |
| Glucose 2 | 0.922 | 0.365 | 0.039 | 0.048 | 43.067 |
ka=Absorption rate constant, kel=Elimination rate constant, MRTW=Mean residence time of the whole system, *Derived or estimated parameters by using Bateman function
Table 3: Model Derived Parameters and Compared Parameters by Hemodynamic Circulatory Model and Estimated Using Bateman Function
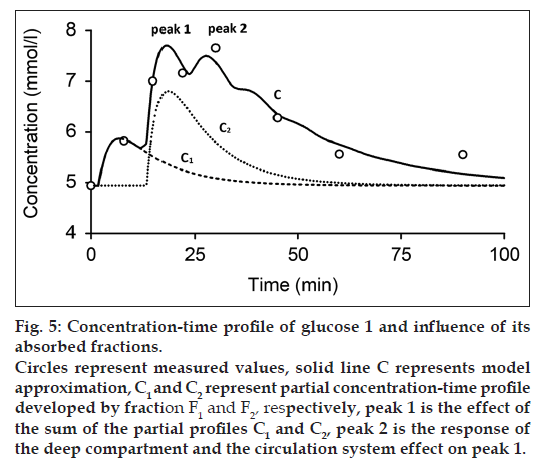
Figs. 4 and 5 show the measured and modeled concentration-time profile C of substance A and glucose 1 and the influence of the first absorbed fraction F1 and the second absorbed fraction F2. The absorbed fractions F1 and F2 expressed by partial concentration-time profiles C1 (dashed line) and C2 (dotted line), respectively, are responsible for the main peak 1 of the final concentration-time profile C and presents the result of the effect of gastric emptying. The final shape of the concentration-time profile C for t≤60 min is expressed as:

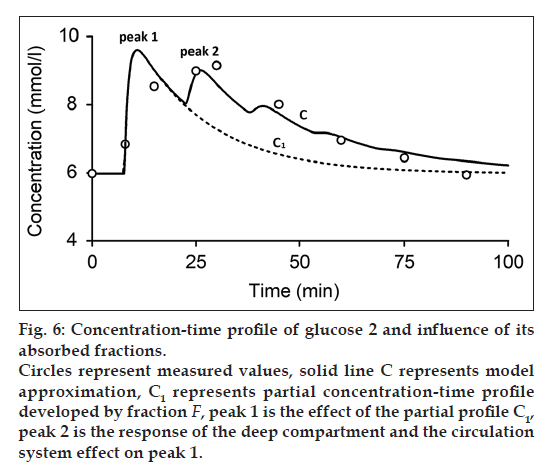
where C1 and C2 are the partial concentration-time profiles developed by fraction F1 and F2, respectively. Consequently, the secondary peak 2 is the time transformed peak 1 probably influenced by the deep compartment and the circulation system. Fig. 6 shows the measured and modeled concentration-time profile of glucose 2. In comparison with concentration-time profile of glucose 1 and substance A, concentration-time profile glucose 2 comprises only one absorbed fraction.
The model estimated parameters of the GI and the circulation subsystems are listed in Tables 1 and 2, respectively. The model parameters of the GI subsystem include absorbed fractions F1 and F2, time delays τ1 and τ2, mean residence time of the absorption subsystem TA and MRTGI. Obtained results of the model approximation show approximately twice more value of the second fraction contrary to the first fraction (Table 1).
The model parameters of the circulation subsystem include plasmatic blood flow in the CP subsystem QCP, gain of the liver, portal, and the other organ subsystems as GL, GP, and GO, respectively, time delay of the other subsystem τO, mean residence time of the liver, portal, and the other organ subsystems as TL, TP, and TO, respectively, and MRTCIRC are listed in Table 2.
The comparison between derived or estimated parameters by our developed hemodynamic circulatory model and parameters estimated by using the Bateman function is listed in Table 3.
Our work as a reanalysis of the study of Gabrielsson and Weiner [1], was focused on the identification of the system defined by the oral administered substance A and frequent sampling oral glucose tolerance test data as the input and the measured concentration-time profile as the output by hemodynamic circulatory structural model included GI subsystem. This is for the substances with high coefficient of absorption.
While one compartment open model (Bateman function) was not capable of fitting the measured data within the time interval 40-100 min (fig. 1) in case of substance A and the time interval 15-30 min in case of glucose, our model approximation presents a good fitting of the measured values within this interval (figs. 4-6). The shape of final concentration-time profile C as the result of the parameters estimation by our structural model is characterized by the individual peaks 1 and 2. Regarding obtained results of our modeling, the peak 1 is expressed by the sum of the partial concentration-time profiles C1 and C2 related to the individual absorbed fractions F1 and F2, respectively, which suggest the effect of the GI system. The second peak 2 presents the influence mainly of the circulation system included the deep compartment to the final concentration-time profile of substance A in the observed human subject. In Table 1, the first fraction F1 (34.425% - substance A) and (33% - glucose 1) was absorbed in the small intestine with the time delay of 11.579 min (substance A) and 1.731 min (glucose 1) compared to the second absorbed fraction F2 (65.575% - substance A) and (66% - glucose 1) with the time delay of 27.262 min (substance A) and 13.398 min (glucose 1). Glucose 2 had only one fraction with time delay of 7.751 min.
The mean residence time of the substance A in the GI system MRTGI (68.354 min) is almost similar to the MRTCIRC (62.292 min). As for the glucose 1 and glucose 2, MRTGI is (12.271 min) and (8.836 min) and MRTCIRC (26.485 min) and (34.231 min), respectively (Table 2).
The attenuation of the liver subsystem gL expressed
in the steady state SS as  where Cin is
the input substance concentration to the system and
Cout is the output substance concentration from the
system, characterizes the substance uptake in the
liver subsystem. In the case of Cout < Cin is gL<1 else
gL=1. Observed gL=0.969 (Table 2) then indicates the
uptake of the substance A in the liver. The uptake
of the glucose in the liver is 0.229 (glucose 1) and
1.022 (glucose 2).
Table 3 shows to the comparison between the individual absorption ka and elimination kel rate constants. Absorption rate constant ka* according to study [1] of 0.043 l/min appears 2 times higher values in comparison with our estimated value ka of 0.022 l/min. The elimination rate constant kel* (0.009 l/min) according to study [1] presents similar values compared to calculations (Eq. 2) related to our developed structural model (0.008 l/min and 0.295 l/min, respectively). The value of mean residence time MRTW of the whole body calculated by our structural model was 130.646 min (substance A), 38.756 min (glucose 1) and 43.067 (glucose 2). Model estimated value of ka for glucose 1 is 0.35, which is similar to the value estimated by Bateman function (0.47) and for glucose 2 is 0.922 is 3 times higher as compared to the value estimated by using Bateman function (0.365). Model estimated values ke for glucose 1 and 2 are 0.41 and 0.39, respectively and they are very similar to the values estimated by using Bateman function (Table 2).
In summary, obtained model results show a good approximation of the final concentration-time profile of substance A and glucose by our hemodynamic circulatory structural model compared to the Bateman function. Our work presents the validation of the hypothesis that the atypical shape of measured concentration-time profile of oral administered substance A and glucose single dose was due to the effect of the GI subsystem and the circulation system included the deep compartment.
Acknowledgements
This work was supported by Competence Centre for SMART Technologies for Electronics and Informatics Systems and Services, ITMS 26240220072, funded by the Research and Development Operational Programme from the ERDF.
References
- Gabrielsson J, Weiner D. Pharmacokinetic and Pharmacodynamic Data Analysis: Concepts and Application. 2nd ed. Stockholm: Swedish Pharmaceutical Press; 1997.
- Bateman H. The solution of a system of differential equations occurring in the theory of radio-active transformations. Proc Cambridge Phil Soc 1910;15:423-27.
- Edler L, Wahrendorf J, Frank N. Computational methods for the screening of pharmacokinetic parameters in metabolism experiments. Int J Biomed Comput 1983;14:369-80.
- Garrett ER. The Bateman function revisited: A critical reevaluation of the quantitative expressions to characterize concentrations in the one compartment body model as a function of time with first-order invasion and first-order elimination. J Pharmacokinet Biopharm 1994;22:103-28.
- Volosov A, Bialer M. Use of mean residence time to determine the magnitude of difference between rate constants and to calculate tmax in the Bateman equation. Biopharm Drug Dispos 1999;20:3-9.
- Roanes-Lozano E, Gonzalez-Bermejo A, Roanes-Macias E, Cabezas J. An application of computer algebra to pharmacokinetics: The Bateman equation. Soc Ind Appl Math Rev 2006;48:133-46.
- Tangphao O, Grossmann M, Chalon S, Hoffman BB, Blaschke TF. Pharmacokinetics of intravenous and oral L-arginine in normal volunteers. Br J Clin Pharmacol 1999;47:261-6.
- Viscovich M, Lykkesfeldt J, Poulsen HE. Vitamin C pharmacokinetics of plain and slow release formulations in smokers. Clin Nutr 2004;23:1043-50.
- Dewland PM, Reader S, Berry P. Bioavailability of ibuprofen following oral administration of standard ibuprofen, sodium ibuprofen or ibuprofen acid incorporating poloxamer in healthy volunteers. BMC Clin Pharmacol 2009;9:19.
- Berry-Kravis E, Hessl D, Coffey S, Hervey C, Schneider A, Yuhas J, et al. A pilot open label, single dose trial of fenobam in adults with fragile X syndrome. J Med Genet 2009;46:266-71.
- Tanner T, Aspley S, Munn A, Thomas T. The pharmacokinetic profile of a novel fixed dose combination tablet of ibuprofen and paracetamol. BMC Clin Pharmacol 2010;10:10.
- Cao G, Muccitelli HU, Sanchez-Moreno C, Prior RL. Anthocyanins are absorbed in glycated forms in elderly women: A pharmacokinetic study. Am J Clin Nutr 2001;73:920-6.
- Dedík L, Durisová M, Penesová A, Miklovicová D, Tvrdonová M. Estimation of influence of gastric emptying on shape of glucose concentration-time profile measured in oral glucose tolerance test. Diabetes Res Clin Pract 2007;77:377-84.
- Expert committee on the diagnosis and classification of diabetes mellitus. Report of the expert committee on the diagnosis and classification of diabetes mellitus. Diabetes Care 2002;25:S5-20.
- Dedík L, Ďurišová M. System approach in technical, environmental, and bio-medical studies. Bratislava: Slovak University of Technology; 1999.
- Manno I. Introduction to the Monte-Carlo Method. Budapest: Akademiai Kiado; 1999.
- Dedík L, Tvrdonová M, Durisová M, Penesová A, Miklovicová D, Kozlovský M. Computer controlled sequential simulation method: Reconsidering evaluation of measurements from frequently sampled intravenous glucose tolerance test. Comput Methods Programs Biomed 2009;95:1-9.
- Tvrdonova M, Dedik L, Mircioiu C, Miklovicova D, Durisova M. Physiologically motivated time-delay model to account for mechanisms underlying enterohepatic circulation of piroxicam in human beings. Basic Clin Pharmacol Toxicol 2009;104:35-42.
