- *Corresponding Author:
- H. Maswadeh
Department of Pharmaceutical Technology, School of Pharmacy, Al-Isra University, P. O. Box 182835, Code No. 11118 Amman, Jordan
E-mail: maswadehhamza@hotmail.com
| Date of Submission | 24 March 2005 |
| Date of Revision | 24 July 2005 |
| Date of Acceptance | 13 May 2006 |
| Indian J Pharm Sci, 2011, 73 (3): 300-302 |
Abstract
Oral dosage forms containing 300 mg theophylline in matrix-type tablets were prepared by direct compression method using two kinds of matrices - glycerylbehenate (hydrophobic) and hydroxypropylmethyl cellulose (hydrophilic). The in vitro release kinetics of these formulations were studied at pH 6.8 using the USP dissolution apparatus with the paddle assemble. The kinetics of the dissolution process were studied by analyzing the dissolution data using four kinetic equations - the zero-order equation, the first-order equation, the Higuchi square root equation, and the Hixson-Crowell cube root law. The analysis of the dissolution kinetic data for the theophylline preparations in this study shows that it follows the first-order kinetics, and the release process involves erosion/diffusion and an alteration in the surface area and diameter of the matrix system as well as in the diffusion path length from the matrix drug load during the dissolution process. This relation is best described by the use of both the first-order equation and Hixson-Crowell cube root law.
A number of methods and techniques have been used in the manufacturing of oral extended-release dosage forms. Probably the simplest and least expensive way to control the release of an active agent is to disperse it in an inert polymeric matrix [1]. In polymeric system, the active agent is physically blended with the polymer powder and then fused together by compression moulding, which is a common process in the pharmaceutical industry [2-4]. These dosage forms are designed to deliver the drug at a controlled and predetermined rate, thus maintaining a therapeutically effective concentration of the drug in the systemic circulation for a long period of time and therefore reducing the frequency of dosing and improving patient compliance [5,6]. Hydrophobic material such as glycerylbehenate for an insoluble matrix carrier, and a water-soluble hydrophilic material such as hydroxypropylmethyl cellulose have been reported as the most commonly used matrix carriers [7,8].
Anhydrous theophylline, a xanthine bronchodilator, is used in the treatment of both chronic and acute asthmatic attacks. Due to its low therapeutic index, careful control of its release from dosage forms has to be ensured. Faulty formulation may result in the release of large amounts of theophylline, i.e., dose dumping, and hence could produce toxic effects [9].
The aim of the present work was to study the utility of using glycerylbehenate and hydroxypropylmethyl cellulose for the formulation of a controlled-release anhydrous theophylline matrix tablets and to study the in vitro release characteristics and kinetics of the prepared formulations. The kinetics of the dissolution process were studied by the application of four kinetic equations to the dissolution data–namely, the zero-order, the first-order, the Highuchi-square root and Hixson-Crowell cube root law equations.
Materials and Methods
Hydroxypropylmethyl cellulose (Methocel K15 M) was obtained from Dow Chemical, Midland, Michigan, USA.; glycerylbehenate (Compritol 888 ATO) from Gattefosse, Paramus, NJ, USA.; anhydrous theophylline from Sigma Chemical Co., St. Louis, USA.; microcrystalline cellulose (Avicel pH 102) from FMC Corporation, Philadelphia, USA.; magnesium stearate USP was from Mallinckrodt Chesterfield, St. Louis, USA.; and fumed silicone dioxide (Aerosil 200) from Degussa AG, Frankfurt, Germany.
Preparation of direct compressible tablets
Table 1 shows the tablet formulations for direct compression. All the ingredients were passed through 125 μm sieve and retained on 90 μm sieve. The powders were mixed together for 10 min in a high-speed mixer (Erweka Turbula system S27, Germany). The tablets were prepared by direct compression using single flat-faced punch 13 mm diameter (Erweka-AR 400E, Germany). The hardness of tablets was controlled between 120 and 130 N.
| Formula | Glycerylbehenate (mg) | Hydroxypropylmethyl cellulose (mg) | Theophylline (mg) | Avicel (mg) | Aerosil (mg) | Mg Stearate (mg) |
|---|---|---|---|---|---|---|
| F1 | 50 | 50 | 300 | 290 | 3 | 7 |
| F2 | 25 | 75 | 300 | 290 | 3 | 7 |
| F3 | 75 | 25 | 300 | 290 | 3 | 7 |
| F4 | 100 | - | 300 | 290 | 3 | 7 |
| F5 | - | 100 | 300 | 290 | 3 | 7 |
The composition of five tablet formulations containing glycerylbehenate and hydroxypropylmethyl cellulose prepared by direct compression as described in materials and methods
Table 1: Tablet Formulations For Direct Compression
Evaluation of the prepared tablets
Friability was determined using Erweka friabilator (TAR). The uniformity of weight and drug content were determined according to USP2002/NF 23 procedures. Mean values of weight variation, content uniformity, and friability are shown in Table 2.
| Formula | Uniformity of weight (mg) | Friability % | Drug content (mg) |
|---|---|---|---|
| F1 | 696.9 ± 1.9 | 0.39 | 298.6 ± 1.0 |
| F2 | 698.7 ± 1.0 | 0.43 | 299.4 ± 1.7 |
| F3 | 694.4 ± 2.5 | 0.34 | 298.3 ± 1.9 |
| F4 | 701.3 ± 1.3 | 0.36 | 300.2 ± 1.4 |
| F5 | 694.7 ± 1.4 | 0.50 | 297.1 ± 1.0 |
Table 2: Mean Values And Coefficient Of Variation Of The Pharmacotechnical Tablets Parameters
Dissolution studies
A USP dissolution paddle (Hanson Research Co., USA) containing 900 ml of pH 6.8 dissolution medium (phosphate buffer) was used. The temperature of dissolution medium was controlled at 37±0.5°, and stirring speed was maintained at 50 rpm. Six tablets from each batch were tested for 8 h. Samples (5 ml) were withdrawn at predetermined time intervals and immediately replaced with equal volumes of dissolution medium. Samples were filtered (0.45 Millipore filter) and then their concentrations were determined using UV/Vis. Spectrophotometer (Varian Australia) at 272 nm.
Results and Discussion
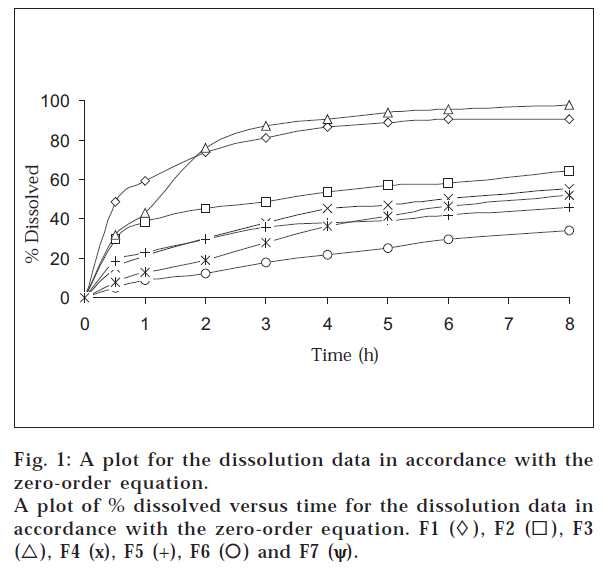
It could be observed that the tablets prepared fulfill the USP2002/NF 23 requirements for uniformity of weight, drug content, and friability as shown in Table 2. fig. 1 and Table 3 showed that a significant variation exists in the in vitro release pattern of theophylline by using a combination of hydroxypropylmethyl cellulose and glycerylbehenate. fig. 1 shows that 64, 90 and 98% theophylline dissolved within 8 h from F2, F1, and F3, respectively. The combination of these hydrophilic polymer and waxy material with different amounts can prepare controlled-release tablets with different release rates. The majority of these formulations have a similar release profile (within the tested time period) to that of commercially available controlled-release theophylline preparations mentioned in previous study [9,10].
| Formula no. | Zero order rate constant (K0) | First order rate constant (K1) | Higuchi square root rate constant (K2) | Hixson-Crowell rate constant (K3) |
|---|---|---|---|---|
| 1 | 5.34 | 0.239 | 20.4 | 0.241 |
| r = 0.875 | r = 0.939 | r = 0.946 | r = 0.961 | |
| 2 | 4.20 | 0.083 | 15.4 | 0.109 |
| r = 0.953 | r = 0.978 | r = 0.987 | r = 0.988 | |
| 3 | 8.39 | 0.464 | 32.4 | 0.404 |
| r = 0.847 | r = 0.985 | r = 0.924 | r = 0.970 | |
| 4 | 5.34 | 0.086 | 19.6 | 0.121 |
| r = 0.955 | r = 0.976 | r = 0.990 | r = 0.988 | |
| 5 | 3.55 | 0.053 | 13.1 | 0.077 |
| r = 0.948 | r = 0.964 | r = 0.987 | r = 0.978 | |
| 6* | 6.15 | 0.090 | 22.0 | 0.130 |
| r = 0.980 | r = 0.991 | r = 0.993 | r = 0.996 | |
| 7** | 3.95 | 0.050 | 14.0 | 0.075 |
| r = 0.990 | r = 0.995 | r = 0.995 | r = 0.998 |
*Theophylline capsules (Theolin SR 300 mg).**theophylline tablets (Uniphyllin SR 300 mg). r, correlation coefficient. Number of data points was 8 for all formulations, Dissolution rate constants and ‘r’ values for all formulations obtained from the application of the zero-order, first-order, Higuchi square root, and Hixson-Crowell cube root equations
Table 3: Dissolution Rate Constants
When the release rates of theophylline from prepared tablets were compared with those of commercial SR tablets of theophylline used in this study, F5 (hydroxypropylmethylcellulose 100 mg) was found to be an optimum formulation in providing controlled drug delivery with similar release profile of Uniphylin SR 300 mg tablets as shown in fig. 1 and Table 3. Also, fig. 1 and Table 3 showed that F4 (glycerylbehenate 100 mg) can be used to prepare controlled release tablets with similar release profile of Theolin SR 300 mg capsule.
In order to describe the kinetics of the release process of drug in the five formulations as well as in the two standard commercial formulations, various equations were used, such as the zero-order rate equation, which describes the systems where the release rate is independent of the concentration of the dissolved species [11]. The first-order equation describes the release from systems where dissolution rate is dependent on the concentration of the dissolving species [12]. The Higuchi square root equation describes the release from systems where the solid drug is dispersed in an insoluble matrix, and the rate of drug release is related to the rate of drug diffusion [13,14]. The Hixson-Crowell cube root law describes the release from system where there is a change in surface area and diameter of the particles or tablets [15,16]. The applicability of all of these equations was tested in this work.
The dissolution data obtained for all formulations at pH
6.8 were plotted in accordance with the zero-order equation, i.e., percent dissolved as a function of time (fig. 1). It is evident from the figure that the plots are curvilinear, suggesting that the release process is not zero-order in nature. This indicates that the dissolution rate of the drug is independent of the amount of drug available for dissolution and diffusion from the matrix.
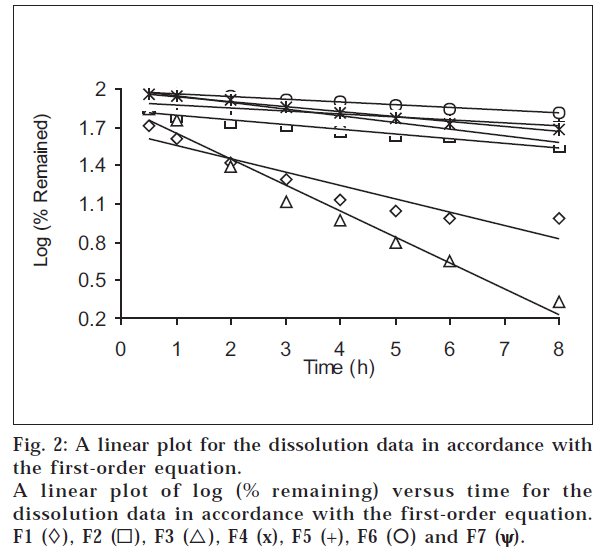
The dissolution data of all formulations at pH 6.8 were plotted in accordance with the first-order equation, i.e., the logarithm of the percent remained as a function of time (fig. 2). It is evident from fig. 2 and Table 3 that a linear relationship was obtained with ‘r’ value close to unity and higher than ‘r’ obtained from the zero-order equation for all formulations, showing that the release is an apparent first-order process. This indicates that the amount of drug released is dependent on the matrix drug load.
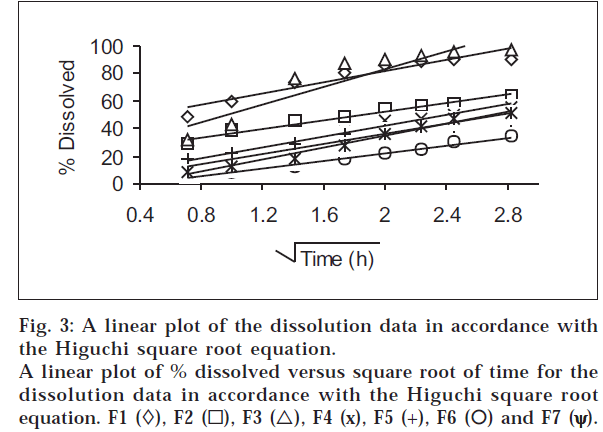
The dissolution results at pH 6.8 were plotted in accordance with the Higuchi square root equation, i.e., percent dissolved as a function of the square root of time (fig. 3). A linear relationship is obtained after an initial lag time has lapsed in all cases. The linearity of the plots indicates that the release process is diffusion-controlled.
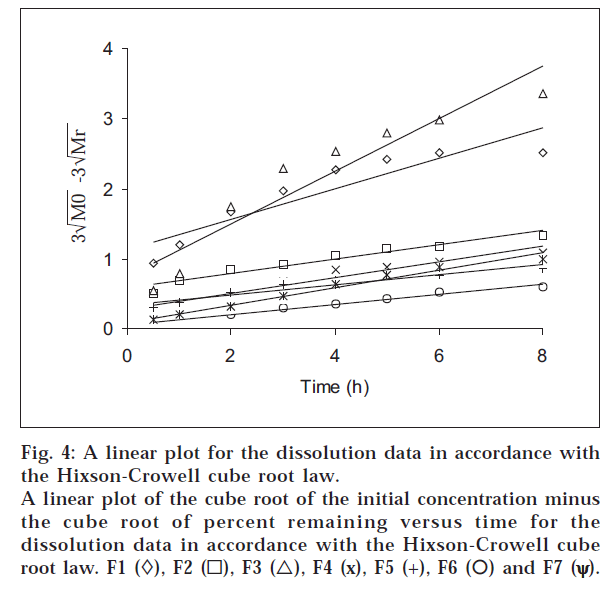
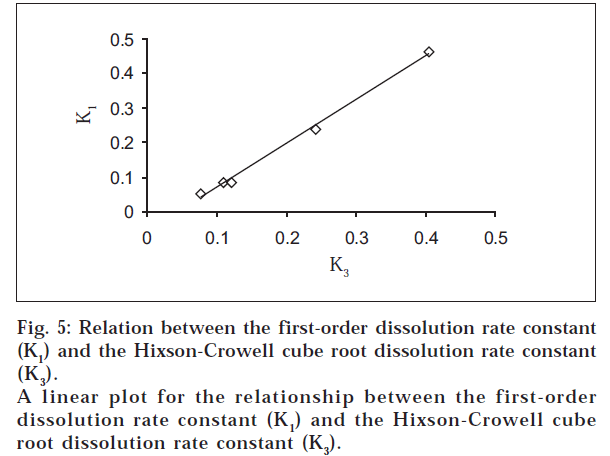
The dissolution data were also plotted in accordance with the Hixson-Crowell cube root law, i.e., the cube root of the initial concentration minus the cube root of percent remained, as a function of time (fig. 4). It is evident from fig. 4 that a linear relationship was obtained in all cases. The relationship between the first-order dissolution rate constant (K1) and the Hixson-Crowell cube root dissolution rate constant (K3) is best illustrated by K1 vs. K3 for all the formulations (fig. 5). A linear relationship was obtained in the following equation: K1 = -0.057 + 1.275 K (r = 0.998). This equation suggests that the slope of the K1-K3 plot is 1.27, ‘r’ is very close to unity, and the intercept 0.057 is near zero. This shows that the change in surface area, diameter of the dissolved particles or tablets, and the change in diffusion path length during the dissolution process follow the cube root law.
From the results obtained in this work, it can be concluded that a significant variation exists in the in vitro release pattern of theophylline from the tested formulations.
The analysis of the dissolution kinetic data for the theophylline preparations in this study shows that it follows the first-order kinetics, and the release process involves erosion/diffusion and an alteration in the surface area and diameter of the matrix system as well as in the diffusion path length from the matrix drug load during the dissolution process. This relation is best described by the use of both the first-order equation and Hixson-Crowell cube root law.
References
- Shan-Yang L. and Tzu-Lag L., Drug Develop. Ind. Pharm., 1993, 19, 1613.
- Pabon C.V., Frutos P., Lastres J.L. and Frutos G., Drug Develop.Ind. Pharm., 1992, 18, 2163.
- Khanvilkar K.H., Huang Y. and Moore A.D., Drug Develop. Ind.Pharm., 2002, 28, 601.
- Juarez H., Rico G. and Villafuerte L., Int. J. Pharm., 2001, 23, 115.
- Baveja S.K., Range R.K.V., Singh A. and Gombar V.K., Int. J.Pharm., 1988, 41, 55.
- Najib N. and Suleiman M., Drug Develop. Ind. Pharm., 1985, 11, 2162.
- Obaidat A.A. and Obaidat R.M., Eur. J. Pharm. Biopharm., 2001, 52, 231.
- Dortunc B. and Gunal N., Drug Develop. Ind. Pharm., 1997, 23, 1245.
- Jalal I., Zmaily E. and Najib N., Int. J. Pharm., 1989, 52, 63.
- Buckton G., Ganderton D. and Shah R., Int. J. Pharm., 1988, 42, 35.
- Shan-Yang L., J. Pharm. Sci., 1988, 77, 229.
- Ranga K.V., Padmalatha D.K. and Buri P.K., Drug Develop. Ind.Pharm., 1988, 14, 2299.
- Baveja S.K., Ranga K.V. and Buri P.K., Int. J. Pharm., 1987, 39, 39.
- Schwartz J.B., Simonelli A.P. and Higuchi W.J., J. Pharm. Sci., 1968, 57, 274.
- Singh P., Desai S.J., Simonelli A.P. and Higuchi W.I., J. Pharm.Sci., 1967, 56, 1542.
- Deasai S.J., Singh P., Simonelli A.P. and Higuchi W.I., J. Pharm.Sci., 1966, 55, 1230.
