- *Corresponding Author:
- Sruti J
Department of Pharmaceutics, Roland Institute of Pharmaceutical Sciences, Ambapua, Khodasingi, Berhampur?760 010, India
Tel: 203 974 7892
E-mail: jsrutirips@gmail.com
| Date of Received : | 14 July 2012 |
| Date of Revised : | 21 January 2013 |
| Date of Accepted : | 26 January 2013 |
| Indian J Pharm Sci 2013;75(1):67-75 |
Abstract
A combination of fusion and surface adsorption techniques was used to enhance the dissolution rate of cefuroxime axetil. Solid dispersions of cefuroxime axetil were prepared by two methods, namely fusion method using poloxamer 188 alone and combination of poloxamer 188 and Neusilin US2 by fusion and surface adsorption method. Solid dispersions were evaluated for solubility, phase solubility, flowability, compressibility, Kawakita analysis, Fourier transform-infrared spectra, differential scanning calorimetry, powder X-ray diffraction study, in vitro drug release, and stability study. Solubility studies showed 12- and 14-fold increase in solubility for solid dispersions by fusion method, and fusion and surface adsorption method, respectively. Phase solubility studies showed negative values for poloxamer 188 at various concentrations (0, 0.25, 0.5, 0.75 and 1%) indicating spontaneous nature of solubilisation. Fourier transform-infrared spectra and differential scanning calorimetry spectra showed that drug and excipients are compatible with each other. Powder X-ray diffraction study studies indicated that presence of Neusilin US2 is less likely to promote the reversion of the amorphous cefuroxime axetil to crystalline state. In vitro dissolution studies, T50% and mean dissolution time have shown better dissolution rate for solid dispersions by fusion and surface adsorption method. Cefuroxime axetil release at 15 min (Q15) and DE15 exhibited 23- and 20-fold improvement in dissolution rate. The optimized solid dispersion formulation was stable for 6 months of stability study as per ICH guidelines. The stability was ascertained from drug content, in vitro dissolution, Fourier transform-infrared spectra and differential scanning calorimetry study. Hence, this combined approach of fusion and surface adsorption can be used successfully to improve the dissolution rate of poorly soluble biopharmaceutical classification system class II drug cefuroxime axetil.
Keywords
Fusion method, Kawakita analysis, solubility enhancement, surface adsorption.
Drugs which belong to class II of the biopharmaceutical classification system (BCS) are characterised by high membrane permeability, slow dissolution rate (due to low aqueous solubility) and high peroral dose [1]. The solubility or dissolution rate of a drug in this category is therefore, a key‑factor in determining the rate and extent of its absorption. Enhancement of the dissolution rate is vital to attain a suitable blood concentration for therapeutic effect, as their dissolution rates are typically the rate limiting step for bioavailability. Cefuroxime axetil (CA) is an established broad spectrum β‑lactamase stable cephalosporin with poor water solubility. It is used orally for the treatment of mild to moderate respiratory tract infections, acute bacterial otitis, pharyngitis, tonsillitis, mild to moderate uncomplicated skin infections and uncomplicated urinary tract infections [2].
Several technological methods have been reported for improvement of solubility and dissolution rate of poorly water‑soluble drugs, namely (a) reducing particle size to increase surface area; (b) solubilisation in surfactant systems; (c) formation of water‑soluble complexes; (d) use of pro‑drug and drug derivatisation approach such as strong electrolyte salt forms that usually have higher dissolution rates; (e) manipulation of the solid state of the drug substance to improve drug dissolution, i.e. by decreasing crystallinity of the drug substance through formation of solid dispersions (SDs) [3]. SD can be defined as distribution of active ingredient/s in molecular, amorphous and/or crystalline forms surrounded by an inert carrier. The solid state characteristics of SDs have been extensively studied and reported [4,5]. Formulation of poorly water‑soluble drugs as SDs leads to a marked improvement in their dissolution rates and is often accompanied by an increase in their relative bioavailabilities [6,7].
Poloxamers are polyoxyethylene‑polypropylene block copolymer nonionic surfactants that have been widely used as wetting and solubilising agents and surface adsorption excipients [8,9]. Poloxamer consists of hydrophilic corona ethylene oxide and hydrophobic core (polypropylene oxide) blocks arranged in a triblock structure resulting in an amphiphilic copolymer. Their low melting point (about 56‑57°) renders them suitable for melt granulation technique. For drug delivery purposes, hydrophobic drugs may be solubilised within the core of micelle or conjugated to the micelle‑forming poloxamer [10]. SDs of many poorly water‑soluble drugs by incorporating them into poloxamer have been considered as an effective method for improving drug dissolution rate and their saturation solubility in the gastrointestinal fluids. For some drugs, the improvement in solubility using poloxamer is higher compared to the other meltable polymers such as polyethylene glycol or complex‑forming agents such as cyclodextrins [11].
Although, poloxamer 188 based SDs greatly enhance the dissolution rate of poorly water‑soluble drugs, but they have some disadvantages such as poor flow[12]. This may be a problem in development of tablet or capsule dosage forms and scale‑up. In order to overcome these problems, an inert material with good flow and compressibility may be used to adsorb the dispersion on its surface. Neusilin US2 is a synthetic, amorphous form of magnesium aluminometasilicate. It is a multifunctional excipient that can be used in both direct compression and wet granulation of solid dosage forms. It has good flow and compressibility properties with an angle of repose of 30° and a compressibility index of 21%. It has a high specific surface area (300 m2/g) and a high adsorption capacity (3.2 ml/g) making it a good material for adsorption of a high proportion of drug. It makes hard tablets at low compression force and in addition low concentrations can improve the hardness of other filler and binder excipients [13]. The presence of silanols on its surface makes it a potential proton donor as well as a proton acceptor. The hydrogen bonding potential of silanols is well‑documented [14]. Hydrogen bonding between silanols and drug as well as interaction between the drug and metal ions on the surface of Neusilin US2 were suggested stabilising mechanisms of indomethacin in its amorphous state [15].
Hence, the primary objective of the present research work is to improve the solubility and dissolution rate of CA by melt dispersion granulation employing poloxamer 188 as a meltable hydrophilic carrier. The secondary objective is to convert the melt dispersion in to free flowable SDs by surface adsorption technique using Neusilin US2.
Materials and Methods
The CA was a generous gift sample from Aurobindo Pharma Ltd, Hyderabad, India. Neusilin US2 was a gift sample from Gangwal Chemicals Ltd, Mumbai, India. Poloxamer 188 was purchased from Sigma Aldrich, Bangalore, India. All other chemicals and reagents used were of analytical grade.
Preparation of physical mixture
Initially drug and excipients were passed through mesh #60. First physical mixture (PM1) was prepared by grinding CA and poloxamer 188 in a mortar in the ratio of 1:3. Second physical mixture (PM2) was prepared by grinding CA, poloxamer 188 and Neusilin US2 in the ratio of 1:3:1.5.
Preparation of solid dispersions by fusion method
SDs (F1‑F6) of CA was prepared by fusion method (FM). Poloxamer 188 was melted at 60°. CA was added to the molten polymer, which was then mixed well and cooled to room temperature to obtain the solid mass. The solidified masses were crushed, pulverised and passed through mesh #40. The resulting SDs was stored in desiccators. The compositions of SDs are shown in Table 1.
| Formulation | Composition of solid dispersions | Solubility | ||
|---|---|---|---|---|
| code | CA | Poloxamer 188 | Neusilin US2 | (mg/ml)* |
| CA | 1 | ‑ | ‑ | 0.412±0.03 |
| PM1 | 1 | 3 | ‑ | 0.423±0.07 |
| F1 | 1 | 0.5 | ‑ | 0.637±0.06 |
| F2 | 1 | 1 | ‑ | 1.481±0.05 |
| F3 | 1 | 1.5 | ‑ | 2.265±0.07 |
| F4 | 1 | 2 | ‑ | 3.762±0.02 |
| F5 | 1 | 2.5 | ‑ | 4.124±0.10 |
| F6 | 1 | 3 | ‑ | 5.130±0.06 |
| PM2 | 1 | 3 | 1.5 | 0.479±0.09 |
| F7 | 1 | 3 | 0.75 | 5.234±0.56 |
| F8 | 1 | 3 | 1.5 | 5.897±0.12 |
| F9 | 1 | 3 | 2.25 | 5.945±0.21 |
| F10 | 1 | 3 | 3 | 5.886+0.23 |
*The values are expressed as mean±SD, n‑6, CA=Cefuroxime Axetil, PM1=First physical mixture, PM2=Second physical mixture
Table 1: Composition And Solubility Data Of Cefuroxime Axetil Solid Dispersions Containing Different Ratios Of Cefuroxime Axetil, Poloxamer 188 And Neusilin Us2.
Preparation of SDs by fusion and surface adsorption method
SDs (F7‑F10) were prepared using fusion and surface adsorption method (FSAM). CA (mesh 60) was added to the melt of poloxamer 188, maintaining a temperature of 60° to obtain a clear molten mixture. Neusilin US2 (mesh no. #60) was preheated to 80° in the china disc for 15 min with mixing. The molten mixture was then added drop‑wise over a period of 2 min to Neusilin US2 with continued mixing. Mixing was performed for 15 min to obtain the ternary SD of CA, poloxamer 188 and Neusilin US2. The SDs was allowed to cool to room temperature by air‑cooling followed by sieving through mesh #40. The resulting SDs was stored in desiccators. The compositions of SDs are shown in Table 1.
Fourier transform‑infrared spectra spectroscopy study
Fourier transform‑infrared (FT‑IR) spectra scans of selected CA, SDs prepared by FM (F6) and FSAM (F8) were performed on IR afiinity‑1, (Shimadzu, Japan) using KBr discs. The instrument was operated under dry air purge and the scans were collected at a scanning speed of 2 mm/sec with resolution of 4 cm–1 over the region 4000‑400 cm–1.
Differential scanning calorimetry
The differential scanning calorimetry (DSC) measurements were performed on a DSC‑60 (Shimadzu, Japan) with thermal analyser. All accurately weighed samples were placed in sealed aluminium pans before heating under nitrogen flow (20 ml/min) at a scanning rate of 10°/min from 25 to 250°. An empty aluminium pan was used as reference. DSC measurements were performed for CA, poloxamer 188, F6 and F8 to study drug polymer interaction.
Phase solubility studies
Phase solubility determinations were performed as per standard method [16]. An excess amount of CA was placed in a screw‑cap glass vial to which 20 ml of distilled water containing various concentrations (0, 0.25, 0.5, 0.75 and 1%) of poloxamer 188 was added (Table 2). The samples were shaken at 37±0.5° for 72 h on a mini rotary shaker 12R DX (Remi, India). After 72 h the samples were filtered through a 0.45 μm membrane filter (Auroco, Thailand). The filtrate was diluted suitably and analysed spectrophotometrically at 280 nm using UV/Vis spectrophotometer UV‑1800 (Shimadzu, Japan).
| Concentration of | Concentration of CA | ΔGtr° |
|---|---|---|
| Poloxamer 188 (% w/v) | (mg/ml)* | (J/Mol) |
| 0 | 0.12 ± 0.01 | 0 |
| 0.1 | 0.56 ± 0.03 | ?1.54152 |
| 0.25 | 0.62 ± 0.02 | ?1.64319 |
| 0.5 | 0.71 ± 0.01 | ?1.77535 |
| 0.75 | 0.80 ± 0.02 | ?1.90072 |
| 1 | 0.86 ± 0.01 | ?1.96204 |
*The values are expressed as Mean±SD, n=6, CA=Cefuroxime axetil
Table 2: Effect of Poloxamer 188 Concentration and Gibb’s Free Energy on Cefuroxime Axetil Solubility.
The value of the apparent stability constant, Ks, for CA–poloxamer 188 combinations was computed from phase‑solubility profiles, as described by Ks=Slope/ [intercept (1‑slope)]...(1)
The Gibb’s free energy of transfer (ΔG0tr ) of CA from distilled water to solutions of carrier was calculated as ΔG0tr =–2.303RT [log (So/Ss)]...(2) Where, S0/Ss is the ratio of the molar solubility of CA in distilled water of poloxamer 188 to that in the same medium without poloxamer 188.
Drug content
PMs and SDs equivalent to 10 mg of CA were weighed accurately and dissolved in suitable quantity of simulated gastric fluid (SGF) without enzyme, sonicated for 10 min and filtered. The filtrate was suitably diluted and drug content was analysed at 280 nm spectrophotometrically.
Solubility measurement of SDs
Solubility of CA, PM and SDs were determined [17]. An excess amount of CA, PMs and SDs were added to 20 ml of freshly prepared SGF without enzyme in clean vials with continuous shaking on a mini rotary shaker‑12R‑DX at 25±0.5º for 24 h to achieve equilibrium. The filtered solutions were suitably diluted and analysed spectrophotometrically.
Flowability and compressibility and Kawakita analysis
CA, PMs and SDs were subjected to measurement of angle of repose, Carr’s Index and Hausner’s ratio were determined as per standard procedure[18]. Flowability was determined using the Kawakita analysis[19]. The CA, PM and SDs (10 g) was poured into a 50 ml glass measuring cylinder, the heap of the particles in the cylinder was levelled off horizontally with a thin metallic spatula, and the bulk volume, Vo, was accurately measured. The cylinder was then tapped using digital tap density tester ETD‑1020 (Electrolab, Mumbai, India) and the change in volume of the powder column, VN, was noted after tapping. The compatibility and cohesiveness of CA, PMs and SDs were evaluated using numerical constants obtained from the Kawakita plots based the Kawakita equation, which is used for assessing the flow properties of powders as per the equation, N/C=(N/a)+(1/ab)...(3), where a and b are constants; a describes the degree of volume reduction at the limit of tapping and is called compatibility; 1/b is considered to be a constant related to cohesion and is called cohesiveness, C. The degree of volume reduction was calculated from the initial volume (V0) and tapped volume (VN) as in equation C=(V0–VN)/V0...(4).
Numerical values for constants a and 1/b were obtained from the slope of plots of N/C versus number of taps N (N=10, 20, 30, up to 300).
Powder X‑ray diffraction study
Powder X‑ray diffraction (PXRD) patterns were obtained at room temperature using a XPERT‑PRO‑MRD (PANalytical, Netherlands) with a Cu anode and a graphite monochromator, operated at a voltage of 35 kV and a current of 20 mA. The samples CA, poloxamer 188, F6 and F8 were analysed in the 2θ angle range of 5‑50°, and the process parameters were set as scan‑step size of 0.02° (2θ) and scan‑step time of 25 s.
In vitro dissolution test
The release of CA from PM and SDs was determined using USP dissolution tester TDT‑06L (Electrolab, India) at 50 rpm. Dissolution was examined using 900 ml of SGF without enzyme and the temperature was maintained at 37±0.2°. Samples each containing 5 ml were withdrawn at 5, 10, 15, 30, 45 and 60 min intervals, filtered through a 0.45 μm membrane filter and replaced with an equal amount of fresh dissolution medium. Samples were then suitably diluted and analysed for CA content spectrophotometrically at 280 nm. The release studies were conducted in triplicate. The dissolution profiles were evaluated for amount of drug released in initial 15 min (Q15 min) and time taken to release 50% of the drug (T 50%).
The percent dissolution efficiency (%DE) was also computed to compare the relative performance of various concentrations poloxamer 188 and Neusilin US2 in the formulations. The %DE of a pharmaceutical dosage form is defined as the area under the dissolution curve up to a certain time, t, expressed as a percentage of the area of the rectangle described by 100% dissolution at the same time [20].
The dissolution data of CA, PM and their SD were also analysed as per Hixson‑Crowell’s cube root equation. Hixson‑Crowell introduced the concept of changing surface area during dissolution and derived the ‘cube‑root law’ to nullify the effect of changing surface area and to linearize the dissolution curves. Hixson‑Crowell’s cube root law is given by the following equation.
 (5)
(5)
Where Wo is initial mass and Wt is the mass remained at time ‘t’, K is Hixson Crowell cube root constant. The % DE can be calculated from
 (6)
(6)
Where Y is the percent drug dissolved at time t.
To understand the extent of CA dissolution rate enhancement from its formulations, the dissolution data were used to calculate the mean dissolution time (MDT) [21]. The MDT can be calculated by using following equation.
 (7)
(7)
Here, i is the dissolution sample number, n is the number of dissolution sampling times, Tmid is the mid‑point between times Ti and Ti−1, and ΔM is the amount of CA dissolved between times Ti and Ti−1.
Stability studies
Formulation F8 was subjected to stability studies for a period of 6 months as per ICH guidelines at 40°/75% RH conditions in a humidity controlled oven (TH90 S/G, Thermolab, Mumbai, India). The samples were withdrawn at 0, 3 and 6 months and evaluated for appearance, drug content and in vitro drug release. Stability of the optimized formulation (F8) stored under similar conditions was also evaluated by DSC and FT‑IR. The samples were withdrawn at 0, 3 and 6 months and evaluated for effect of storage on drug polymer interactions by DSC and FT‑IR study.
Results and Discussion
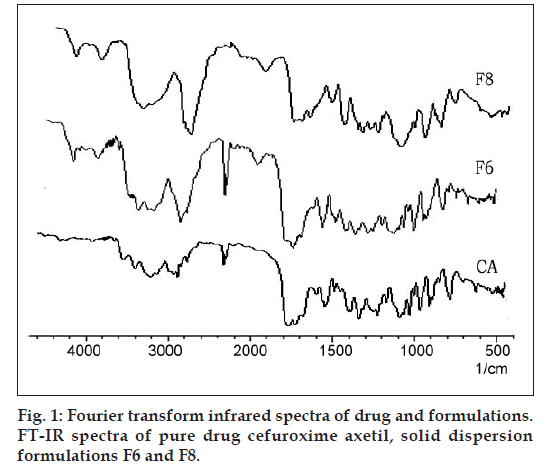
Infrared spectra of CA as well as its SDs F6 and F8 are presented in fig. 1. CA alone shows two carbonyl absorption bands at 1681 cm–1, assigned to amide carbonyl stretching. There were two absorption peak at 3483 cm–1 and 1778 cm–1, assigned to secondary N‑H stretching vibration and a C=O stretching of vinyl ester, which remained unchanged in case of SDs. Hence there is no interaction between CA and excipients used in the present research.
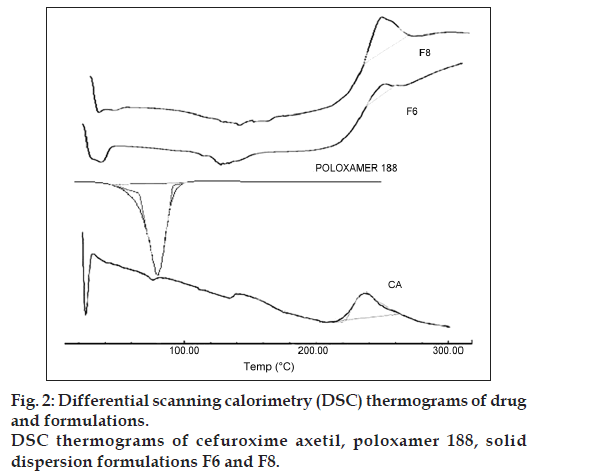
Fig. 2 represents the DSC thermograms of CA, poloxamer 188 and SDs of CA (formulation F6 and F8). The DSC thermogram of CA exhibited a broad exothermic peak at 237.71° (ΔHfus) with onset at 202° and latent heat of fusion (ΔHfus) was found to be 49.92 mJ, indicated the amorphous nature of the drug. Whereas, the DSC thermogram of poloxamer 188 exhibited an endothermic peak at 55.46° with (ΔHfus) –378.39 mJ. However, the DSC thermograms of F6 showed similar exothermic peak at 246° with increased (ΔHfus) 105.8 mJ. Formulation F8 showed exothermic peak at 237.9° with higher value of (ΔHfus) 681.46 mJ clearly indicated the formation of SD and the drug is in the amorphous state. This also suggests that the drug might have formed complex in the carrier during thermal analysis [22].
The phase‑solubility diagram investigated in distilled water was linear (r2=0.984) with respect to the increase weight fraction of the poloxamer 188 (0, 0.25, 0.5, 0.75 and 1% w/v) indicating the solvent properties of poloxamer 188 for CA, giving AL type solubility diagrams (Table 2). The values of the stability constant depend on slope values. The greater the value of the slope, the greater is the capacity of the polymer to solubilize the drug. The stability constant values vary slightly with poloxamer 188 concentration. These results agree with the well‑established formation of soluble complexes between the water‑soluble polymeric carriers and poorly water‑soluble drugs [23]. Increased solubility may be due to the improved wettability of the CA particles in aqueous solution of Poloxamer 188 [24]. Table 2 presents the values of the Gibbs free energy associated with the aqueous solubility of CA in the presence of poloxamer 188. The ΔGtr° values are all negative for poloxamer 188 at various concentrations, indicating the spontaneous nature of solubilization [25]. Gibbs free energy decreased with increase in concentration of poloxamer 188 demonstrating that the reaction became more favourable as the concentration of poloxamer 188 increased.
From the solubility data we can infer that there is a 12‑ and 14‑fold increase in solubility of the CA in formulation F6 and F8, respectively (Table 1). The improved solubility of CA from SDs prepared using FM can be explained by the combined effect of surface activity, solubilisation and wetting effect of poloxamer 188 [26] whereas, the solubility of CA increased 2 more fold in formulation F8 prepared by FSAM. This is due to increase in effective surface area by Neusilin US2.
Drug content values (95‑98.6%) ensured uniform mixing of CA, poloxamer 188, Neusilin US2 (Table 3). Although, SDs prepared by FM have the potential to enhance dissolution of poorly water‑soluble drugs, but have some challenging factors like difficulty in pulverization and poor flow ability of SDs. The values of angle of repose, C.I and H.R for CA, PMs and SDs (Table 3) revealed that the flowability and compressibility improved significantly in F7‑F10 formulations. Formulations showed that the SDs of CA and poloxamer 188 (F1‑F6) were sticky with poor flowability. Addition of Neusilin US2 by FSAM helped in converting the poloxamer 188 based waxy dispersions into freely flowable SDs. This was attributed to high oil adsorption capacity, high specific surface area of Neusilin US2 [27]. Formulation F8 containing Neusilin US2, 50% of the quantity of Poloxamer 188 was found to be minimum quantity to achieve the desired flowability.
| Formulation | Drug content | Angle of repose | Carr’s index | Hausner’s | Kawakita compressibility | Kawakita cohesiveness |
|---|---|---|---|---|---|---|
| code | (%) | (°) | (%) | ratio | (a) | (1/b) |
| CA | 42 ± 1.2 | 29 ± 0.9 | 1.46 ± 0.2 | 0.265 ± 0.2 | 14.36 ± 0.9 | |
| PM1 | 98.6 ± 1.1 | 31 ± 1.1 | 20 ± 0.8 | 1.27 ± 0.3 | 0.184 ± 0.3 | 9.32 ± 0.8 |
| F1 | 93.6 ± 2.1 | 39 ± 1.6 | 29 ± 0.5 | 1.41 ± 0.5 | 0.258 ± 0.4 | 13.2 ± 0.8 |
| F2 | 96.9 ± 1.4 | 38 ± 0.8 | 29.5 ± 0.8 | 1.43 ± 0.3 | 0.265 ± 0.1 | 13.9 ± 0.7 |
| F3 | 97.6 ± 1.2 | 38 ± 2.3 | 29 ± 1.3 | 1.43 ± 0.5 | 0.268 ± 0.2 | 14.3 ± 0.8 |
| F4 | 98.3 ± 2.7 | 40 ± 1.6 | 30 ± 1.2 | 1.42 ± 0.2 | 0.271 ± 0.2 | 16.2 ± 0.7 |
| F5 | 95.4 ± 3.5 | 37 ± 1.1 | 30.5 ± 0.8 | 1.34 ± 0.4 | 0.278 ± 0.3 | 16.9 ± 0.7 |
| F6 | 96.3 ± 2.8 | 38 ± 1.5 | 30 ± 0.6 | 1.48 ± 0.3 | 0.289 ± 0.5 | 17.6 ± 0.9 |
| PM2 | 98.3 ± 1.3 | 26 ± 0.7 | 15.7 ± 0.2 | 1.23 ± 0.2 | 0.162 ± 0.4 | 8.69 ± 0.6 |
| F7 | 97.4 ± 1.1 | 34 ± 1.2 | 22.4 ± 0.5 | 1.31 ± 0.6 | 0.113 ± 0.2 | 6.32 ± 0.5 |
| F8 | 98.3 ± 2.4 | 26 ± 1.2 | 16 ± 0.7 | 1.22 ± 0.2 | 0.098 ± 0.3 | 2.36 ± 0.7 |
| F9 | 98.2 ± 1.5 | 25 ± 1.1 | 18 ± 0.6 | 1.23 ± 0.3 | 0.089 ± 0.2 | 2.23 ± 0.8 |
| F10 | 97.4 ± 1.6 | 25 ± 0.5 | 17 ± 0.8 | 1.23 ± 0.4 | 0.097 ± 0.6 | 2.12 ± 0.8 |
The values are expressed as mean ± SD, n‑6, CA=Cefuroxime Axetil, PM1=First physical mixture, PM2=Second physical mixture.
Table 3: Drug Content and Micromeritics Properties of Cefuroxime Axetil, Physical Mixtures and Solid Dispersions.
The constants, a and 1/b, of the Kawakita equation for CA, PMs and SDs were resolved from the slope and intercept of the line plot of N/C versus N, are shown in Table 3. The lower value of a for the SDs by FSAM (F7‑F10) revealed better flowability than CA, PM and SDs by FM (F1‑F6). Whereas, lower value of 1/b for SDs (F7‑F10) showed that it is less cohesive than CA, PM and SDs by FM (F1‑F6) [28,29].
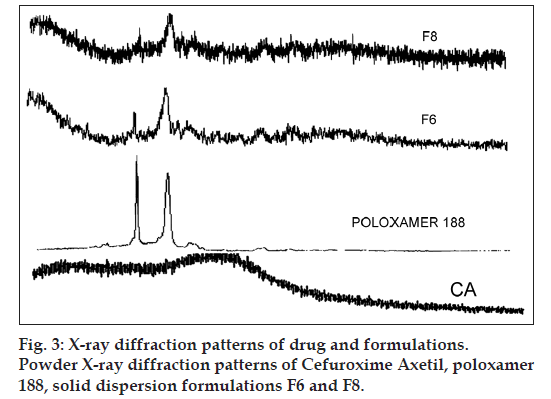
The PXRD patterns of CA, poloxamer 188, F6 and F8 are depicted in fig. 3. The XRD pattern of CA showed absence of significant sharp peaks indicated that the drug is in amorphous state, which has agreement with DSC. The diffraction pattern of poloxamer 188 exhibited intensity peaks at 2θ values of 19.41° and 23.7°. However, the XRD pattern of SDs of F6 and F8 showed characteristic reduced intensity of peaks for poloxamer 188 due to presence of Neusilin US2 (fig. 3) and no new intensity peaks were observed. The presence of Neusilin US2 could less likely promote the reversion of the amorphous drug CA to crystalline state on storage of the SD [15,30]. This confirmed that the CA is present in amorphous state in SD, and there was no chemical interaction of CA with functional excipients used. The presence of amorphous nature of CA in the prepared SDs ratified the solubility enhancement potential of excipients used for preparation of SDs.
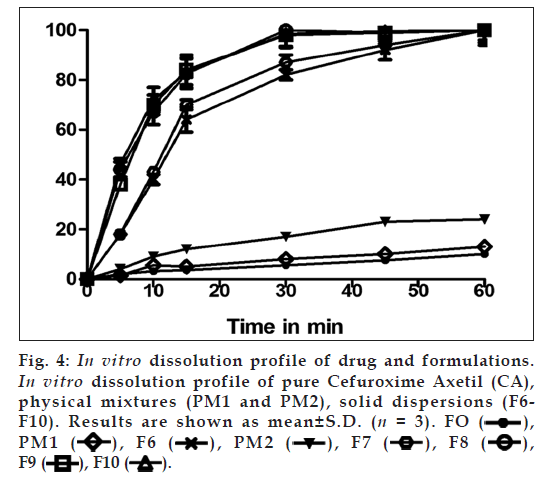
As shown in fig. 4, the dissolution profile of CA alone and that from PM1 is almost similar whereas PM2 the dissolution rate increase was not significant. This suggests that simply having poloxamer 188 and Neusilin US2 in the dissolution medium does not cause the dissolution enhancement of the drug. The SDs of CA by FM (F1‑F6) and FSAM (F7‑F10) has shown a significant enhancement in dissolution characteristics compared to pure drug CA and PMs. The time taken to release 50% of CA (T50%) was greater than 1 h for pure drug CA, PM1, PM2, F1 and F2 whereas lowest time was observed for formulation F8, F9 and F10 i.e., around 5.6 min. The percent drug released from CA at 15 min (Q15 min) was found to be 3.6%. As the proportion of poloxamer 188 increased in SDs prepared by FM (F1‑F6), Q15 value increased from 4‑ to 18‑fold. In order to further improve the dissolution and flow properties, Neusilin US2 was added by FSAM. The Q15 values showed 20, 23, 23 and 23‑fold improvement in dissolution rate for SDs F7, F8, F9 and F10, respectively. This revealed that when the proportion of Neusilin US2 increased from 0.25 parts (F7) to 0.5 parts (F8), a significant improvement in dissolution rate (3 more fold) was observed. However, further increase in proportion of Neusilin US2 (F9 and F10) did not show any further improvement in dissolution rate. Hence, 0.5 parts was found to be the optimum quantity. This observation indicated the drug dissolution from all the SDs is occurring from discretely suspended or deposited (monodisperse) particles. This might have also contributed to the enhanced dissolution rate of the SDs [31]. Correlation coefficient for Hixson Crowell’s equation was higher for formulations F7‑F10, suggesting that the rate of dissolution increased with time due to increase in surface area. DE at 15 min (DE15) of SDs (F6) prepared by FM was improved from 2% (CA) to 32.5% which was more than 16‑fold increase. Similarly, DE at 15 min (DE15) of SDs (F8) prepared by FSAM was improved from 2% (CA) to 41%, which was more than 20‑fold increase. The MDT for CA is 28.5 min; it decreased to 16.68 and 10.12 min for F6 and F14, respectively. The above data are shown in Table 4. This suggests that dissolution of CA from these two formulations was faster compared to other formulations. The observed enhancement in dissolution rate for SDs by FSAM may be attributed to the effects of poloxamer 188 and Neusilin US2. Poloxamer 188 increases dissolution rate by the combined action of surface activity, solubilisation and wetting effect [26]. Simultaneous presence of Neusilin US2 increases the effective surface area over, which the drug is spread leading to rapid desorption of drug with exposure to dissolution medium [13].
| Formulation code |
% DE | % DE | MDT(min) | Q15 min | T50 | Hixson Crowell’s (rL) |
|---|---|---|---|---|---|---|
| CA | 2 | 3.5 | 28.5 | 3.6 | * | 0.912 |
| PM1 | 2.1 | 3.5 | 25.04 | 5 | * | 0.923 |
| F1 | 7.6 | 9 | 18.98 | 15 | * | 0.924 |
| F2 | 10.5 | 14.5 | 15.88 | 21 | * | 0.935 |
| F3 | 17.5 | 20 | 23.4 | 37 | 45 | 0.956 |
| F4 | 22.5 | 25.5 | 20.16 | 45 | 30 | 0.946 |
| F5 | 26.7 | 37.5 | 16.76 | 54 | 14.5 | 0.927 |
| F6 | 32.5 | 40.5 | 16.68 | 64 | 13.5 | 0.945 |
| PM2 | 5.7 | 9.3 | 20 | 12 | * | 0.958 |
| F7 | 31.5 | 41 | 14.85 | 70 | 13 | 0.997 |
| F8 | 41 | 49.6 | 10.125 | 82.5 | 5.7 | 0.998 |
| F9 | 41 | 49.8 | 10.35 | 84 | 5.6 | 0.997 |
| F10 | 41 | 49.5 | 10.35 | 83 | 5.4 | 0.996 |
*50% of Cefuroxime Axetil was not released during 1 h of dissolution study, CA=Cefuroxime Axetil, PM1=First physical mixture, PM2=Second physical mixture, MDT=Mean dissolution time, DE=Dissolution efficiency
Table 4:Dissolution Parameters of Drug, Physical Mixture and Solid Dispersions.
Stability studies SD formulation F8 did not show any significant change in appearance, drug content and in vitro drug release at 30 min at P<0.01 level. Hence, stability study for 6 months indicates that CA is stable in presence of poloxamer 188, Neusilin US2.
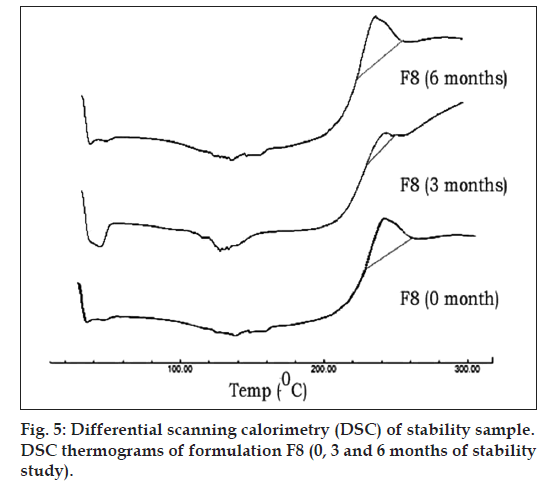
Fig. 5 represents DSC thermograms of optimized formulation F8 (0, 3 and 6 mo of storage at 45°C with 75% RH). There was no influence of storage time as well as storage conditions on the peak temperatures of this drug in the SD (F8). Adsorption of melt dispersions on to the surface of Neusilin US2 also helps in retaining the amorphous nature of drug [32].
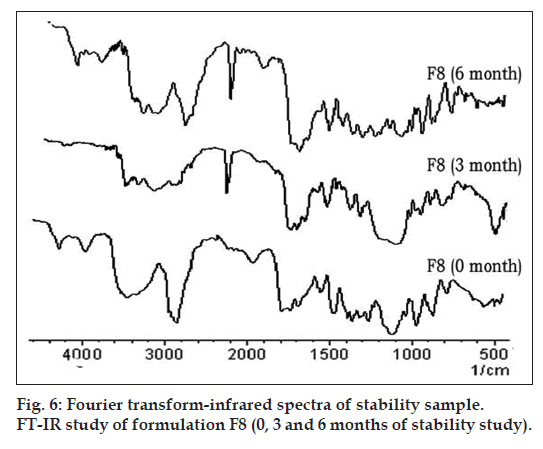
Fig. 6 represents the FT‑IR spectra of optimized formulation F8 (0, 3 and 6 mo of storage at 45º with 75% RH). Two absorption peaks at 3483 cm–1 and 1778 cm–1, assigned to secondary N‑H stretching vibration and a C=O stretching of vinyl ester, which remained unchanged in 3 and 6 months samples. Hence in formulation F8, CA is stable under the above storage conditions.
Hence from the above research work, it may be concluded that a combination of fusion and surface adsorption can be used to enhance the dissolution of a poorly water soluble drug CA. Poloxamer 188 plays a significant role in enhancement of drug solubility and dissolution. The surface adsorbent, Neusilin US2, may be used to impart good flow and compressibility to SDs. Further Neusilin US2 also improves dissolution rate by increasing effective surface area. This combined approach of fusion and surface adsorption can be used successfully to improve the dissolution rate of poorly soluble BCS class II drug CA.
Acknowledgements
The authors gratefully acknowledges Government of India, Department of Science and Technology, New Delhi, India, for the award of the INSPIRE fellowship as Junior Research Fellow during her PhD program. The authors would also thank SAIF, Punjab University for conducting PXRD study.
References
- Al‑Hamidi H, Edwards AA, Mohammad MA, Nokhodchi A. To enhance dissolution rate of poorly water‑soluble drugs: Glucosamine hydrochloride as a potential carrier in solid dispersion formulations.
- Colloids Surf B Biointerfaces 2010;76:170‑8. Martindale. The Extra Pharmacopoeia. 36th ed. London: The Pharmaceutical Press; 2009. p. 238‑9.
- Aguiar AJ, Zelmer JE, Kinkel AW. Deaggregation behavior of a relatively insoluble substituted benzoic acid and its sodium salt. J Pharm Sci 1967;56:1243‑52.
- Serajuddin AT. Solid dispersion of poorly water‑soluble drugs: Early promises, subsequent problems, and recent breakthroughs. J Pharm Sci 1999;88:1058‑66.
- Leuner C, Dressman J. Improving drug solubility for oral delivery using solid dispersions. Eur J Pharm Biopharm 2000;50:47‑60.
- Sugimoto M, Okagaki T, Narisawa S, Koida Y, Nakajima K. Improvement of dissolution characteristics and bioavailability of poorly water‑soluble drugs by novel cogrinding method using water‑soluble polymer. Int J Pharm 1998;160:11‑9.
- Sheen PC, Khetarpal VK, Cariola CM, Rowlings CE. Formulation studies of a poorly water‑soluble drug in solid dispersions to improve bioavailability. Int J Pharm 1995;118:221‑7.
- Collett JH, Popli H, Kibbe AH. Poloxamer. In: Handbook of Pharmaceutical Excipients. 3rd ed. London: Pharmaceutical Press; 2000. p. 386‑8.
- Newa M, Bhandari KH, Li DX, Kwon TH, Kim JA, Yoo BK, et al. Preparation, characterization and in vivo evaluation of ibuprofen binary solid dispersions with poloxamer 188. Int J Pharm 2007;343:228‑37.
- Singhare DS, Khan S, Yeole PG. Poloxamers: Promising block co‑polymers in drug delivery. Indian J Pharm Sci 2005;67:523‑31.
- Chutimaworapan S, Ritthidej GC, Yonemochi E, Oguchi T, Yamamoto K. Effect of water ‑soluble carriers on dissolution characteristics of nifedipine solid dispersions. Drug DevInd Pharm 2000;26:1141‑50.
- Karekar P, Vyas V, Shah M, Sancheti P, Pore Y. Physicochemical investigation of the solid dispersion systems of etoricoxib with poloxamer 188. Pharm DevTechnol 2009;14:373‑9.
- Gupta MK, Goldman D, Bogner RH, Tseng YC. Enhanced drug dissolution and bulk properties of solid dispersions granulated with a surface adsorbent. Pharm DevTechnol 2001;6:563‑72.
- Chuang IS, Maciel GE. A detailed model of local structure and silanol hydrogen bonding of silica gel surfaces. J PhysChem B 1997;101:3052‑64.
- Bahl D, Bogner RH. Amorphization of Indomethacin by Co‑Grinding with Neusilin US2: Amorphization kinetics, physical stability and mechanism. Pharm Res 2006;23:2317‑25.
- Higuchi T, Connors K. Phase‑solubility techniques. Adv Anal ChemInstrum 1965;4:117‑23.
- Hecq J, Deleers M, Fanara D, Vranckx H, Amighi K. Preparation and characterization of nanocrystals for solubility and dissolution rate enhancement of nifedipine. Int J Pharm 2005;299:167‑77.
- Wells JI, Aulton ME. Pharmaceutical preformulation. In: Aulton ME, editors. Aulton?s Pharmaceutics: The Design and Manufacture of Medicines. 3rd ed. UK: Churchill Livingstone; 2007. p. 355‑7.
- Yamashiro M, Yuasa Y, Kawakita K. An experimental study on the relationships between compressibility, fluidity and cohesion of powder solids at small tapping numbers. Powder Technol 1983;34:225‑31.
- Khan KA. The concept of dissolution efficiency. J Pharm Pharmacol 1975;27:48‑9.
- Arias MJ, Ginés JM, Moyano JR, Rabasco AM. Dissolution properties and in vivobehaviour of triamterene in solid dispersions with polyethylene glycols. Pharm ActaHelv 1996;71:229‑35.
- Damian F, Blaton N, Kinget R, Van den Mooter G. Physical stability of solid dispersions of the antiviral agent UC‑781 with PEG 6000, Gelucire 44/14 and PVP K30. Int J Pharm 2002;244:87‑98.
- Cirri M, Mura P, Rabasco AM, Ginés JM, Moyano JR, Gònzalez‑Rodrìguez ML. Characterization of ibuproxam binary and ternary dispersions with hydrophilic carriers. Drug DevInd Pharm2004;30:65‑74.
- Ghareeb MM, Abdulrasool AA, Hussein AA, Noordin MI. Kneading technique for preparation of binary solid dispersion of meloxicam with poloxamer 188. AAPS PharmSciTech 2009;10:1206‑15.
- Mura P, Manderioli A, Bramanti G, Ceccarelli L. Properties of solid dispersions of naproxen in various polyethylene glycols. Drug DevInd Pharm 1996;22:909‑16.
- Passerini N, Albertini B, González‑Rodríguez ML, Cavallari C, Rodriguez L. Preparation and characterisation of ibuprofen‑poloxamer 188 granules obtained by melt granulation. Eur J Pharm Sci 2002;15:71‑8.
- Fuji Chemical Industry Co. Ltd. Technical Newsletter, 2008. Available from: http://www. fujichemical.co.jp/english/neusilin.html. [Last accessed 11 Dec 2011].
- Singh SP, Patra CN, Dinda SC. A systematic study on processing problems and in vitro release of SaracaindicaCaesalpiniaceae bark powder tablets. Trop J Pharm Res 2012;13:387‑95.
- PatraChN, Pandit HK, Singh SP, Devi MV. Applicability and comparative evaluation of wet granulation and direct compression technology to Rauwolfiaserpentina root powder: A technical note. AAPS PharmSciTech 2008;9:100‑4.
- Bahl D, Hudak J, Bogner RH. Comparison of the ability of various pharmaceutical silicates to amorphize and enhance dissolution of indomethacin upon co‑grinding. Pharm DevTechnol 2008;13:255‑69.
- Rao KR, Nagabhushanam MV, Chowdary KP. In vitro dissolution studies on solid dispersions of mefenamic acid. Indian J Pharm Sci2011;73:243‑7.
- Miura H, Kanebako M, Shirai H, Nakao H, Inagi T, Terada K. Enhancement of dissolution rate and oral absorption of a poorly water‑soluble drug, K‑832, by adsorption onto porous silica using supercritical carbon dioxide. Eur J Pharm Biopharm 2010;76:215‑21
 ), PM1 (
  ), F6 (
  ), PM2 (
 ), F7 (
 ), F8 (
  ), F9 (
 ), F10 (
 ).
).