- *Corresponding Author:
- D. Ramadon
Faculty of Pharmacy, Universitas Indonesia, Kampus Baru UI Depok, West Java, 16424, Indonesia
E-mail: delly.ramadon@farmasi.ui.ac.id
| Date of Submission | 18 October 2016 |
| Date of Revision | 29 March 2017 |
| Date of Acceptance | 28 September 2017 |
| Indian J Pharm Sci 2017;79(6): 948-956 |
This is an open access article distributed under the terms of the Creative Commons Attribution-NonCommercial-ShareAlike 3.0 License, which allows others to remix, tweak, and build upon the work non-commercially, as long as the author is credited and the new creations are licensed under the identical terms
Abstract
Quercetin has been widely used to treat many diseases because of its high antioxidant activity. However, it has low oral bioavailability and penetration through the skin. The aim of this research was to enhance penetration and bioavailability of quercetin using transdermal ethosomal gel. Three ethosomal formulae, E1 (1%), E2 (1.5%) and E3 (2%) with different concentration of quercetin were prepared using thin-film hydration method. Their physical properties were characterized, and then a selected ethosomal formula was incorporated into a gel dosage form. Two gels, one ethosomal and the other non-ethosomal were prepared. In vitro penetration using Franz diffusion cells and bioavailability study in Sprague Dawley male rats were carried out. Results showed that E2 was the chosen formula to be incorporated into the gel dosage form. According to the in vitro penetration study, the diffusion flux of quercetin from the ethosomal and non-ethosomal gels were 343.35±17.69 ng/cm2/h and 120.68±11.92 ng/cm2/h, respectively (P<0.05). In the bioavailability study, ethosomal gel showed higher maximum concentration (Cmax) and area under curve (AUC0-t) when compared to non-ethosomal gel and oral suspension. Cmax from the ethosomal gel, non-ethosomal gel, and oral suspension were 413.49±28.64 ng/ml, 189.46±49.68 ng/ml, and 61.92±14.31 ng/ml, respectively (P<0.05). AUC0-t from the ethosomal gel, non-ethosomal gel, and oral suspension were 4035.15±560.60, 584.87±265.46, and 431.21±239.85, respectively (P<0.05). In conclusion, ethosomal gel could increase penetration and bioavailability of quercetin compared to non-ethosomal gel.
Keywords
Bioavailability, ethosomes, ethosomal gel, quercetin, transdermal, in vitro penetration
Nowadays natural products from herbal medicines are used to treat many diseases [1]. One of the secondary metabolites of herbal medicine with many advantages are flavonoids [2]. Flavonoids can be found in many vegetables and fruits such as onion, apple, grapes and broccoli [3,4]. Quercetin (QC) is a flavonoid that can be used in disease prevention because it has a high antioxidant activity [5-7]. QC protects cells from free radicals and increases the integrity of the cells [6,7]. QC is mostly consumed orally. However, QC has low oral bioavailability [2]. For instance, its absorption in the gastrointestinal tract (GIT) is low due to low solubility in water [8]. Also, QC is metabolized immediately through enzymatic hydrolysis [9] in GIT when administered orally. It is also glucuronidated, sulphated and methylated [8-10]. More than 95 % of QC absorbed is metabolized by hepatic metabolism [6,10] and is eliminated from the intestinal cells through an efflux pump mechanism [10]. The absolute bioavailability of QC in rats and human after oral administration of aglycone QC are 16 and 44.8 %, respectively [10].
Transdermal drug delivery systems (TDDS) have the potential to overcome these problems [11]. However, composition and structure of the skin make them as the first barrier for many drugs to cross into the systemic circulation [12,13]. Synthesizing nanoparticles or nanovesicles is one of the methods that has been used to increase drug penetration through the skin [11]. Ethosomes are nanovesicles with high potential to increase the penetration of drugs [14]. Ethosomes entrap drugs and assist them to reach the systemic circulation since they are made up of phospholipids, water and high concentration of ethanol (20-50 %) [11,15-17]. Furthermore, ethosomes can entrap many kinds of drugs, not only hydrophilic drugs such as bupropion hydrochloride [18] and salbutamol sulfate [19], but also hydrophobic drugs like piroxicam [20], carvedilol [21], finasteride [22] and clotrimazole [23]. Also, ethosomes can be used to increase the bioavailability of natural products [24]. For instance, in previous studies, ethosomes were used to enhance penetration of ligustrazine [25] and alkaloids from Sophora alopecuroides [26]. Thus, this drug delivery system is likely to increase the penetration of QC through the skin.
Studies related to topical or dermal formulation of QC were done by formulating QC into gel, emulgel and microemulsion gel [27], microneedles, lipid microparticles [28] and nanocrystals [29]. A previous study on QC ethosomes by Park et al. [30] in which QC was formulated into ethosomes to enhance its skin deposition. However, they only obtained permeation and skin deposition data. In this investigation, QCloaded ethosomes was prepared, characterized and incorporated into a gel dosage form. Physical properties of gels made were evaluated too. Additionally, in vitro penetration test and bioavailability study in rats were performed. The previous QC bioavailability studies were only done through the oral, intravenous or other parenteral routes [31-37]. Davies and Yaniez [32], stated that until 2013, no one had tested the pharmacokinetics of QC from a transdermal dosage form, either in animals or humans. Therefore, it is necessary to do a bioavailability study for a QC transdermal dosage form. The aim of this study was to increase the penetration and bioavailability of QC using ethosomes.
Materials and Methods
QC was purchased from Sigma-Aldrich (Singapore). Hydrogenated phosphatidylcholine (Phospholipon 80H®) was gifted by Lipoid GmBH (Germany). Ethanol 96 % and dichloromethane were purchased from Merck (Germany). Excipients used in gel formulation such Carbopol 940® were obtained from Lubrizol. Acetonitrile of high-performance liquid chromatography (HPLC)-grade was obtained from Merck (Germany). All other solvents and reagents were analytical grade (Sigma).
Preparation of QC ethosomes
QC ethosomes was prepared by using thin-film hydration method according to Park et al. [30]. Three ethosomal formulae were presented in Table 1. Phospholipon 80 H (2 %) was dissolved in 25 ml dichloromethane, while QC (1-2 %) was dissolved in 45 ml ethanol. Then, both solutions were mixed. The mixture was evaporated in a rotary evaporator at a temperature of 40° (150 rpm) for 30 min, and solvent traces were removed. The thin film of ethosomes was hydrated with phosphate buffer solution pH 5.0 in a round bottom flask using rotary evaporator at a temperature of 37° without vacuum for 10 min. After that, suspension obtained was sonicated by using a probe sonicator for 20 min at room temperature.
| Composition | Concentration (%w/v) | ||
|---|---|---|---|
| E1 | E2 | E3 | |
| Quercetin | 1 | 1.5 | 2 |
| Phospholipon 80H® | 2 | 2 | 2 |
| Ethanol | 20 | 20 | 20 |
| Propylene glycol | 5 | 5 | 5 |
| Phosphate buffer solution pH 5.0 | ad 100 | ad 100 | ad 100 |
Table 1: Quercetin Ethosome Formula
Determination of entrapment efficiency (% EE)
The % EE of ethosomes suspension was measured using a direct method. Each ethosomal suspension was centrifuged 14 000 rpm (30 min) for two times (Spectrafuge 16 M, Labnet, USA). After being centrifuged, the supernatant was removed, while the precipitated ethosomes was collected and ruptured by adding methanol. QC was analysed by using reversed phase HPLC with maximum wavelength at 370 nm. The % EE was calculated using the following Eqn.: % EE=Cp/Cs×100, where Cp is QC concentration in the precipitated ethosomes, and Cs is QC concentration in the ethosomes suspension.
Characterization of particle size, polydispersity index, and zeta potential
The physical properties, including particle size, polydispersity index, and zeta potential were measured using a particle size analyser (PSA) type ZS Malvern (United Kingdom) at room temperature [38]. All determinations were performed in triplicate.
Morphology of vesicle chosen
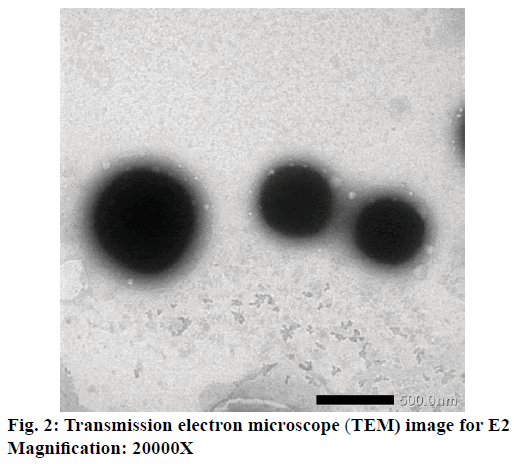
Morphology of selected vesicle (E2), was performed by using transmission electron microscope (TEM). Samples were prepared using 1 % phosphotungstic acid buffer (pH 6.0) at room temperature. Samples were viewed with a Philips TEM Jeol JEM 1400 electron microscope (USA), with an accelerating voltage of 100 kV [39].
Formulation of gel dosage forms
The chosen ethosomal formula (E2) was incorporated into a gel dosage form. There were two gels prepared as shown in Table 2. Both gels were prepared using Carbopol 940® as a gelling agent. Triethanolamine was added to neutralize the pH of carbomer and obtain high viscous gel base [40]. The ethosomes chosen (E2) was incorporated into the gel and mixed by using homogenizer at 500 rpm (20 min) to get ethosomal gel (EG). On the other hand, the non-ethosomal gel (NEG) was prepared by mixing QC into a gel base without any treatments.
| Compositions | Formula (% w/w) | |
|---|---|---|
| EG | NEG | |
| QC-ethosome suspension | Equivalent to QC 5 mg/g | - |
| Quercetin | - | Equivalent to QC 5 mg/g |
| Carbopol 940® | 1.00 | 1.00 |
| Triethanolamine | 0.50 | 0.50 |
| Propylen glycol | 7.5 | 7.5 |
| Phosphate buffer solution pH 5.0 | ad 100 | ad 100 |
Table 2: Ethosomal and Non-Ethosomal Gel Formulae
Physical stability test
Physical stability study of gels was done by storing the gels prepared at different temperatures, i.e. low (4±2°), room (28±2°) and high temperature (40±2°) for 12 w. Both of gels were evaluated their organoleptic, homogeneity, and pH (pH meter Eutech Instrument, Singapore) every two weeks. Additionally, viscosity and rheological properties using Brookfield viscometer (Brookfield, USA) were observed at the first and twelfth week. A cycling test for six cycles was also performed.
Experimental animals
Male Sprague-Dawley rats (200-250 g) were purchased from Badan Penelitian dan Pengembangan Kesehatan (Balitbangkes, Jakarta, Indonesia). They were acclimated for two weeks before the experiment. Rats were housed six rats per cage, maintained at a room temperature of 25±2° and an alternating 12-h light-dark cycle. Rats were given free access to food and water. All animal treatment methods had been approved by the Ethical Committee of Cipto Mangunkusumo Hospital, Faculty of Medicine, Universitas Indonesia with ethical approval Reg. No. 337/UN2.F1/ETIK/2015.
In vitro penetration test
An in vitro penetration test was conducted to determine the effect of ethosomes to the penetration of QC. In this research, male Sprague-Dawley rats were used. Rats were euthanized to obtain their abdominal skin. The rat’s abdominal hair was removed before skin was used. Experiments were run using Franz diffusion cells with receptor compartment containing phosphate buffer solution pH 7.4 mixed with 1 % Tween 80 as medium [41,42]. Abdominal skin of rats (1.77 cm2) was mounted on the receptor compartment with the side facing upwards into the donor compartment and the dermal side facing downwards into the receptor. The temperature was maintained at 37±0.5°. Samples (±1 g) contained 5 mg/g QC were applied onto the skin in the donor compartment. Samples (450 μl) were withdrawn through the sampling port of diffusion cell at 0.5, 1, 1.5, 2, 3, 4, 6, 8, 12 and 24 h. The receptor compartment was immediately replaced with an equal volume of fresh medium. Next, 50.0 μl formic acid 2 % was added to the samples, and then they were analysed by using HPLC at 370 nm.
Bioavailability study
A bioavailability study was performed by grouping rats into three groups. EG was given to the first group, while the second group was the NEG group. The third group was given a QC oral suspension (20 mg/kg). In the first and second group, the abdominal rat’s hair was removed before gel application. The gel was placed inside of O-ring (1.5 cm in diameters). Then, it was put on the rat’s abdominal skin and closed by skin patch to ensure the gel was in the right place for 24 h. Both EG and NEG contained 20 mg/kg body weight of QC. Blood samples (500 μl) were collected at the particular time interval (0, 0.5, 1, 1.5, 2, 3, 4, 6, 8, 12 and 24 h) through orbital veins and stored in a heparinized sample tube. Samples were vortexed, then centrifuged at 5000 rpm for 20 min to separate plasma from the red blood cells, then they were stored in –20° [43].
Sample preparation
Irbesartan solution (0.2 mg/ml) 50.0 μl as an internal standard and 50.0 μl formic acid 2 % were added to plasma samples (200 μl). The mixture was vortexed for 10 s, and 200 μl methanol was added to precipitate the plasma proteins. After that, the samples were vortexed again for 1 min, then centrifuged at 5000 rpm for 10 min. The supernatant (200 μl) was obtained, then 50 μl aliquot was injected into HPLC system to analyse the concentration of QC in rat plasma.
Analysis of QC in rat plasma
HPLC was conducted by using LC-20A Shimadzu series with autosampler and UV/Vis detector (Shimadzu, Japan). QC analysis was carried out on reversed phase column (5 μm Sunfire Waters® C18, 250×4.6 mm), and eluted isocratically, at flow rate of 0.8 ml/min using a mixture of acetonitrile-phosphate buffer (pH 3.0; 45:55) as a mobile phase. Injection volume 50 μl was employed. QC was detected at 370 nm. Calibration curves were linear over the range 15.625-2000 ng/ml, with a correlation coefficient (r) was 0.9999, and lower limit of quantification (LLOQ) was 15.625 ng/ml.
Statistical analysis
Statistical analysis of data was performed using GraphPad Prism 6.0 via unpaired t-tests with significance level was set at P<0.05.
Results and Discussion
One of the best methods to enhance drug penetration is formulating drugs into nanovesicles [44]. In this study, the primary purpose of formulating QC in ethosomes was to overcome its penetration [27] and bioavailability [39] problems. Ahad et al. showed that ethosomes could increase the bioavailability of drugs [39].
In this investigation, QC was incorporated into each ethosomes formula with different concentration ranged from 1-2 %. It was done to know the effect of QC concentration to % EE. The results showed that % EE of E1, E2, and E3 were 95.03±0.24, 97.26±0.09 and 47.71±0.12 %, respectively. The highest % EE was E2, which was twice higher than E3. This result was similar to Park et al. [30], where the increasing amount of QC incorporated into ethosomes would increase the % EE. This phenomenon was related to the ratio of QC and Phospholipon 80H. Increasing the amount of QC without being followed by the addition of Phospholipon 80H® causes low % EE because phospholipid molecules have a maximum capacity to entrap drug molecules. In this research, % EE of E3 (2 % QC) was only 47.71±0.12 %. It showed that maximum entrapment for 2 % Phospholipon 80H was 1.5 % QC. The high concentration of ethanol in ethosomes formula made the vesicle membrane leaky thereby decreased the drug entrapment. Ahad et al. have observed that the increase of drug concentration into the ethosomes could cause leakage of excess drug from the vesicular structure [39]. Thus, propylene glycol was added as a stabilizing agent and penetration enhancer to increase drug penetrated through the skin [45].
Percent EE is also affected by zeta potential of vesicle formula [46]. A good suspension should have a zeta potential value higher than +30 mV or smaller than –30 mV [47]. The significance of the zeta potential exhibits an inherent stability of the colloidal suspension system. If each particle suspension has a zeta potential higher than +30 mV or lower than –30 mV, they would have tend to repel each other, and they would not aggregate to become a larger particle. On the other hand, if the particles have zeta potential between +30 – (–30) mV, then they would come together and flocculate [45,48]. Another research showed that vesicles formula which had zeta potential less than –30 mV would have a high entrapment capacity [45]. Sou [46] found that a negative charge of zeta potential causes an increase of entrapment capacity. Furthermore, he also discovered that an advantage of the estimation of the entrapment capacity as a function of zeta potential is that the zeta potential can be easily observed by measuring electrophoretic mobility [46]. The result in this research was in line with the theory. As seen in Table 3, with the lowest zeta potential among other formulae, E2 had the highest % EE too.
| Formula | D mean volume (nm) | PDI | Zeta potential (mV) |
|---|---|---|---|
| E1 | 96.99±12.43 | 0.833±0.13 | –28.80±0.61 |
| E2 | 128.73±16.35 | 0.545±0.05 | –34.83±0.64 |
| E3 | 476.54±95.76 | 0.881±0.11 | –30.37±0.29 |
Table 3: Physical Characterization of Quercetin-Loaded Ethosomes
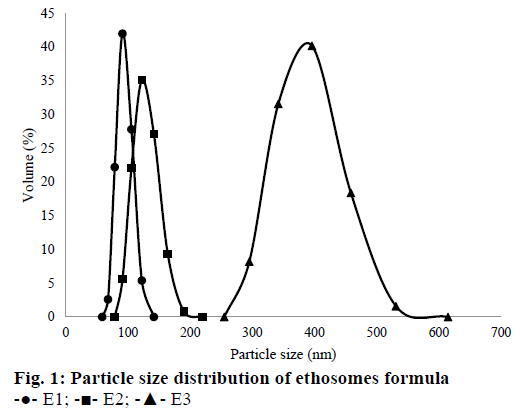
The results of polydispersity index, particle size and zeta potential measurement for each sample were shown in Table 3. Overall, particle size average (Dmean volume) for all formulae were around 96.99- 476.74 nm. E1 had the smallest particle size compared to the other formulae. The increase of amount QC in the suspension would increase the particle size of ethosomes. These results were related to the particle collision in the suspension. Brownian motion makes particles collide and tend to aggregate each other [49]. Particle size distribution of all ethosomes formulas can be seen in Figure 1.
Based on Table 3, the ethosome formula chosen that was incorporated into the gel dosage form, was E2. Even its particle size was not the smallest, but its PDI and zeta potential were the best among other formulae. So that, E2 was observed its morphology by using TEM. It could be seen that E2 had a spherical shape (Figure 2).
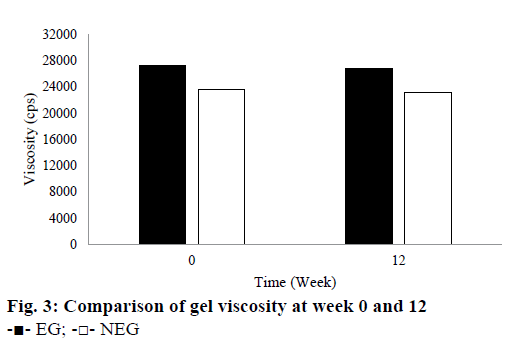
Based on the stability test results, there were not any changes in colour or odour for EG for all temperature storage. However, NEG stored at room and hot temperature showed a slight change in colour in the second and other weeks. Its yellow colour became darker than the first it made. Based on these observations, EG provided a better stability for QC when compared to NEG. The colour change from pale yellow to yellow or dark yellow caused by the instability of QC in NEG. QC is an antioxidant that is susceptible to oxidation and high temperature. Therefore, QC in the NEG was more easily oxidized when it was stored at room and high temperature. The results showed that ethosomes could improve the stability of QC in EG. This result is in line with the theory described by Touitou et al. [14] and Rakesh and Anoop [15] that ethosomes can improve the stability of the active substance because it can shield them directly from the temperature and oxidation exposure. Based on the pH measurement during the 12 w of storage, pH of all gels was in the range of the skin pH. Gels should not be too acidic or alkaline because they can irritate the skin. During the storage at room temperature, pH of all gels decreased slightly. However, pH of all gels was still around 4.5 to 5.62. During 12 w of storage, the viscosity of both gels declined. They were 1.47 % for EG and 1.69 % for NEG as seen in Figure 3. The decrease in viscosity was associated with a reduction in pH of the gel base because the viscosity of carbomer gel was affected by its pH. Its viscosity would decrease when its pH becomes more acidic. However, Rheological properties of the gels did not indicate any changes after 12 w of storage. They tend to have a pseudoplastic thixotropic rheology.
The purpose of the cycling test was to determine the crystallization of drugs and syneresis in the gels. From the evaluation, the results showed that all gels were stable and there were not any colour changes, crystallization, or syneresis. This result revealed that the carbomer could retain the water in the matrix. It could be concluded that the gels were physically stable.
From the in vitro penetration test, EG and NEG performed their ability to enhance the penetration of QC through the rat skin. Rat skin was chosen as the membrane because a rodent’s skin showed the same characteristics as lipids composition in the stratum corneum of human [50]. Receptor compartment was filled by phosphate buffer solution pH 7.4 containing 1 % Tween 80. This medium was chosen because it had been optimized by Casagrande et al. [41], and had been used in many types of research to prove the penetration and permeation of QC from dermal dosage forms [3,42,51]. Hydroalcoholic solution or the addition of solubilizing agent were used to solve the solubility problem of class II Biopharmaceutics Classification System (BCS) drugs to maintain the sink condition [41].
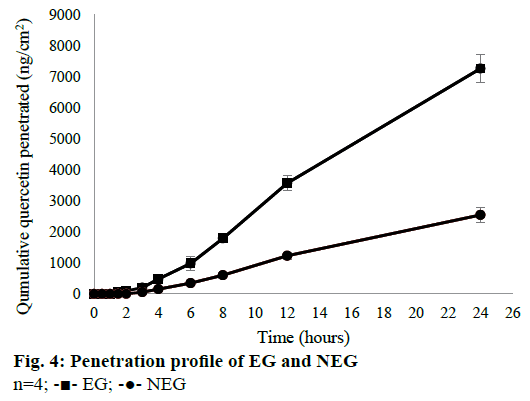
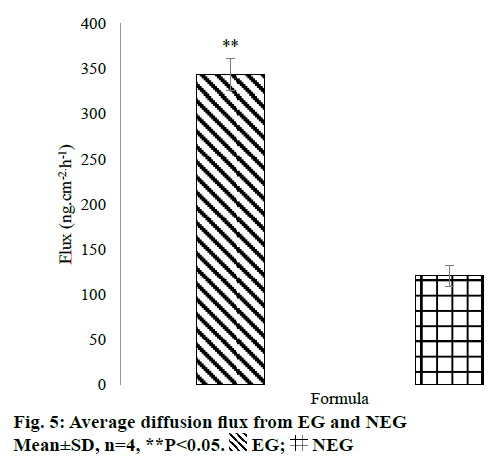
The in vitro penetration test result showed that EG gave higher cumulative amount of QC penetrated than NEG as shown in Figure 4. Diffusion flux for each dosage form was shown in Figure 5. There was a significant difference between EG and NEG for diffusion flux (P=0.0286; P<0.05). The results revealed that EG could increase the penetration of QC through the rat skin compared to NEG. Ethosomes could increase the penetration of QC due to its nano-size and particular composition. The primary content of ethosomes is phospholipid and ethanol. Ethanol increases the elasticity and flexibility of ethosomes so that it can penetrate through the stratum corneum freely [14,15,30]. Also, ethanol can disrupt the lipid bilayer in the stratum corneum [11]. Ethanol provides a higher skin penetration for entrapped molecules compared to conventional liposomes because it facilitates ethosomes penetration [27]. Hatahet et al. stated that even QC is formulated in a lipid nanoparticle, it will not show a transdermal delivery on human skin. Transdermal delivery of QC from a nano dosage form could not be achieved without penetration enhancers. So that, in this formula, ethanol and propylene glycol were used as the enhancers to enhance the penetration of QC.
Ethanol can interact with the polar head group of lipid molecules that causes a decline in the transition temperature of lipids in the stratum corneum. Consequently, there will be an elevation on fluidity of ethosomes and reduction of the density of lipid bilayer. Then, the effect of ethosomes works on the penetration and permeation to the skin, and the next step is the fusion of ethosomes with skin lipids. This stage causes the release of the drugs into the deeper layers of the skin along the penetration pathway [52].
The external phase of the formulation has a significant effect to the releasing of a drug. Hydrophilic gels are known to increase drug release quickly [27]. QC has very limited skin penetration capacity. It is restricted by both insolubilities in water and the hydrophobic partition coefficient (log P=1.82±0.32) due to the nonpolar groups in its structure [53]. Based on the results of Park et al. [30], cumulative amount of QC penetrated from ethanolic solution and distilled water were only 1.4±0.4 and 0.6±0.2 μg/cm2, respectively. These results showed that the cumulative amount QC penetrated would be so small if there were not any treatments or modifications. By formulating QC in the ethosomes, Park et al. could increase the amount penetrated up to 3.6±0.3 μg/cm2. In this study, QC-loaded ethosomes was incorporated into a gel dosage form. This method could increase the amount of QC penetrated up to 7.6±0.4 μg/cm2. This amount was twice higher than the amount of QC penetrated from ethosomes in the reference. The using of gel as vehicle of the ethosomes could give an additional effect to the penetration of QC. This phenomenon was caused by the high content of water from the gel. Water can hydrate the stratum corneum and open its compact structure, then QC penetrates easily through the skin [11].
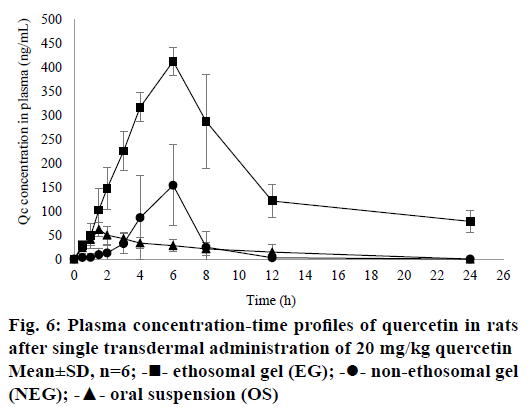
All results for bioavailability study in this research can be seen in Table 4 and plasma concentrationtime profile of QC in rat plasma can be seen in Figure 6. There were significant differences in Cmax (P=0.0022), AUC0-t (P=0.0022) and AUC0-∞ (P=0.0022) of EG when compared to NEG and OS (P<0.05). It can be seen from Table 4 that half-time (t1/2) of EG was longer than NEG and OS. This result was directly related to the maximum concentration achieved of each formula. The higher Cmax of drugs in the circulation, the longer time for the body to eliminate them so that the half-life required will be even longer. In this research, ke was calculated by using PKSolver Software. Results of the bioavailability study showed that ke for EG was lower than NEG, it means that QC released from EG would be eliminated slowly from rat’s circulation. According to the low of ke from EG, it can be concluded that EG was potential as a sustained release dosage form as explained by Pirvu et al. [54]. EG could reduce of both dose and frequency of administration. These benefits may lead to a good compliance of patient, lower cost production, and less of the dose-related side effects [55].
| Parameters | Formula | ||
|---|---|---|---|
| EG | NEG | OS | |
| Cmax(ng/ml) | 413.49±28.64* | 189.46±49.68 | 61.92±14.31 |
| tmax(h) | 6.0±0.0 | 6.0±0.0 | 1.5±0.0 |
| AUC0-t(ng.h/ml) | 4035.15±560.60* | 584.87±265.46 | 431.21±239.85 |
| AUC0-∞(ng.h/ml) | 5242.63±985.67* | 685.64±361.69 | 545.79±255.56 |
| ke | 0.08±0.03* | 0.22±0.04 | 0.19±0.05 |
| t1/2(h) | 10.28±3.42* | 3.15±0.44 | 3.78±1.09 |
Table 4: Pharmacokinetic Parameters from Bioavailability Study
These results showed that QC given transdermally could provide greater bioavailability compared to the oral administration. Oral absorption of QC is very low because QC is very rapidly metabolized by first-pass metabolism [3]. Additionally, QC consumed orally will be hydrolysed by enzymatic reaction or by microbes followed by glucuronidation, sulfation or methylation. Therefore, compounds with prominent level that could be measured in plasma are inactive metabolites instead of QC. However, the analysis of QC metabolites in rat’s plasma was not conducted in this study because this study focused on proving that the transdermal administration of QC may increase the bioavailability in the body.
The bioavailability of QC could be increased by choosing a better administration route. This study showed that by formulating QC into a transdermal gel, the bioavailability of QC increased significantly (P<0.05). When QC administered orally, as mentioned above, it would be metabolized immediately. On the other hand, the QC penetrated from NEG could pass the hepatic metabolism and be distributed directly to the circulation to all parts of the body. So, transdermal could be an alternative route to enhance the bioavailability of drugs. However, when NEG was compared to EG, its Cmax was not higher than EG. These results revealed that formulating QC into a gel dosage form was not enough to increase the bioavailability of a drug. Many types of research have shown that the bioavailability of drugs could be improved by entrapping them in submicron vesicles [46]. By entrapping QC into the ethosomes, it could rise the Cmax and AUC of QC in the rat’s plasma. As explained in the in vitro penetration results, ethosomes could enhance the penetration of QC by its deformability and flexibility to penetrate through the skin. Thus, its bioavailability could significantly increase when compared to NEG (P<0.05).
Results of the bioavailability study were in line with the results of the in vitro penetration test. EG provided higher amount of QC penetrated when compared to NEG in both tests. It was proved that the smaller drug particles are, the higher their penetration and plasma concentration. Based on those results, ethosomes could increase the penetration and plasma concentration of QC. Taken together, these results demonstrated that EG performed better than NEG.
Acknowledgements
The authors thank Dr. Abdul Mun’im who helped and contributed to this research.
Financial assistance
The authors also gratefully acknowledge the financial support for this study by Universitas Indonesia Grant Research, especially for Postgraduate Grant Research 2015 (No. 1665/UN2/RI2/HKP.05.00/2015).
Conflict of interest
There are no conflicts of interest.
References
- Saraf AS. Applications of novel drug delivery system for herbal formulations. Fitoterapia 2010;81(7):680-9.
- Walle T. Absorption and Metabolism of Flavonoids. Free Radic Biol Med 2004;36(7):829-37.
- Bose S, Du Y, Takhistov P, Michniak-Kohn B. Formulation optimization and topical delivery of quercetin from solid lipid based nanosystems. Int J Pharm 2013;441:56-66.
- Leiherer A, Mündlein A, Drexel H. Phytochemicals and their impact on adipose tissue inflammation and diabetes. Vascul Pharmacol 2013;58:3-20.
- Tapas AR, Sakarkar DM, Kakde RB. Flavonoids as Nutraceuticals : A Review. Trop J Pharm Res 2008;7:1089-99.
- Kelly GS. Quercetin. Altern Med Rev 2011;16(2):172-94.
- Russo M, Spagnuolo C, Tedesco I, Bilotto S, Russo GL. The flavonoid quercetin in disease prevention and therapy : Facts and fancies. Biochem Pharmacol 2012;83(1):6-15.
- Chen C, Zhou J, Ji C. Quercetin: a potential drug to reverse multidrug resistance. Life Sci 2010;87:333-8.
- Scalbert A, Williamson G. Dietary Intake and Bioavailability of Polyphenols. J Nutr 2000;130(1):2073-85.
- Guo Y, Bruno RS. Endogenous and exogenous mediators of quercetin bioavailability. J Nutr Biochem 2015;26(3):201-10.
- Barry BW. Novel mechanisms and devices to enable successful transdermal drug delivery. Eur J Pharm Sci 2001;14(2):101-14.
- Li X, Jasti BR. Design of Controlled Release Drug Delivery Systems. 1st ed. Columbus, OH: McGraw-Hill Education; 2006. p. 52-5.
- Poet TS, Mcdougal JN. Skin absorption and human risk assessment. Chem Biol Interact 2002;140:19-34.
- Touitou E, Dayan N, Bergelson L, Godin B, Eliaz M. Ethosomes - novel vesicular carriers for enhanced delivery: characterization and skin penetration properties. J Control Release 2000 3;65(3):403-18.
- Rakesh R, Anoop KR. Ethosomes for Transdermal and Topical Delivery. Int J Pharm Pharm Sci 2012;4(3):17-24.
- Rai U, Chandra D, Kumar S. Ethosomal Gel: A Novel Tool for Topical Drug Delivery. Int J Univers Pharm Life Sci 2013;3:349-65.
- Akiladevi D, Basak S. Ethosomes A Noninvasive Approach for Transdermal Drug Delivery. Int J Curr Pharm Res 2010;2(4):2-5.
- Gondaliya D, Pundarikakshudu K. Studies in Formulation and Pharmacotechnical Evaluation of Controlled Release Transdermal Delivery System of Bupropion. AAPS PharmSciTech 2003;4(1):1-9.
- Bendas ER, Tadros MI. Enhanced transdermal delivery of salbutamol sulfate via ethosomes. AAPS PharmSciTech 2007;8(4):E107.
- Garg V, Singh H, Bhatia A, Raza K, Singh SK, Singh B, et al. Systematic development of transethosomal gel system of piroxicam: formulation optimization, in vitroevaluation, andex vivo assessment. AAPS PharmSciTech 2016;18:58-71.
- Ubaidulla U, Reddy MVS, Ruckmani K, Ahmad FJ, Khar RK. Transdermal therapeutic system of carvedilol: effect of hydrophilic and hydrophobic matrix on in vitroand in vivocharacteristics. AAPS PharmSciTech 2007;8(1):2-9.
- Rao Y, Zheng F, Zhang X, Gao J, Liang W. In vitropercutaneous permeation and skin accumulation of finasteride using vesicular ethosomal carriers. AAPS PharmSciTech 2008;9(3):860-5.
- Akhtar N, Pathak K. Cavamax W7 composite ethosomal gel of clotrimazole for improved topical delivery: development and comparison with ethosomal gel. AAPS PharmSciTech 2012;13(1):344-55.
- Aqil F, Munagala R, Jeyabalan J, Vadhanam MV. Bioavailability of phytochemicals and its enhancement by drug delivery systems. Cancer Lett 2013;334(1):133-41.
- Shi J, Wang Y, Luo G. Ligustrazine phosphate ethosomes for treatment of Alzheimer’s disease, In vitro and in animal model studies. AAPS PharmSciTech 2012;13(2):485-92.
- Zhou Y, Wei Y, Liu H, Zhang G, Wu X. Preparation and In vitro evaluation of ethosomal total alkaloids of Sophora alopecuroides loaded by a transmembrane pH-gradient method. AAPS PharmSciTech 2010;11(3):1350-8.
- Hatahet T, Morille M, Hommoss, Devoisselle JM, Müller Bégu RHS. Quercetin topical application, from conventional dosage forms to nanodosage forms. Eur J Pharm Biopharm 2016;108:41-53.
- Paleco R, Vučen SR, Crean AM, Moore A, Scalia S. Enhancement of the In vitro penetration of quercetin through pig skin by combined microneedles and lipid microparticles. Int J Pharm 2014;472:206-13.
- Hatahet T, Morille M, Hommoss, Dorandeu C, Müller RH, Bégu S. Dermal quercetin smartCrystals®: Formulation development, antioxidant activity and cellular safety. Eur J Pharm Biopharm 2016;102:51-63.
- Park SN, Lee HJ, Kim HS, Park M, Gu H. Enhanced transdermal deposition and characterization of quercetin-loaded ethosomes. Korean J Chem Eng 2013;30(3):688-92.
- Chen X, Yin OQP, Zuo Z, Chow MSS. Pharmacokinetics and modeling of quercetin and metabolites. Pharm Res 2005;22(6):892-901.
- Davies NM, Yanez JA. Flavonoid Pharmacokinetics: Methods of Analysis, Preclinical and Clinical Pharmacokinetics, Safety, and Toxicology. Hoboken, New Jersey: John Wiley & Sons, Inc.; 2012. p. 204-5.
- Chen Z, Sun J, Chen H, Xiao Y, Liu D, Chen J. Comparative pharmacokinetics and bioavailability studies of quercetin, kaempferol and isorhamnetin after oral administration of Ginkgo bilobaextracts, Ginkgo bilobaextract phospholipid complexes and Ginkgo bilobaextract solid dispersions. Fitoterapia 2010;81(8):1045-52.
- Dai B, Hu Z, Li H, Yan C, Zhang L. Simultaneous determination of six flavonoids from Paulownia tomentosa flower extract in rat plasma by LC-MS/MS and its application to a pharmacokinetic study. J Chromatogr B 2015;978-979:54-61.
- Erlund I, Kosonen T, Alfthan G, Mäenpää J, Perttunen K, Kenraali J, et al. Pharmacokinetics of quercetin from quercetin aglycone and rutin in healthy volunteers. Eur J Clin Pharmacol 2000;56(8):545-53.
- Li G, Zeng X, Xie Y, Cai Z, Moore JC, Yuan X, et al. Pharmacokinetic properties of isorhamnetin, kaempferol and quercetin after oral gavage of total flavones of Hippophae rhamnoidesL. in rats using a UPLC-MS method. Fitoterapia 2012;83(1):182-91.
- Ou-yang Z, Cao X, Wei Y, Zhang W-W-Q, Zhao M, Duan J. Pharmacokinetic study of rutin and quercetin in rats after oral administration of total flavones of mulberry leaf extract. Rev Bras Farmacogn 2013;23(5):776-82.
- Marto J, Vitor C, Guerreiro A, Severino C, Eleutério C, Ascenso A, et al. Ethosomes for enhanced skin delivery of griseofulvin. Colloids surfaces B Biointerfaces 2016;146:616-23.
- Ahad A, Aqil M, Kohli K, Sultana Y, Mujeeb M. Enhanced transdermal delivery of an anti-hypertensive agent via nanoethosomes: statistical optimization, characterization and pharmacokinetic assessment. Int J Pharm 2013;443(1-2):26-38.
- Anwar E, Ramadon D, Harmita. Formulation and Evaluation of Gel and Emulgel of Chili Extract (Capsicum frutescens L.) as Topical Dosage Forms. Int J Pharm Pharm Sci 2014;6:3-6.
- Casagrande R, Georgetti SR, Verri WA, Borin MF, Lopez RF V, Fonseca MJ V. In vitroevaluation of quercetin cutaneous absorption from topical formulations and its functional stability by antioxidant activity. Int J Pharm 2007;328:183-90.
- Chen-yu G, Chun-fen Y, Qi-lu L, Qi T, Yan-wei X, Wei-na L, et al. Development of a Quercetin-loaded nanostructured lipid carrier formulation for topical delivery. Int J Pharm 2012;430:292-8.
- Pozharitskaya ON, Karlina MV, Shikov AN, Kosman VM, Makarova MN, Makarov VG. Determination and pharmacokinetic study of taxifolin in rabbit plasma by high-performance liquid chromatography. Phytomedicine 2009;16:244-51.
- Bonina F, Lanza M, Montenegro L, Puglis C, Tomaino A, Trombetta D, et al. Flavonoids as potential protective agents against photo-oxidative skin damage. Int J Pharm 1996;145:87-94.
- Iizhar SA, Syed IA, Satar R, Ansari SA. In vitro assessment of pharmaceutical potential of ethosomes entrapped with terbinafine hydrochloride. J Adv Res 2016;7(3):453-61.
- Sou K. Electrostatics of carboxylated anionic vesicles for improving entrapment capacity. Chem Phys Lipids 2011;164(3):211-5.
- https://www.malvern.com/en/support/resource-enter/Whitepapers/WP120620BasicGuidePart Char.
- http://www.biophysics.bioc.cam.ac.uk/files/Zetasizer_Nano_user_manual_Man0317-1.1.pdf.
- Sinko PJ. Martin's Physical Pharmacy and Pharmaceutical Sciences: Physical Chemical and Biopharmaceutical Principles in the Pharmaceutical Sciences. 6th ed. Philadelphia, Pennsylvania: Lippincott Williams & Wilkins; 2006.
- Chantasart DS, Li K, He N, Warner KS. Prakongpan SWIH. Mechanistic Studies of Branched-Chain Alkanols as Skin Permeation Enhancers. J Pharm Sci 2004;93(3):762-79.
- Jain S, Jain AK, Pohekar M, Thanki K. Novel self-emulsifying formulation of quercetin for improved in vivoantioxidant potential: Implications for drug-induced cardiotoxicity and nephrotoxicity. Free Radic Biol Med 2013;65C:117-30.
- Elsayed MM, Abdallah OY, Naggar VF, Khalafallah NM. Lipid vesicles for skin delivery of drugs: reviewing three decades of research. Int J Pharm 2007;332(1-2):1-16.
- Rothwell J, Day AJ, Morgan MR. Experimental determination of octanol-water partition coefficients of quercetin and related flavonoids. J Agric Food Chem 2005;53(11):4355-60.
- Pirvu CD, Hlevca C, Ortan A, Prisada R. Elastic Vesicles as Drugs Carriers through the Skin. Farmacia 2010;58:128-35.
- Morsi NM, Aboelwafa AA, Dawoud MHS. Improved bioavailability of timolol maleate via transdermal transfersomal gel: Statistical optimization, characterization, and pharmacokinetic assessment. J Adv Res 2016;7(5):691-701.
 EG;
EG;  NEG
NEG