- *Corresponding Author:
- Ruochuan Cheng
Department of Thyroid Surgery, Clinical Research Center for Thyroid Diseases of Yunnan Province, The First Affiliated Hospital of Kunming Medical University, Kunming, Yunnan Province 650032, China
E-mail: 301059752@qq.com
| This article was originally published in a special issue, “Clinical Advancements in Life Sciences and Pharmaceutical Research” |
| Indian J Pharm Sci 2024:86(5) Spl Issue “134-150” |
This is an open access article distributed under the terms of the Creative Commons Attribution-NonCommercial-ShareAlike 3.0 License, which allows others to remix, tweak, and build upon the work non-commercially, as long as the author is credited and the new creations are licensed under the identical terms
Abstract
Thyroid cancer is the most frequent endocrine malignancy, with over 80 % being its subtype of papillary thyroid cancer. Necroptosis contributes to the regulation of oncogenesis and cancer immunity. However, the prognostic significance of necroptosis-related genes in papillary thyroid cancer patients remains a topic requiring further exploration. Data from the cancer genome atlas and the gene expression omnibus databases were utilized for the identification of prognostically relevant genes through univariate cytochrome C oxidase analysis and least absolute shrinkage and selection operator regularization. Gene set enrichment analysis was performed for each prognostic-related gene and an analysis of the immune characteristics of patients stratified by their risk scores was undertaken. Subsequently, the potential therapeutic drugs of papillary thyroid cancer were predicted. Finally, real-time quantitative reverse transcription-polymerase chain reaction and Western blot analyses were performed in papillary thyroid cancer samples to detect the expression of prognostic-related genes at the messenger ribonucleic acid and protein levels. Our research has established a necroptosis-related prognostic signature comprising C-X-C motif chemokine ligand 5, tyrosine-protein kinase receptor 3, and fibronectin type III domain containing 4 in papillary thyroid cancer. This signature is intricately linked to the tumor microenvironment of papillary thyroid cancer and holds potential in enhancing the management and prognostic prediction of thyroid cancer.
Keywords
Papillary thyroid cancer, necroptosis-related genes, prognostic model, immune microenvironment
Thyroid Cancer (THCA), a malignant tumor, originates from the thyroid follicular epithelium or perifollicular epithelium cells. It has now emerged as the 3rd most common cancer among females in 2022, with 823 800 reported cases according to American cancer statistics[1]. The National Cancer Center (NCC) of China has shown that the Age- Standardized Incidence Rate by World standard population (ASIRW) of THCA was 10.37/105 in 2016[2]. In women, the ASIRW for THCA ranked 3rd among all malignancies, and it continues to increase at a rate of 20 % per year. Meanwhile, there has been an upward trend in mortality rates of THCA[2]. The most ordinary kind of THCA is Papillary Thyroid Cancer (PTC), comprising 80 % of all cases[3]. PTC generally carries a favorable prognosis; however, the 5 y survival rate of PTC patients in China (84 %) is still far lower than that of developed countries (98 %)[4]. Although current treatments for PTC are becoming increasingly standardized and continuously enhanced, a subset of PTC patient’s still experience challenges such as local invasion, iodine refractoriness, metastases or recurrence, leading to a poor prognosis. This difficulty arises because some PTC cases exhibit heterogeneity characterized by distinct clinical, pathological, and molecular features[5]. Owing to insufficient perception of the natural history of these more aggressive variants, treatment for these patients is often insufficient or suboptimal. As such, there is an urgent need for the construction of a high-quality risk signature to forecast the prognosis, and to enable the tailoring of optimal treatments for patients with changing degrees of risk. The prognosis of THCA patients is associated with a lot of elements such as clinical elements and genes. Past research has shown that age, Tumor, Node and Metastasis (TNM) phase, extra thyroidal extension, and lymph node metastasis were separate risk elements for the prognosis of THCA patients[6]. Genetic alterations including BRAF and TERT mutations can also impact the survival rate of THCA patients[7]. While Thyroglobulin (TG) serves as a crucial prognostic marker for PTC, its reliability can be compromised by the presence of TG Antibodies (TGAb)[8]. Therefore, new prognostic markers that can enhance the accuracy of diagnosis, treatment, and prognosis assessment for PTC patients shall be explored and identified urgently.
Apoptosis is a programmed cell death mechanism, and the avoidance and/or resistance to apoptosis are regarded indisputable features of cancer[9]. Until the discovery of necroptosis as a new programmed form of necrotic cell death, it was traditionally believed that necrosis represented a contrasting mode of cell demise in comparison to apoptosis[10]. Necroptosis, however, exhibits mechanistic similarities to apoptosis and shares morphological characteristics with necrosis[11]. Different from the classical apoptotic pathway relying on caspase activation, in case of absent or inhibited caspases, necroptosis is activated as the alternative[12]. Necroptosis can be induced by multiple innate immune signaling pathways including Tumor Necrosis Factor (TNF) receptor 1, Toll-like receptor and more[11]. These signaling pathways result in the phosphorylation and activation of the receptor-interacting protein kinase 1 and receptorinteracting protein kinase 3, which activates the pseudo kinase Mixed Lineage Kinase domain Like (MLKL) through phosphorylation. MLKL then induces membrane permeability while mediating the release launch of intracellular materials, which leads to the implementation of the necroptosis program[13].
Necroptosis is a significant factor in cancer biology regulation, such as oncogenesis, cancer immunity, cancer metastasis, and cancer subtypes. As a fusion of apoptosis and necrosis, necroptosis has been shown to exert dual effects on cancer. On one hand, it serves as a protective mechanism against tumor development in situations where apoptosis is impaired[14]. Nonetheless, the primary mediating agents of the necroptosis path, whether individually or in combination, have been proposed to potentially facilitate cancer metastasis and the progression of cancer[15].
Further, inducing and/or manipulating necroptosis in anti-cancer therapies stand for a potential therapeutic method for bypassing obtained or intrinsic apoptosisresistance, acting as an alternative method to remove apoptosis-resistant cancer cells. At present, there is a scarcity of research on necroptosis-related genes in PTC, and the role of necroptosis-related genes in the development and progression of PTC remains to be further explored.
Therefore, a bioinformatics approach was adopted in the current research to identify necroptosis-related genes connected with the prognosis of PTC patients and to dig the influence of prognostic-related genes on the PTC immune microenvironment. At the same time, potential therapeutic agents were predicted on basis of prognostic-related genes, providing a theoretical basis for diagnosing and clinically treating PTC.
Materials and Methods
Data source:
We obtained transcriptome data comprising 510 PTC samples and 58 normal samples from The Cancer Genome Atlas (TCGA) database (https://portal.gdc.cancer.gov/). Subsequently, based on the createDataPartition function in the caret package (version 6.0.93), 509 PTC samples with complete survival data were segregated into a training set randomly (255 samples) and a testing set (254 samples) in a 1:1 ratio. Additionally, the GSE29265 dataset from the Gene Expression Omnibus (GEO) database (http://www.ncbi.nlm.nih.gov/geo/) was included, consisting of 20 normal and 20 samples. We also sourced a list of 636 necroptosis-related genes (Differentially Expressed Necroptosis Related Genes (DENRGs)) with a correlation score above 1.0 from the GeneCards database (http://www.genecards.org/).
Acquisition and enrichment analysis of DENRGs:
For the TCGA-PTC dataset, we employed the limma (version 3.46.0) to identify differentially expressed DENRGs between PTC and normal samples[16]. The criteria for differential expression were set at |log2FC|p>0.5 and adjust p<0.05. Visual representations were created using ggplot2 (version 3.3.6) for volcano plots and pheatmap (version 1.0.12)[17] for heat maps. Additionally, the clusterProfiler package (version 3.18.1) facilitated the Gene Ontology (GO) and Kyoto Encyclopedia of Genes and Genomes (KEGG) enrichment analyses of the identified DENRGs, with the results presented as bubble charts, again utilizing ggplot2 (version 3.3.6). All data processing was executed using R software packages.
Establishment and validation of PTC prognostic risk model:
In the initial phase, univariate Cytochrome C Oxidase (COX) regression analysis was employed to the training set to select survival-associated genes among the DENRGs. Next, the Least Absolute Shrinkage and Selection Operator (LASSO) technique was adopted, utilizing the glmnet (version 4.1-4)[18], to refine the gene selection and mitigate the inclusion of false-positive genes, thus constructing a more robust prognostic model. The risk score for every PTC patient was computed by integrating the gene expression levels with their respective coefficients derived from the LASSO analysis. Patients were then stratified into high- and low-risk groups on basis of the median risk score. The differences in survival rates between these two groups were illustrated applying Kaplan-Meier (K-M) survival curves, produced with the survminer[19] (version 0.4.9). The prognostic model’s predictive performance was further assessed by constructing Receiver Operating Characteristic (ROC) curves applying the survivalROC (version 1.0.3). This assessment was conducted both in the training and the testing sets to ensure model robustness. Moreover, the diagnostic accuracy of the prognostic model for PTC was assessed using the GSE29625 and TCGA-PTC datasets. This was achieved by generating ROC curves with the pROC (version 2.3.0). Lastly, the expression of prognosticrelated genes in PTC vs. normal samples within the GSE29625 and TCGA-PTC datasets were analyzed. The results were visually represented through box plots, crafted using the ggplot2 package (version 3.3.6)[20]. In addition, in the GSE29625 and TCGAPTC datasets, the ROC curve was drawn with the pROC to explore the diagnostic precision of the prognostic model for PTC. Finally, in the GSE29625 and TCGA-PTC datasets, the expression of prognostic-related genes in PTC and normal samples were detected by the nonparametric test.
Evaluation of independent prognostic factors in PTC patients:
For our study, we incorporated variables such as risk score, gender, stage, and TNM classifications into a cohort of 137 training set samples with comprehensive clinical data. COX regression analyses were made to discern independent prognostic elements for PTC, with significance determined at p<0.05. Following this, a nomogram incorporating these independent prognostic factors was constructed using the regression modeling strategies (rms) (version 6.5-0), and its accuracy was gauged using calibration curves.
Gene Set Enrichment Analysis (GSEA) of prognostic genes:
Within the TCGA-PTC dataset, we performed GSEA for GO and KEGG pathways on samples exhibiting high and low expression of prognostic genes. The criteria for enrichment included |NES|>1 and p<0.05.
Analysis of somatic mutation and immune microenvironment in PTC:
To evaluate immune infiltration in the training set, we employed the cell algorithm, and differences between high- and low-risk groups were determined applying the Wilcoxon test. Somatic mutations in PTC patients were analyzed using maftools (mutation annotation format)[21] (version 2.6.05). F-test was then applied to investigate the co-occurrence and exclusivity of mutations. Survival probabilities in high and low Tumor Mutation Burden (TMB) groups were compared using K-M survival curves, generated by survminer (version 0.4.9). Furthermore, the infiltration degrees of 28 immune cell kinds in PTC samples were quantified applying single sample GSEA (ssGSEA).
Assessment of immunotherapy sensitivity:
To discern expression disparities of prevalent immune checkpoints, we analyzed samples in the training set. Additionally, Immunophenoscores (IPS) for PTC were procured from The Cancer Imaging Archive (TCIA) (https://tcia.at/). We then evaluated the differential responses to treatments targeting Programmed Cell Death Protein 1 (PD1) and CTLA4 in both risk groups. The distribution of immune subtypes within these groups was further examined using the ImmuneSubtypeClassifier.
Identification of potential therapeutic drugs for PTC:
Exploring potential pharmacological interventions, we identified prospective drugs for PTC in the Genomics of Drug Sensitivity in Cancer (GDSC) (https://www.cancerrxgene.org/) and the Drug-Gene Interaction database (DGIdb) (http://www.dgidb.org), focusing on prognosis-related genes. The Half Maximum Inhibition Concentration (IC50) values for various drugs were calculated for patients in both risk groups using the oncoPredict tool (version 0.2).
Validation through quantitative Reverse Transcription-Polymerase Chain Reaction (qRTPCR) and Western Blot (WB):
For validation, tissue samples from PTC and adjacent normal regions were collected from 10 patients. Total Ribonucleic Acid (RNA) extraction from Peripheral Blood Mononuclear Cells (PBMCs) was performed applying TRIzol reagent (Ambion), in accordance with the manufacturer’s protocols, complementary Deoxyribonucleic Acid (cDNA) synthesis from the extracted RNA was conducted with the SureScript™ First Strand cDNA Synthesis Kit (Servicebio). Tsingke Biotechnology Co. Ltd., synthesized primers, listed in Table 1. qRT-PCR was executed using the Bio-Rad system, with Glyceraldehyde 3-Phosphate Dehydrogenase (GAPDH) serving as the normalization reference, and ΔCT method for result calculation. All experimental procedures adhered to relevant guidelines and regulations, receiving approval from the ethics committee.
| Primers | Sequences (5'-3') |
|---|---|
| CXCL5 | Forward: TGCGTTGCGTTTGTTTACAG |
| CXCL5 | Reverse: TCTTCAGGGAGGCTACCACTT |
| TYRO3 | Forward: CCATCCGCACAGATTCAGGC |
| TYRO3 | Reverse: TCCAGGGTCCACAGCCAACT |
| FNDC4 | Forward: CTGACCGGCTACCTTCAAACA |
| FNDC4 | Reverse: GCCTTCCCTGAGGACTCTGTT |
| GAPDH | Forward: GAAGGTCGGAGTCAACGGATTT |
| GAPDH | Reverse: ATGGGTGGAATCATATTGGAAC |
Table 1: Primers Used for The qRT-PCR Analysis
For protein analysis, the extraction of total protein was made with Radioimmunoprecipitation Assay (RIPA) lysis and extraction buffer (Solarbio, China), followed by separation via 10 % Sodium Dodecyl- Sulfate Polyacrylamide Gel Electrophoresis (SDSPAGE). The transfer of proteins to a Polyvinylidene Fluoride (PVDF) membrane was made (Millpore, United States of America (USA)). Detection involved Goat anti-Mouse IgG-HRP (Servicebio, GB23301, China) and Goat anti-Rabbit IgG-HRP (Invitrogen, AB_228338). The antibodies used included β-actin (1:25 000, Proteintech, 66009-1-Ig, China), C-X-C Motif Chemokine Ligand 5 (CXCL5) (1:1000, Abcam, ab126763), Tyrosine-protein kinase Receptor 3 (TYRO3) (1:1000, CST, #5585), and FINDC4 (1:1000, NOVUS, NBP1-59690).
Results and Discussion
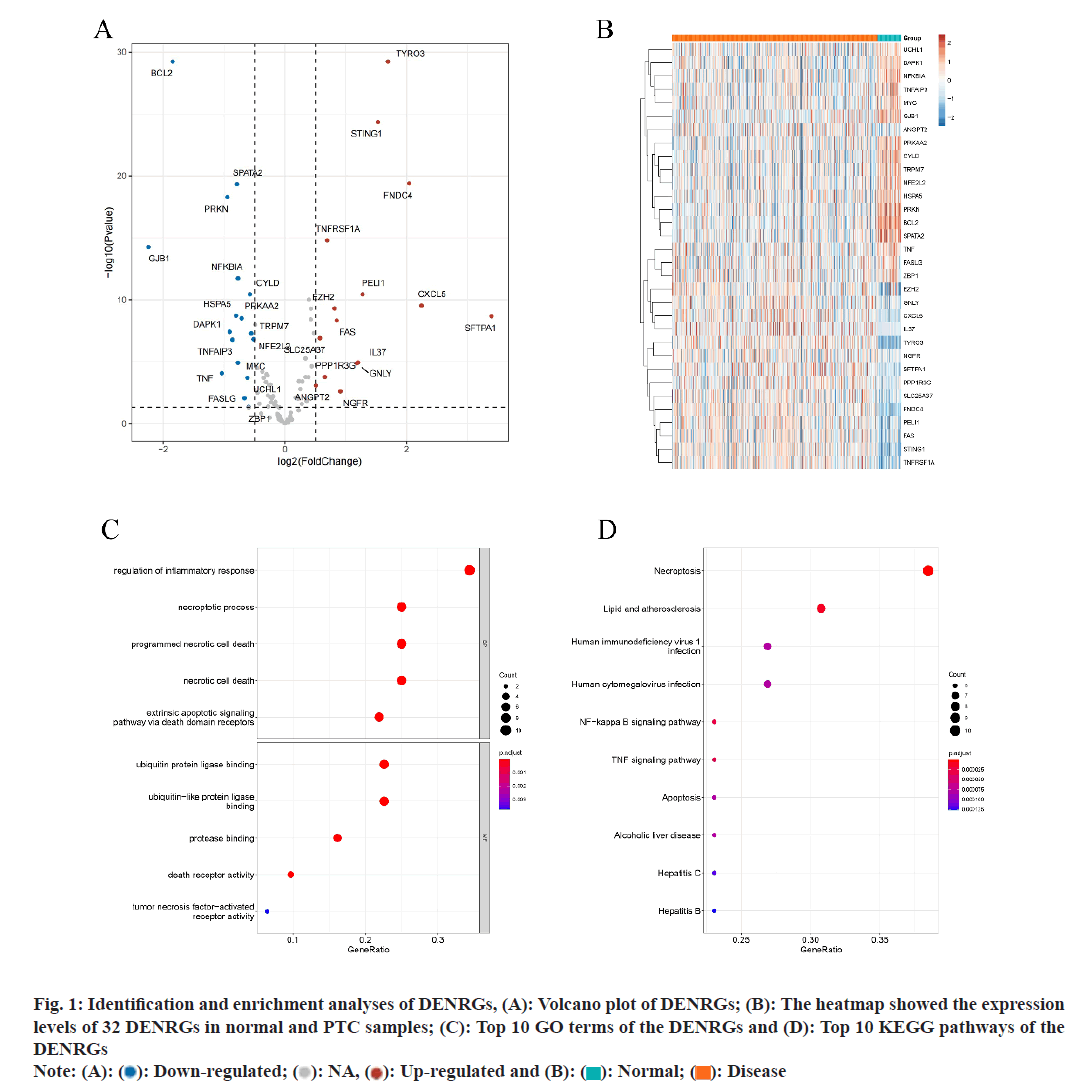
Utilizing the TCGA-PTC dataset, differential analysis yielded 32 distinct DENRGs contrasting PTC with normal samples. Among these, 15 were found to be up-regulated and 17 down-regulated, meeting the criteria of |log2FC|>5 and p<0.05 (fig. 1A and fig. 1B). GO analysis of these 32 DENRGs identified 437 associated pathways. The analysis also highlighted pathways related to TNF-mediated signaling, control thereof, cellular responses to tumor necrosis element, and reaction to tumor necrosis element, including the extrinsic apoptotic signaling pathway (fig. 1C). Concurrently, KEGG analysis linked the 32 DENRGs to 58 pathways, primarily those associated with immune and inflammatory responses, cell death, and disease development. Notable pathways include necroptosis, lipid and Nuclear Factor-kappa B (NF-κB) signaling pathway, TNF signaling pathway, along with pathways associated with human immunodeficiency virus 1 infection, apoptosis, alcoholic liver disease, human cytomegalovirus infection, and hepatitis C, etc., (fig. 1D).
Fig. 1: Identification and enrichment analyses of DENRGs, (A): Volcano plot of DENRGs; (B): The heatmap showed the expression
levels of 32 DENRGs in normal and PTC samples; (C): Top 10 GO terms of the DENRGs and (D): Top 10 KEGG pathways of the
DENRGs
Note: (A):  Down-regulated;
  NA,
NA,  Up-regulated and (B):
  Normal;
  Disease
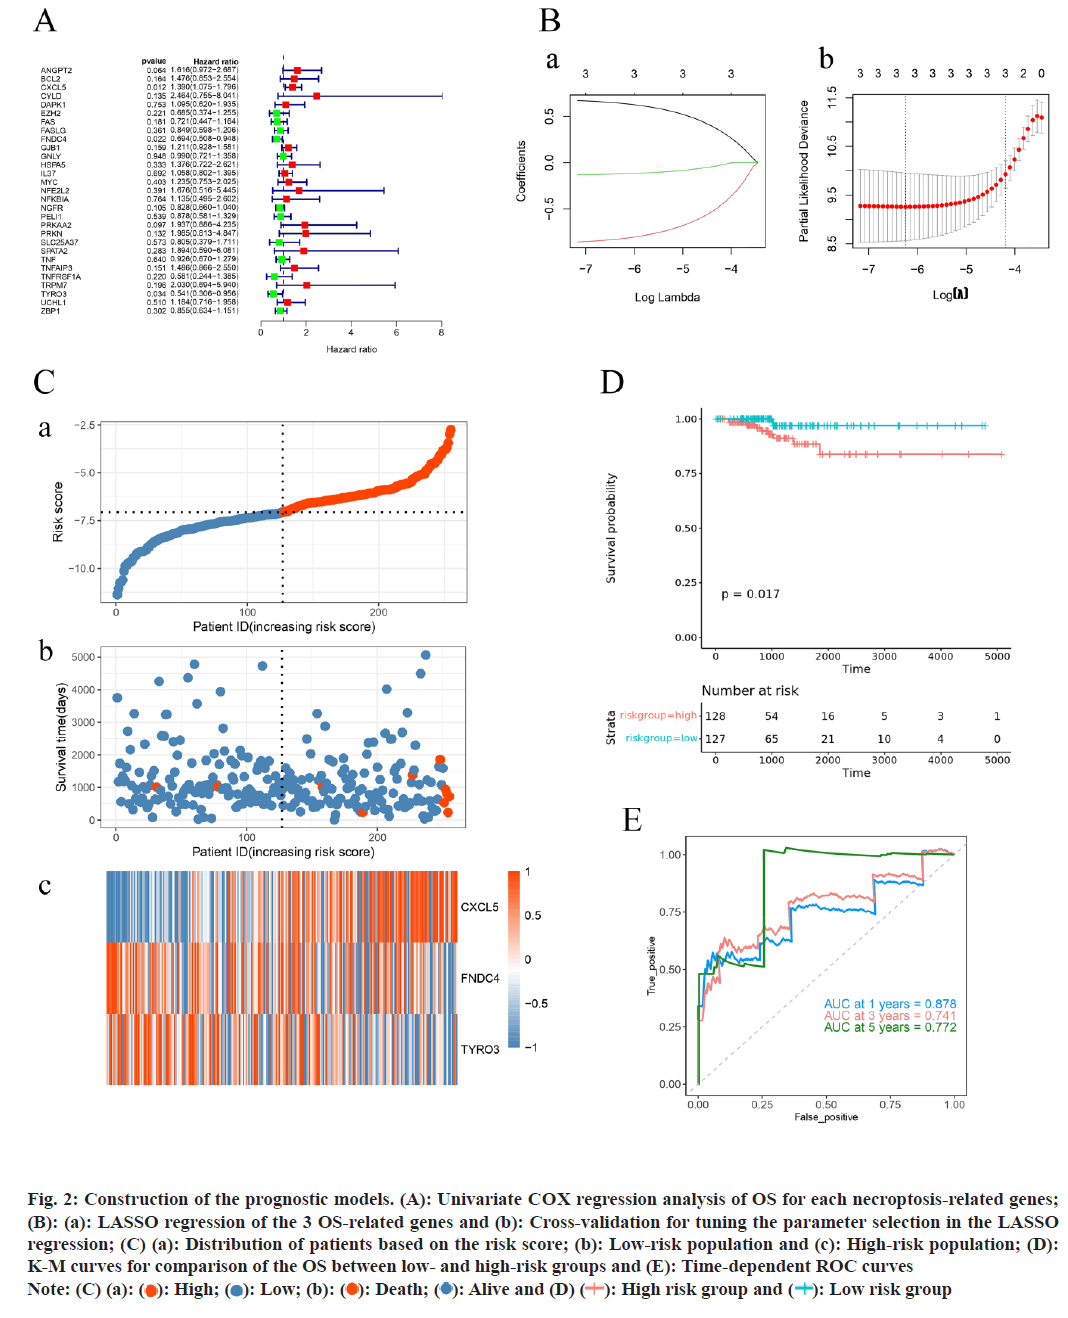
In our training set, an initial univariate COX regression analysis of 32 DENRGs identified three genes CXCL5, TYRO3, and Fibronectin Type III Domain Containing 4 (FNDC4) as significantly associated with PTC patient survival (p<0.05) (fig. 2A). Subsequent analysis using LASSO regression led to the establishment of a prognostic model for PTC, incorporating these three genes (fig. 2B). Risk scores for PTC patients in the training set were calculated on basis of these genes. Patients were fallen into high-risk and low-risk groups (risk score=-7.06) (fig. 2C). The risk curve indicated shorter survival times for patients in the high-risk group. Moreover, K-M survival analyses displayed that the probability of survival was greatly lower in the high-risk group compared to low-risk group (fig. 2D). The prognostic model’s predictive accuracy was further proved by the ROC curve, with the Area Under the Curve (AUC) for 1 y, 3 y, and 5 y survival exceeding 0.7, underscoring the model’s efficacy (fig. 2E).
Fig. 2: Construction of the prognostic models. (A): Univariate COX regression analysis of OS for each necroptosis-related genes;
(B): (a): LASSO regression of the 3 OS-related genes and (b): Cross-validation for tuning the parameter selection in the LASSO
regression; (C) (a): Distribution of patients based on the risk score; (b): Low-risk population and (c): High-risk population; (D):
K-M curves for comparison of the OS between low- and high-risk groups and (E): Time-dependent ROC curves
Note: (C) (a):  High;
High;  Low; (b):
  Death;
  Alive and (D)
  High risk group and
  Low risk group
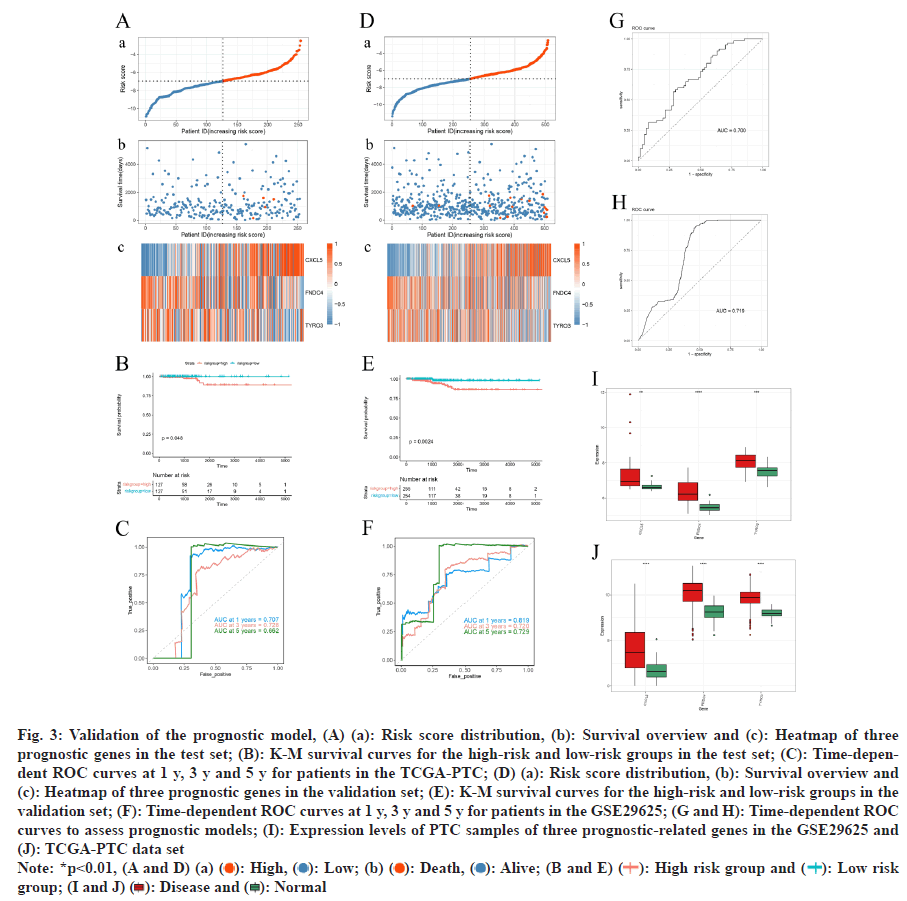
The risk curve mirrored findings from the training set, showing reduced survival times for high-risk group patients (fig. 3A). K-M analysis confirmed significantly lower survival probabilities for the high-risk group by comparing with the low-risk group (fig. 3B). The ROC curve analysis for 1 y, 3 y, and 5 y survival displayed AUC values exceeding 0.66 (fig. 3C), demonstrates the reliability of the prognostic model.
The prognostic model’s effectiveness was further validated applying the TCGA-PTC dataset. Analysis revealed that patients classified as high-risk exhibited markedly shorter survival times (fig. 3D). Survival analysis displayed a greatly lower survival possibility in the high-risk group by comparing with the low-risk group (fig. 3E). The model’s predictive accuracy was determined by ROC curve, indicating robust prognostic capability (AUC>7) (fig. 3F). Additionally, in both the GSE29625 and TCGA-PTC datasets, the prognostic model demonstrated strong diagnostic precision with AUC values exceeding 0.7 on the ROC curve (fig. 3G-fig. 3H). Further analysis displayed greatly higher expression degrees of the three prognostic genes in PTC samples by comparing with normal samples within these datasets (fig. 3I and fig. 3J).
Fig. 3: Validation of the prognostic model, (A) (a): Risk score distribution, (b): Survival overview and (c): Heatmap of three
prognostic genes in the test set; (B): K-M survival curves for the high-risk and low-risk groups in the test set; (C): Time-dependent
ROC curves at 1 y, 3 y and 5 y for patients in the TCGA-PTC; (D) (a): Risk score distribution, (b): Survival overview and
(c): Heatmap of three prognostic genes in the validation set; (E): K-M survival curves for the high-risk and low-risk groups in the
validation set; (F): Time-dependent ROC curves at 1 y, 3 y and 5 y for patients in the GSE29625; (G and H): Time-dependent ROC
curves to assess prognostic models; (I): Expression levels of PTC samples of three prognostic-related genes in the GSE29625 and
(J): TCGA-PTC data set
Note: (A and D) (a):  High;
High;  Low; (b):
  Death;
  Alive; (B and E)
  High risk group and
  Low risk group; (I
and J)
  Disease and
  Normal
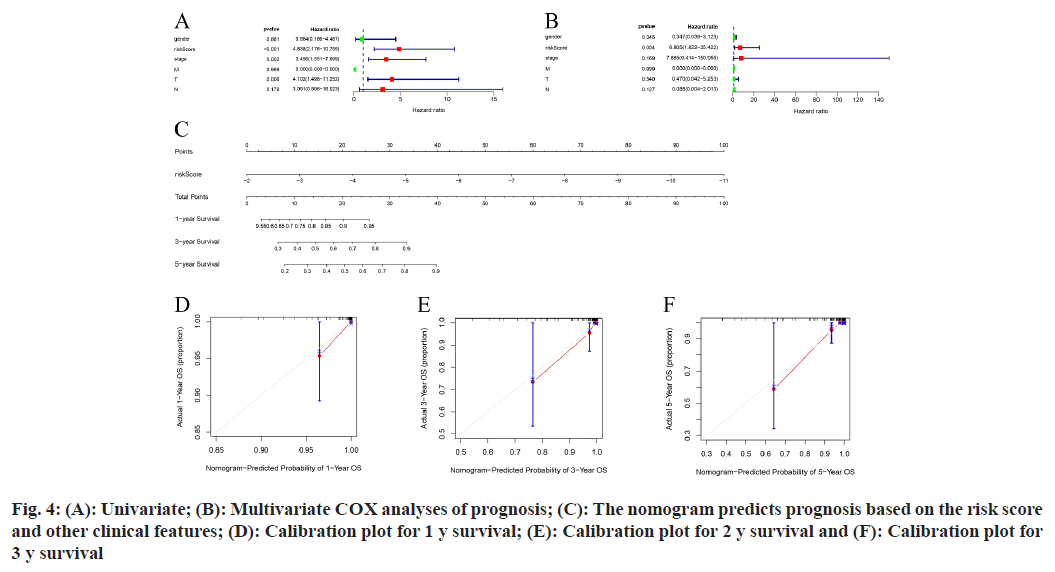
In the initial dataset, an extensive analysis that included both the risk score and key clinical characteristics (including gender, stage of the tumor, and TMN stages) of patients with PTC was performed using COX regression methods. The results suggest that the risk score can be recognized as a separate prognostic index, evidenced by a significant (p<0.001) (fig. 4A and fig. 4B).
Subsequently, a nomogram incorporating the risk score was devised (fig. 4C), and the effectiveness of this nomogram in predicting outcomes was assessed through calibration plots. These plots confirmed the model’s precision in forecasting survival rates at 1 y, 3 y, and 5 y for individuals with PTC (fig. 4D-fig. 4F).
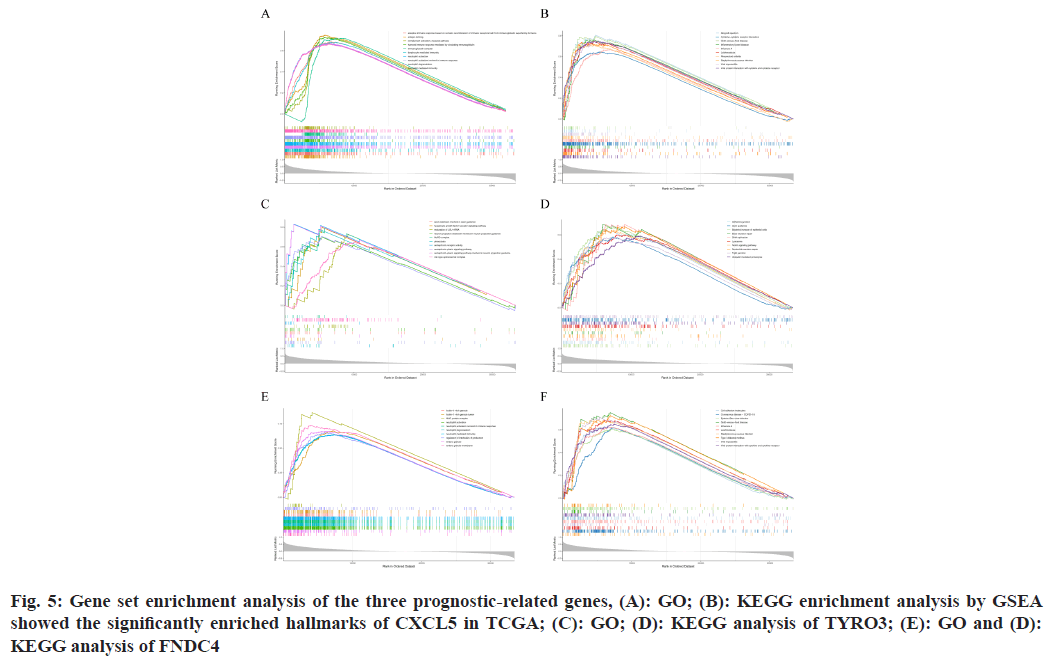
Analysis within the TCGA-PTC dataset indicated that prognostic-related genes significantly took part in processes of cell division and the immune response, mediated via cytokines and chemokines. GO showed CXCL5’s association with key cellular processes such as cell cycle checkpoint, G1/S transition of the mitotic cell cycle, activation of Mitogen-Activated Protein Kinase (MAPK) activity, ossification, and virus receptor activity (p<0.05, q<25) (fig. 5A). KEGG enrichment analysis indicated CXCL5’s involvement in pathways such as oxidative phosphorylation, cytokine-cytokine receptor interaction, etc., (p<0.05, q<25) (fig. 5B).
Further, GSEA for TYRO3 in the GO domain revealed its relation to crucial cellular mechanisms including cell cycle checkpoint, DNA damage checkpoint, G1/S and G2/M transitions of the mitotic cell cycle, and ubiquitin ligase complex (p<0.05, q<25) (fig. 5C). KEGG enrichment for TYRO3 demonstrated its association with lysosome, endocytosis, axon guidance, tight junction, and shigellosis (p<0.05, q<25) (fig. 5D).
Similarly, GO analysis for FNDC4 indicated its involvement in cellular processes such as cell cycle checkpoint, G1/S transition of the mitotic cell cycle, and nuclear-transcribed mRNA catabolic processes including nonsense-mediated decay (p<0.05, q<25) (fig. 5E). Through KEGG analysis, FNDC4 was found to be associated with ribosome, viral protein interaction with cytokine and cytokine receptor, cytokine-cytokine receptor interaction, chemokine signaling pathway, and lysosome (p<0.05, q<25) (fig. 5F).
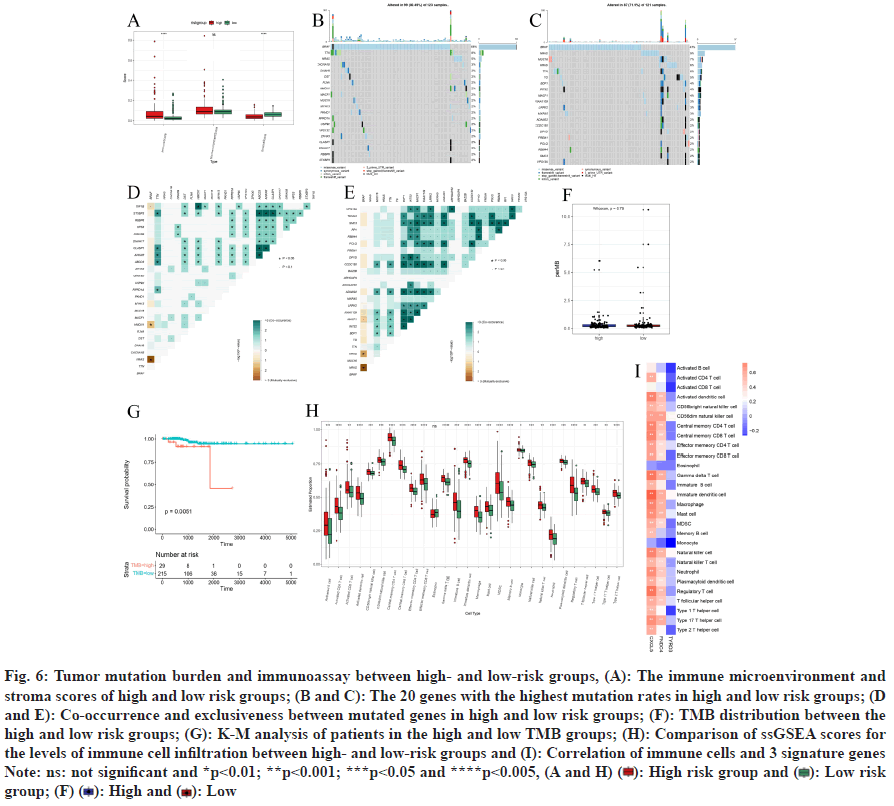
In the training set, through analyzing immune cell infiltration, significantly higher immune score and significantly lower stroma score were observed in the high-risk group samples by comparing with the lowrisk group, while there was no great diversities in microenvironment score between the two risk groups (fig. 6A).
In our analysis involving a training set, we examined 123 samples of PTC, finding that 99 of these samples (representing 80.49 %) contained somatic mutations (fig. 6B), a waterfall plot, illustrates the top 20 mutated genes in these samples, prominently featuring genes linked to cancer like BRAF (68 %), TTN (8 %), NRAS (5 %), and CACNA1B (3 %), with missense mutations being the predominant variant type observed. In the subset categorized as lowrisk, out of 121 PTC samples analyzed for somatic mutations, 87 (71.9 %) were mutation-positive. The corresponding waterfall plot for this group (fig. 6C) and included famous cancer-related genes including BRAF (47 %), NRAS (9 %), MUC16 (7 %), HRAS (6 %) and TTN (6 %). Missense mutations were the most ordinary variant classification.
Highlights the most frequently mutated genes in these patients, including notable cancer genes such as BRAF (47 %), NRAS (9 %), MUC16 (7 %), HRAS (6 %), and TTN (6 %). Moreover, our correlation assessment within the high-risk category revealed a pronounced co-occurrence of mutations in STXBP3 with ABCD3 and ANKAR, as well as between CLASP1 with ABCD3 and ANKAR (fig. 6D). Analysis of the TCGA-PTC dataset revealed significant exclusivity between BRAF and NRAS, as well as between HMCN1 and TAF1B (fig. 6D). In the low-risk group, genes including BDP1, INTS2, MACF1, KIAA1109, LRRK2, ADAM22, CCDC150, DPYD, POLQ, and SMC3 demonstrated strong co-occurrence. Conversely, BRAF exhibited notable exclusivity with NRAS and HRAS (fig. 6E). Furthermore, analysis in the training set revealed no great diversity in TMB between high and lowrisk groups. However, patients with high TMB had a significantly lower possibility of survival than those with low TMB (fig. 6F and fig. 6G).
In the training set, the infiltration levels of eosinophils did not present a statistically significant difference when comparing high- and low-risk categories. In contrast, a notable elevation in infiltration was observed in 27 other immune cell types within the high-risk group. This increase was particularly evident in multiple cell types including activated dendritic cells, activated CD4+ T cells, and central memory CD4/CD8 T cells, showing great diversities in infiltration degrees between the two groups (p<0.05) (fig. 6H). Furthermore, the prognosticrelevant genes CXCL5 and FNDC4 were found to have substantial correlations with the majority of these immune cells. Conversely, TYRO3 was not greatly related to the immune cells (|Cor|>3 and p<0.05) (fig. 6I).
Fig. 6: Tumor mutation burden and immunoassay between high- and low-risk groups, (A): The immune microenvironment and
stroma scores of high and low risk groups; (B and C): The 20 genes with the highest mutation rates in high and low risk groups; (D
and E): Co-occurrence and exclusiveness between mutated genes in high and low risk groups; (F): TMB distribution between the
high and low risk groups; (G): K-M analysis of patients in the high and low TMB groups; (H): Comparison of ssGSEA scores for
the levels of immune cell infiltration between high- and low-risk groups and (I): Correlation of immune cells and 3 signature genes
Note: ns: not significant and *p<0.01; **p<0.001; ***p<0.05 and ****p<0.005, (A and H)  High risk group and
  Low risk group; (F)
  High and
  Low
Low
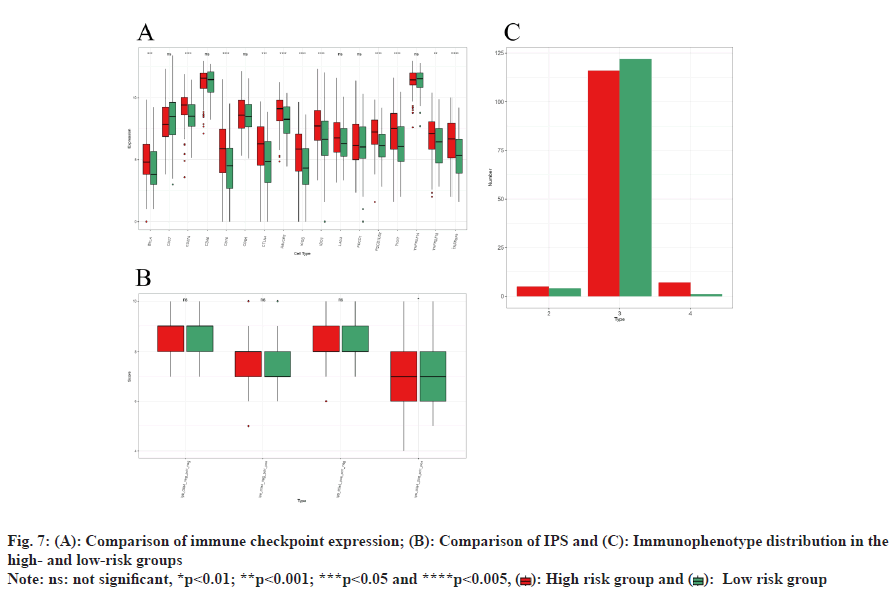
Analysis within the training set indicated significant elevation in the expression degrees of immune checkpoints, including BTLA, CD274, CD70, CTLA4, HAVCR2, ICOS, IDO1, PDCD1LG2, TIGIT, TNFRSF18, and TNFRSF9 (p<0.05) (fig. 7A). Additionally, the IPS differences in response to PD1 and CTLA4 treatments were notably significant (p<0.05). However, no significant IPS variation was observed between these groups under the conditions of no treatment, PD1 alone, or CTLA4 alone (fig. 7B). Immunophenotype analysis identified the predominant Immune Subtype (IS) in both risk groups as C3-inflammatory IS, with the presence of C2-IFN-γ dominant IS and C4-lymphocyte depleted ISs (fig. 7C).
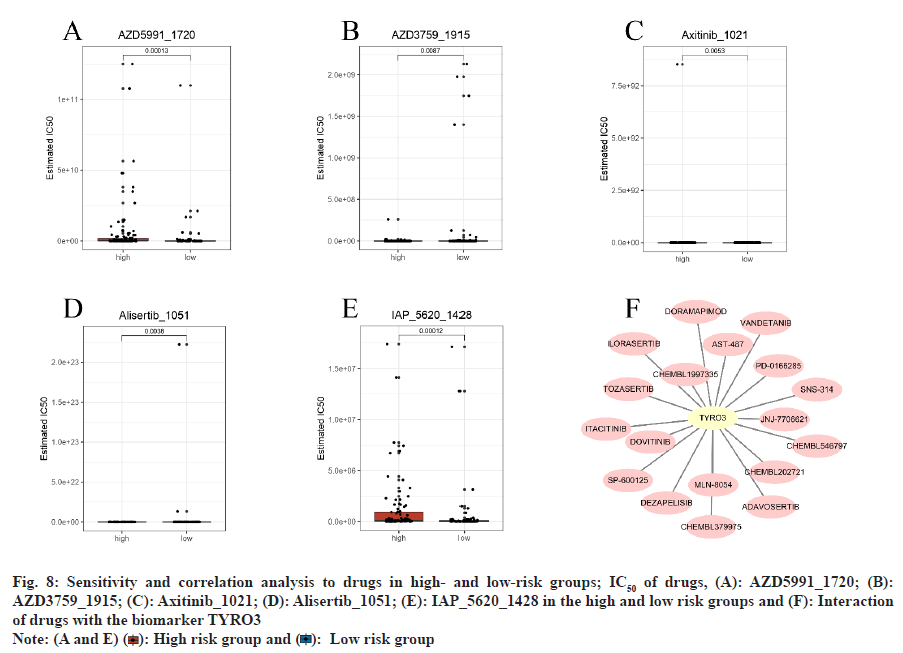
In the training set, analysis of the GDSC database predicted 198 potential drugs for PTC. Drugs such as AZD5991_1720 and IAP_5620_1428 exhibited significantly higher IC50 values in the high-risk group by comparing with the low-risk group (p<0.05) (fig. 8A-fig. 8E). Additionally, based on prognosticrelated genes, 18 TYRO3-associated drugs were identified in the DGIdb database, including AST-487, JNJ-7706621, dovitinib, and CHEMBL1997335. However, no drugs associated with CXCL5 and FNDC4 were identified (fig. 8F and Table 2).
| Gene | Drug | Source |
|---|---|---|
| TYRO3 | DEZAPELISIB | TTD |
| TYRO3 | TOZASERTIB | DTC |
| TYRO3 | AST-487 | DTC |
| TYRO3 | SNS-314 | DTC |
| TYRO3 | PD-0166285 | DTC |
| TYRO3 | CHEMBL202721 | DTC |
| TYRO3 | ILORASERTIB | DTC |
| TYRO3 | JNJ-7706621 | DTC |
| TYRO3 | VANDETANIB | DTC |
| TYRO3 | ITACITINIB | TTD |
| TYRO3 | MLN-8054 | DTC |
| TYRO3 | DOVITINIB | DTC |
| TYRO3 | CHEMBL1997335 | DTC |
| TYRO3 | CHEMBL379975 | DTC |
| TYRO3 | DORAMAPIMOD | DTC |
| TYRO3 | SP-600125 | DTC |
| TYRO3 | ADAVOSERTIB | DTC |
| TYRO3 | CHEMBL546797 | DTC |
Table 2: Drug Prediction Based on the Prognostic-Related Genes
Fig. 8: Sensitivity and correlation analysis to drugs in high- and low-risk groups; IC50 of drugs, (A): AZD5991_1720; (B):
AZD3759_1915; (C): Axitinib_1021; (D): Alisertib_1051; (E): IAP_5620_1428 in the high and low risk groups and (F): Interaction
of drugs with the biomarker TYRO3
Note: (A and E)  High risk group and
  Low risk group
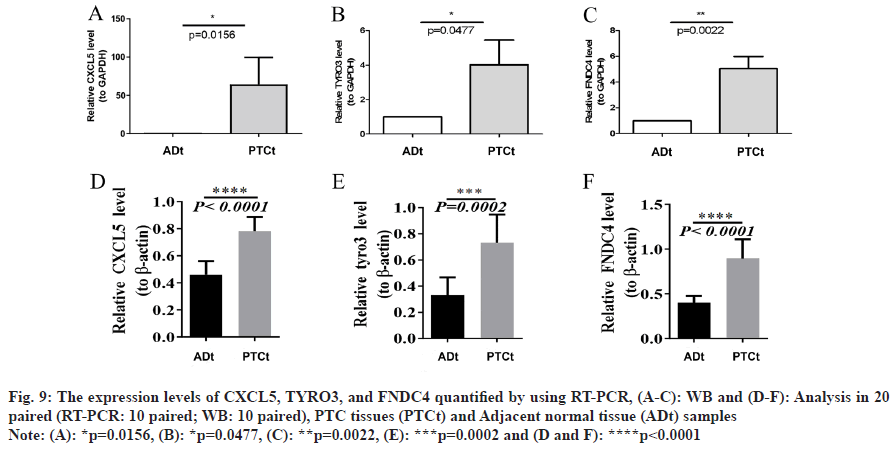
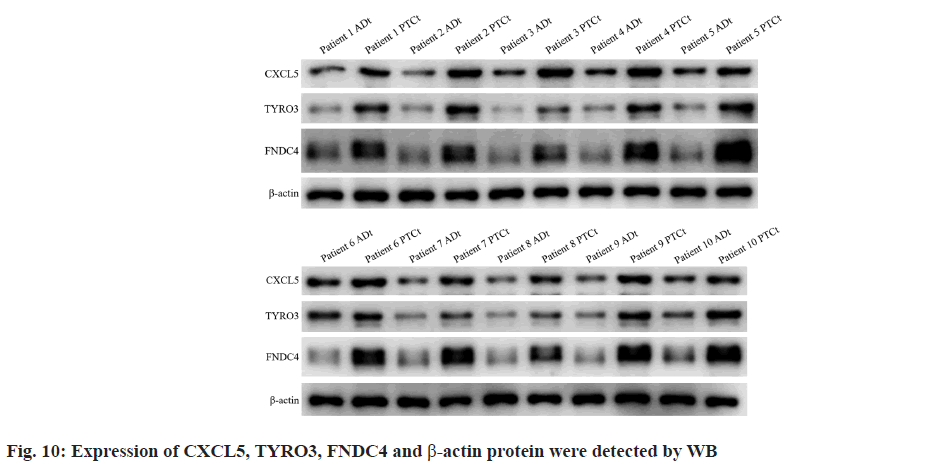
qRT-PCR (fig. 9A-fig. 9C) and WB (fig. 9D-fig. 9F) analyses revealed that mRNA expression degrees of prognostic-related genes CXCL5, TYRO3, and FNDC4 were significantly higher in PTC samples by comparing with adjacent normal samples (p<0.05). The raw data for WB are shown in fig. 10. These findings align with earlier predictions made using the GSE29625 and TCGA-PTC datasets.
Fig. 9: The expression levels of CXCL5, TYRO3, and FNDC4 quantified by using RT-PCR, (A-C): WB and (D-F): Analysis in 20
paired (RT-PCR: 10 paired; WB: 10 paired), PTC tissues (PTCt) and Adjacent normal tissue (ADt) samples
Note: (A): *p=0.0156, (B): *p=0.0477, (C): **p=0.0022, (E): ***p=0.0002 and (D and F): ****p<0.0001
THCA represents the most prevalent form of endocrine malignancy, with PTC occupying over 80 % of all cases. Further, the incidence of PTC is steadily on the rise[1,2]. The development of a novel prognostic signature is imperative to enhance the capacity of forecasting the prognosis of PTC patients more effectively. Necroptosis, which constitutes a newly observed programmed form of necrotic cell death, has garnered significant attention due to numerous studies demonstrating its association with the dysregulation of necroptosis and its close relationship with various human diseases. Dual roles of necroptosis in cancer have been illustrated; necroptotic is suggested to promote cancer progression[15], while protecting against tumor development if apoptosis is compromised[14]. Nevertheless, the promising significance of the necroptosis-related genes in PTC remains unclear and limited studies have reported its role in PTC diagnosis, prognosis and treatment. Therefore, the use of necroptosis-related signatures as a novel biomarker for the prognosis of PTC was explored in the current research.
In the current research, firstly, 32 DENRGs with PTC were obtained through differential analysis. The outcomes of GO and KEGG analyses reveals that these DENRGs were mostly associated with necroptosis, apoptosis, immune and inflammatory responsemediated cell death, as well as the TNF-mediated signaling pathway, NF-κB signaling pathway, and TNF signaling pathway. Notably, previous research has shown that these pathways may take part in the progression of PTC[22]. Wen et al.[23] reported that Meis Homeobox 2 (MEIS2) stops proliferation and drives apoptosis of THCA cells through the NF-κB signaling pathway. Luo et al.[24] indicated that FOXP4-AS1 acts as an inhibitor of proliferation and migration in papillary thyroid carcinoma by modulating the Protein Kinase B (Akt) signaling pathway. Another study revealed the novel role of galectin-3 and Tg in THCA and elucidation of the potential contribution of TNF-α[25]. Thus, a hypothesis could be made that these DENRGs might play a critical role in THCA by regulating necroptosis. In the current research, a novel prognostic model made up of CXCL5, TYRO3 and FNDC4 was constructed to forecast the survival of the TCGA-PTC cohort. On basis of the risk score, the survival analysis results show that the low-risk group acquired a greatly better Overall Survival (OS). Besides, the AUC analysis results suggest that the prognostic model shows an excellent predictive value for PTC patient’s prognoses. The outcomes of univariate COX regression and multivariate COX regression analyses also confirm that the risk score could be regarded as a separate prognostic risk, which was greatly demonstrated in isolated external cohorts GSE29625 and TCGA-PTC datasets. CXCL5, a member of the CXC-type chemokine family, has been observed to be a significant factor in tumorigenesis and cancer progression[26]. Existing research has revealed that CXCL5 is overexpressed in nasopharyngeal carcinoma, breast cancer, nonsmall cell lung cancer, hepatocellular carcinoma and pancreatic adenocarcinoma, while grown expression of CXCL5 is related to advanced tumor stages, local invasion, neutrophil infiltration and metastatic potential[27-32]. Research regarding the role of CXCL5 in PTC is currently ongoing. The activated CXCL5- CXCR2 axis exerts a significant effect on driving the migration, invasion, and epithelial-to-mesenchymal transition of PTC cells, and it achieves this by modulating the β-catenin pathway. Chang et al.[33] verified that down-regulating CXCL5 inhibited the malignant behavior of THCA cells. Members of the TAM (TYRO3, AXL, and MER) family of receptor tyrosine kinases are famous for their anti-apoptotic, oncogenic, and anti-inflammatory effects. While the functions of AXL and MER in these contexts have been extensively documented, the precise roles of TYRO3 remain largely unknown[34]. Expression of TYRO3 has been noted in a variety of malignancies and recent studies have shown that a positive and negative association between the expression of TYRO3 and cancer growth and prognosis, respectively[35,36]. As such, TYRO3 has been put forward as a promising objective for cancer treatment. It has been displayed TYRO3 activates ordinary oncogenic signaling pathways including MAPK/Extracellular-Regulated Kinase (ERK) and Phosphatidylinositol 3-Kinase (PI3K)/Akt. In tumor cells, it has been reported that down-regulating TYRO3 via RNAi in breast, colon, head and neck and pancreatic cancers regulates the cellular signaling path by decreasing the phosphorylation of Signal Transducer and Activator of Transcription 3 (STAT3), Akt, and ERK[37-40]. FNDC4 is a member of the fibronectin type III domain family. At present, there are relatively few research reports on FNDC4 in tumors. Wang et al.[41] reported that elevated levels of FNDC4 expression were related to reduced survival rates and were found to promote increased migration and invasion in in vitro experiments. Li et al.[42] declared that FNDC4 expression is elevated in glioblastoma and closely associated with poor prognosis. Similarly, in the present study, findings were made that the mRNA and protein expression degrees of CXCL5, TYRO3 and FNDC4 were greatly increased in the PTC samples by comparing with the adjacent normal samples, which is generally consistent with the aforementioned predictions for the GSE29625 and TCGA-PTC datasets. Among the three prognosticrelated genes included in the TCGA-PTC datasets, the upregulation of CXCL5 was made in the highrisk group, while the upregulation of TYOR3 and FNDC4 was made in the low-risk group. Currently, researchers are actively investigating the mechanism of necroptosis in tumor development. Ando et al.[43] observed that in pancreatic cancer, necroptosis drives cancer cell migration and invasion through the release of CXCL5. Najafov et al.[34] identified that TYRO3 drives necroptosis through controlling the oligomerization of MLKL. Wang et al.[44] created a risk signature of seven necroptosis-related genes to forecast the prognosis of PTC patients. The results indicated that the overexpression of gene IPMK, KLF9, SPATA2 could greatly stop the propagation, invasion and migration of PTC cells. However, there is still a shortage of mechanistic studies examining the effect of necroptosis on the development of PTC. Through GO and KEGG enrichment analyses by GSEA, it could be hypothesized that CXCL5 may facilitate the invasion and migration of PTC cells through the activation of signaling pathways including c-Jun N-terminal kinase, ERK, and MAPK. Additionally, CXCL5 may contribute to the proliferation and colonization of PTC cells within the bone, potentially leading to bone metastasis, possibly via involvement in the chemokine signaling pathway and nuclear NF-κB signaling pathway. Presently, only Ren et al.[45] have shown that TYRO3 played a protective role in PTC patients, which is consistent with the present findings. Combined with its role in other cancers and the present bioinformatics analysis results, it could be hypothesized that TYRO3 is involved in the development of PTC through the activation of the Janus kinase-signal transducer and activator of transcription and PI3K/Akt signaling pathways. Notably, activated signaling pathways including MAPK, NF-κB, PI3K/Akt, and STAT were reported to affect the growth, invasion, and metastasis of THCA[22]. The present findings show, for the first time, the high expression of FNDC4 in PTCt and are associated with the prognosis of PTC patients. At present, the relevant mechanism of the three DENRGs in PTC is unclear, and further studies are required to elucidate the mechanisms of the three DENRGs in PTC.
The three DENRGs were also identified as being notably related to various immune-related pathways in the present study. It could be assumed that necroptosis may be related to the immunological microenvironment of PTC. Findings were made that the immune scores and the infiltration levels of the 27 immune cells were greatly higher in high-risk groups. A possible reason for this result may be that immune inflammatory cells employed by necroptosis can drive tumor growth by driving angiogenesis, accelerating cancer cell propagation, and promoting cancer metastasis[9,11]. Moreover, high-risk patients showed greater infiltration of different immunosuppressive cells, including gamma delta T cells, macrophages, immature dendritic cells, monocyte, plasmacytoid dendritic cells, Myeloid Derived Suppressor Cells (MDSCs), regulatory T cells (Treg), and T follicular helper cells. This suggests that there is an immunosuppressive microenvironment in high-risk patients. The immunosuppressive microenvironment serves as a critical mechanism allowing tumor cells to evade immune responses and facilitate the progression of the disease[46]. Cancer immunotherapy has emerged as a potential therapeutic method, demonstrating significant advancements in the field of treatment[47]. Significant differences were discovered in the expression of immune checkpoints. Most of the immune checkpoints, including BTLA, CD274, CD70, CTLA4, HAVCR2, ICOS, IDO1, PDCD1LG2, TIGIT, TNFRSF18, and TNFRSF9 were upregulated in the high-risk group, potentially indicating that PTC in the high-risk group controls the immune reaction by hijacking the immune checkpoint pathway to achieve immune escape. Meanwhile, no obvious difference in TMB between the high- and low-risk groups was identified. However, patients with high TMB was greatly lower survival probability than patients with low TMB. TMB has considerably significant prognostic value in immunotherapy as a biomarker of immune checkpoint blockade reaction, with a higher TMB standing for a greater likelihood of immunotherapy effectiveness[48]. Considering all the aforementioned results, it could be hypothesized that immunotherapy may be more effective for high-risk patients. In the present study, great diversities in IPS between highand low-risk groups in PD1 and CTLA4 treatment were found, suggesting that PD1 and CTLA4 may be significant factors in the treatment of the high-risk group. PD1 and CTLA4 are among the most effective T cell immune checkpoint molecules, exerting negative immune regulatory functions. The IPS has been identified as a highly reliable predicting agent of reaction to CTLA4 and anti-PD-1 antibodies, and its predictive value has been confirmed in two separate cohorts[47]. A variety of immune checkpoint inhibitors have been approved for immunotherapy in clinical tumors, and immunotherapy for THCA has entered the clinical research stage[49]. Further, in the present study, potential therapeutic drugs for treating PTC were explored, and 18 drugs associated with TYRO3 in the DGIdb were identified. Despite such findings, it is essential to conduct clinical studies in real-world settings to validate the described results.
Some limitations to the present research are found. The research was primarily investigated using bioinformatics methods, there may be variations between different algorithms, and the specific molecular mechanism of DENRGs in PTC remains unclear. Moreover, there are no prospective cohort studies available to verify the outcomes of the current research on patients with THCA undergoing immunotherapy. Additional basic and clinical experimental validation is needed to confirm the present findings.
In summary, a novel prognostic signature for PTC patients on basis of three DENRGs was constructed and validated. The study delved into its underlying molecular mechanism, evaluated the association between the risk models and the infiltration of immune cells, and offered fresh insights into potential immunotherapeutic targets aimed at enhancing the prognosis of individuals afflicted with PTC. The present outcomes may offer new insights for further examination of the effect of necroptosis on PTC and raise promising prospects for the development of personalized targeted therapies for PTC patients.
Authors’ contributions:
Conceptualization by Shiqi Wang and Ruochuan Cheng; data curation by Ying Peng and Wenchao Zhang; formal analysis by Xiangxiang Zhan; investigation by Dewei Rao and MiaoYang; methodology by Yanjun Su; software by Xiangxiang Zhan; supervision by Ruochuan Cheng; writingoriginal draft by Shiqi Wang; writing-review and editing by Ruochuan Cheng and Yanjun Su. Ruochuan Cheng and Yanjun Su have contributed same to the article and are the corresponding authors. All authors have read and agreed to the published version of the manuscript.
Ethical approval:
The study was conducted in accordance with the Declaration of Helsinki. The studies involving human participants were reviewed and approved by the Institutional Research Ethics Committees of the First Affiliated Hospital of Kunming Medical University (No: 34, 2021).
Funding:
This research was supported by the Ten Thousand Talents Plan of Yunnan Province-Special Fund for famous doctors (No: RLCRC20211206) and The Bethune Foundation Research Program for Young and Middle-Aged Thyroid Doctors (No: JKM2022-B06).
Data availability statement:
The public datasets were obtained from TCGA (https://portal.gdc.cancer.gov/), UCSC Xena (http://xena.ucsc.edu/), GEO (https://www.ncbi.nlm.nih.gov/geo/), GeneCards (http://www.genecards.org/), TCIA (https://tcia.at/), GDSC (https://www.cancerrxgene.org/) and DGIdb (http://www.dgidb.org) (GEO Accession No: GSE29265). These data are free and publicly available.
Conflict of interests:
The authors declare that the research was conducted in the absence of any commercial or financial relationships that could be construed as a potential conflict of interest.
References
- Miller KD, Nogueira L, Devasia T, Mariotto AB, Yabroff KR, Jemal A, et al. Cancer treatment and survivorship statistics, 2022. CA Cancer J Clin 2022;72(5):409-36.
[Crossref] [Google Scholar] [PubMed]
- Zheng R, Zhang S, Zeng H, Wang S, Sun K, Chen R, et al. Cancer incidence and mortality in China, 2016. Zhonghua Zhong Liu Za Zhi 2022;2(1):1-9.
[Crossref] [Google Scholar] [PubMed]
- Schneider DF, Chen H. New developments in the diagnosis and treatment of thyroid cancer. CA Cancer J Clin 2013;63(6):373-94.
[Crossref] [Google Scholar] [PubMed]
- National Cancer Center, Thyroid Cancer Expert Committee of National Cancer Quality Control Center. Quality control index for standardized diagnosis and treatment of thyroid cancer in China (2022 edition). Chin J Oncol 2022;44.
- Chen X, Lin S, Lin Y, Wu S, Zhuo M, Zhang A, et al. BRAF-activated WT1 contributes to cancer growth and regulates autophagy and apoptosis in papillary thyroid carcinoma. J Transl Med 2022;20(1):79.
[Crossref] [Google Scholar] [PubMed]
- Papaleontiou M, Norton EC, Reyes-Gastelum D, Banerjee M, Haymart MR. Competing causes of death in older adults with thyroid cancer. Thyroid 2021;31(9):1359-65.
[Crossref] [Google Scholar] [PubMed]
- Tao Y, Wang F, Shen X, Zhu G, Liu R, Viola D, et al. BRAF V600E status sharply differentiates lymph node metastasis-associated mortality risk in papillary thyroid cancer. J Clin Endocrinol Metabol 2021;106(11):3228-38.
[Crossref] [Google Scholar] [PubMed]
- Shaohao C,Yanjun S, Ruochuan C. Research progress on thyroglobulin and anti-thyroglobulin antibodies in the diagnosis and treatment of differentiated thyroid cancer. Chin J Clin Oncol 2020;47:1164-7.
- Hanahan D, Weinberg RA. Hallmarks of cancer: The next generation. Cell 2011;144(5):646-74.
[Crossref] [Google Scholar] [PubMed]
- Linkermann A, Green DR. Necroptosis. N Engl J Med 2014;370(5):455-65.
[Crossref] [Google Scholar] [PubMed]
- Gong Y, Fan Z, Luo G, Yang C, Huang Q, Fan K, et al. The role of necroptosis in cancer biology and therapy. Mol Cancer 2019;18:1-7.
[Crossref] [Google Scholar] [PubMed]
- Li XY, Su LX, Chen WX, Liu H, Zhang LY, Shen YC, et al. Clinical implications of necroptosis genes expression for cancer immunity and prognosis: A pan-cancer analysis. Front Immunol 2022;13:882216.
[Crossref] [Google Scholar] [PubMed]
- Bedoui S, Herold MJ, Strasser A. Emerging connectivity of programmed cell death pathways and its physiological implications. Nat Rev Mol Cell Biol 2020;21(11):678-95.
- Strilic B, Yang L, Albarrán-Juárez J, Wachsmuth L, Han K, Müller UC, et al. Tumour-cell-induced endothelial cell necroptosis via death receptor 6 promotes metastasis. Nature 2016;536(7615):215-8.
[Crossref] [Google Scholar] [PubMed]
- Höckendorf U, Yabal M, Herold T, Munkhbaatar E, Rott S, Jilg S, et al. RIPK3 restricts myeloid leukemogenesis by promoting cell death and differentiation of leukemia initiating cells. Cancer Cell 2016;30(1):75-91.
[Crossref] [Google Scholar] [PubMed]
- Ritchie ME, Phipson B, Wu DI, Hu Y, Law CW, Shi W, et al. limma powers differential expression analyses for RNA-sequencing and microarray studies. Nucl Acids Res 2015;43(7):e47.
[Crossref] [Google Scholar] [PubMed]
- Broom BM, Ryan MC, Brown RE, Ikeda F, Stucky M, Kane DW, et al. A galaxy implementation of next-generation clustered heatmaps for interactive exploration of molecular profiling data. Cancer Res 2017;77(21):23-6.
[Crossref] [Google Scholar] [PubMed]
- Yu G, Wang LG, Han Y, He QY. clusterProfiler: An R package for comparing biological themes among gene clusters. OMICS 2012;16(5):284-7.
[Crossref] [Google Scholar] [PubMed]
- In J, Lee DK. Survival analysis: Part II-applied clinical data analysis. Korean J Anesthesiol 2019;72(5):441-57.
[Crossref] [Google Scholar] [PubMed]
- Robin X, Turck N, Hainard A, Tiberti N, Lisacek F, Sanchez JC, et al. pROC: An open-source package for R and S+ to analyze and compare ROC curves. BMC Bioinformatics 2011;12:1-8.
[Crossref] [Google Scholar] [PubMed]
- Wilkerson MD, Hayes DN. ConsensusClusterPlus: A class discovery tool with confidence assessments and item tracking. Bioinformatics 2010;26(12):1572-3.
[Crossref] [Google Scholar] [PubMed]
- Jin S, Yang YT, Bao W. Signaling pathways in thyroid cancer. Vitam Horm 2018;106:501-15.
[Crossref] [Google Scholar] [PubMed]
- Wen X, Liu M, Du J, Wang X. Meis homeobox 2 (MEIS2) inhibits the proliferation and promotes apoptosis of thyroid cancer cell and through the NF-κB signaling pathway. Bioengineered 2021;12(1):1766-72.
[Crossref] [Google Scholar] [PubMed]
- Luo X, Gao Q, Zhou T, Tang R, Zhao Y, Zhang Q, et al. FOXP4-AS1 inhibits papillary thyroid carcinoma proliferation and migration through the AKT signaling pathway. Front Oncol 2022;12:900836.
[Crossref] [Google Scholar] [PubMed]
- Okda TM, Atwa GM, Eldehn AF, Dahran N, Alsharif KF, Elmahallawy EK. A novel role of galectin-3 and thyroglobulin in prognosis and differentiation of different stages of thyroid cancer and elucidation of the potential contribution of Bcl-2, IL-8 and TNF-α. Biomedicines 2022;10(2):352.
[Crossref] [Google Scholar] [PubMed]
- Hu B, Fan H, Lv X, Chen S, Shao Z. Prognostic significance of CXCL5 expression in cancer patients: A meta-analysis. Cancer Cell Int 2018;18:1-2.
[Crossref] [Google Scholar] [PubMed]
- Li X, Wang M, Gong T, Lei X, Hu T, Tian M, et al. A S100A14-CCL2/CXCL5 signaling axis drives breast cancer metastasis. Theranostics 2020;10(13):5687.
[Crossref] [Google Scholar] [PubMed]
- Qiu WZ, Zhang HB, Xia WX, Ke LR, Yang J, Yu YH, et al. The CXCL5/CXCR2 axis contributes to the epithelial-mesenchymal transition of nasopharyngeal carcinoma cells by activating ERK/GSK-3β/snail signaling. J Exp Clin Cancer Res 2018;37:1-7.
[Crossref] [Google Scholar] [PubMed]
- Deng J, Ma X, Ni Y, Li X, Xi W, Tian M, et al. Identification of CXCL5 expression as a predictive biomarker associated with response and prognosis of immunotherapy in patients with non-small cell lung cancer. Cancer Med 2022;11(8):1787-95.
[Crossref] [Google Scholar] [PubMed]
- Nie Y, Jiang MC, Liu C, Liu Q, Zhu X. CXCL5 has potential to be a marker for hepatocellular carcinoma prognosis and was correlating with immune infiltrates. Front Oncol 2021;11:637023.
[Crossref] [Google Scholar] [PubMed]
- Zhang R, Liu Q, Peng J, Wang M, Li T, Liu J, et al. CXCL5 overexpression predicts a poor prognosis in pancreatic ductal adenocarcinoma and is correlated with immune cell infiltration. J Cancer 2020;11(9):2371.
[Crossref] [Google Scholar] [PubMed]
- Cui D, Zhao Y, Xu J. Activated CXCL5-CXCR2 axis promotes the migration, invasion and EMT of papillary thyroid carcinoma cells via modulation of β-catenin pathway. Biochimie 2018;148:1.
[Crossref] [Google Scholar] [PubMed]
- Chang W, Chang Q, Lu H, Liu S, Li Y, Chen C. MicroRNA-873-5p suppresses cell malignant behaviors of thyroid cancer via targeting CXCL5 and regulating P53 pathway. Hum Vaccines Immunother 2022;18(5):2065837.
- Najafov A, Mookhtiar AK, Luu HS, Ordureau A, Pan H, Amin PP, et al. TAM kinases promote necroptosis by regulating oligomerization of MLKL. Mol Cell 2019;75(3):457-68.
[Crossref] [Google Scholar] [PubMed]
- Jiang Z, Lim SO, Yan M, Hsu JL, Yao J, Wei Y, et al. TYRO3 induces anti-PD-1/PD-L1 therapy resistance by limiting innate immunity and tumoral ferroptosis. J Clin Invest 2021;131(8):e139434.
[Crossref] [Google Scholar] [PubMed]
- Smart SK, Vasileiadi E, Wang X, de Ryckere D, Graham DK. The emerging role of TYRO3 as a therapeutic target in cancer. Cancers 2018;10(12):474.
- Kim HD, Park EJ, Choi EK, Song SY, Hoe KL, Kim DU. G-749 promotes receptor tyrosine kinase TYRO3 degradation and induces apoptosis in both colon cancer cell lines and xenograft mouse models. Front Pharmacol 2021;12:730241.
[Crossref] [Google Scholar] [PubMed]
- Morimoto M, Horikoshi Y, Nakaso K, Kurashiki T, Kitagawa Y, Hanaki T, et al. Oncogenic role of TYRO3 receptor tyrosine kinase in the progression of pancreatic cancer. Cancer Lett 2020;470:149-60.
[Crossref] [Google Scholar] [PubMed]
- Ruicci KM, Meens J, Plantinga P, Stecho W, Pinto N, Yoo J, et al. TAM family receptors in conjunction with MAPK signaling are involved in acquired resistance to PI3Kα inhibition in head and neck squamous cell carcinoma. J Exp Clin Cancer Res 2020;39:1-8.
[Crossref] [Google Scholar] [PubMed]
- Tsai CL, Chang JS, Yu MC, Lee CH, Chen TC, Chuang WY, et al. Functional genomics identifies hepatitis-induced STAT3-TYRO3-STAT3 signaling as a potential therapeutic target of hepatoma. Clin Cancer Res 2020;26(5):1185-97.
[Crossref] [Google Scholar] [PubMed]
- Wang B, Zheng B, Lu Y, Huang D, Liu J, Song J, et al. FNDC4 acts as an extracellular factor to promote the invasiveness of hepatocellular carcinoma partly via the PI3K/Akt signaling pathway. Cancer Med 2021;10(20):7242-52.
[Crossref] [Google Scholar] [PubMed]
- Li H, Yan X, Ou S. Correlation of the prognostic value of FNDC4 in glioblastoma with macrophage polarization. Cancer Cell Int 2022;22(1):273.
- Ando Y, Ohuchida K, Otsubo Y, Kibe S, Takesue S, Abe T, et al. Necroptosis in pancreatic cancer promotes cancer cell migration and invasion by release of CXCL5. PLoS One 2020;15(1):e0228015.
[Crossref] [Google Scholar] [PubMed]
- Wang Z, Wu P, Shi J, Ji X, He L, Dong W, et al. A novel necroptosis-related gene signature associated with immune landscape for predicting the prognosis of papillary thyroid cancer. Front Genet 2022;13:947216.
[Crossref] [Google Scholar] [PubMed]
- Ren X, Du H, Cheng W, Wang Y, Xu Y, Yan S, et al. Construction of a ferroptosis-related eight gene signature for predicting the prognosis and immune infiltration of thyroid cancer. Front Endocrinol 2022;13:997873.
[Crossref] [Google Scholar] [PubMed]
- Hua X, Ge S, Zhang J, Xiao H, Tai S, Yang C, et al. A costimulatory molecule-related signature in regard to evaluation of prognosis and immune features for clear cell renal cell carcinoma. Cell Death Discov 2021;7(1):252.
- Charoentong P, Finotello F, Angelova M, Mayer C, Efremova M, Rieder D, et al. Pan-cancer immunogenomic analyses reveal genotype-immunophenotype relationships and predictors of response to checkpoint blockade. Cell Rep 2017;18(1):248-62.
- Jardim DL, Goodman A, de Melo Gagliato D, Kurzrock R. The challenges of tumor mutational burden as an immunotherapy biomarker. Cancer Cell 2021;39(2):154-73.
[Crossref] [Google Scholar] [PubMed]
- Zhou W, Lin J, Liu J, Zhang R, Fan A, Xie Q, et al. Thyroid cancer risk prediction model using m6A RNA methylation regulators: Integrated bioinformatics analysis and histological validation. Aging (Albany NY) 2023;15(3):846.
[Crossref] [Google Scholar] [PubMed]
