- *Corresponding Author:
- L. Mehta
KIET School of Pharmacy, KIET Group of Institutions, Delhi-NCR, Ghaziabad, Uttar Pradesh 201206, India
E-mail: mehta.lovekesh@gmail.com
| Date of Received | 30 August 2021 |
| Date of Revision | 07 December 2021 |
| Date of Acceptance | 14 June 2022 |
| Indian J Pharm Sci 2022;84(3):762-771 |
This is an open access article distributed under the terms of the Creative Commons Attribution-NonCommercial-ShareAlike 3.0 License, which allows others to remix, tweak, and build upon the work non-commercially, as long as the author is credited and the new creations are licensed under the identical terms
Abstract
Drug metabolism is very important in determining the safety and efficacy of the drug. We worked towards this direction and designed a new strategy to study the in vitro metabolites of Food and Drug Administration approved anticancer drug, ibrutinib which is known to inhibit the Bruton’s tyrosine kinase. The metabolites were formed by incubating the drug, ibrutinib with rat liver microsomes, at 37° for 24 h. The newly formed metabolites were identified and characterized with the help of ultra-high performance liquid chromatography which is interlinked with tandem quadrupole time-of-flight mass spectrometry. We then elucidated the structures of our new metabolites based on liquid chromatography with tandem mass spectrometry data which included accurate masses, the fragmentation of ions and chromatographic retention times. This study described the detailed in vitro metabolite profiling of ibrutinib which will be further helpful to predict the in vivo metabolism of ibrutinib in the human body. Enzyme kinetic parameters (Km and Vmax) for both the metabolites were also established using different substrate concentrations. This newly developed biotransformation method will further help in determining the elimination mechanism of ibrutinib which in turn will assist in predicting the effectiveness and toxicity of the drug.
Keywords
Ibrutinib, rat liver microsomes, in vitro metabolites, enzyme kinetics, liquid chromatography with tandem mass spectrometry
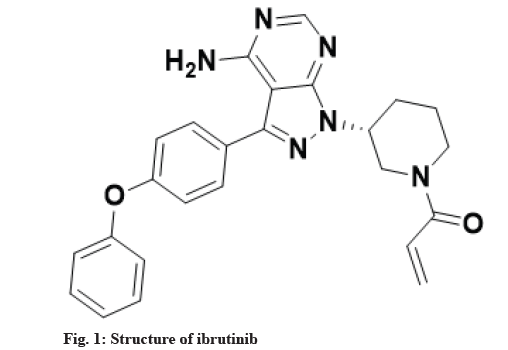
Metabolism is a biotransformation process where various drugs are bio catalyzed into different chemical forms with the utilization of inherent enzymes. In drug discovery process, one of the major challenges is to rapidly and accurately predict in vivo metabolism of drugs, their pharmacokinetics and toxicity. One of the approaches for such prediction can be in vitro bioanalytical methodologies for drug metabolism and corresponding pharmacokinetic studies. Researchers are utilizing different in vitro models for the estimation of metabolites which include hepatic and non-hepatic microsomes, purified or recombinant human cytochromes expressed in cell lines, specific cytochromes inhibitors-Small molecule inhibitors, S9 liver fraction, cell lines of human or animal hepatocytes and liver slices as such[1]. Among many sites/organs in the body which are known for drug metabolism (liver, kidney, intestine, lungs, nasal epithelium, brain and skin), liver is the site for metabolism of maximum number of the drugs due to presence of plethora of cytochromes based enzymes[2]. The metabolism of drugs is categorized into two groups namely, phase I and phase II metabolism reactions through which hydrophilicity of drugs is increased so that it can be easily excreted and toxicity is thereby decreased[3]. Ibrutinib, a United States Food and Drug Administration (USFDA) approved drug, chemically known as 1-[(3R)-3-[4-amino-3-(4-phenoxyphenyl)-1H-pyrazolo[3,4-d] pyrimidin-1-yl]piperidin-1-yl)prop-2-en-1-one is a white to off-white solid powder soluble in polar solvents like Acetonitrile (ACN), methanol and water[4]. It is irreversible and elective small molecule which is used in the treatment of patients with chronic lymphocytic leukemia by binding permanently to a protein/enzyme, Bruton’s Tyrosine Kinase (BTK) inhibits B-Cell Antigen Receptor (BCR) signaling in human B-cells via specific active-site occupancy[5-7]. Ibrutinib leads to inhibition of BTK activity by forming an irreversible covalent bond with a cysteine residue in the BTK active site selectively[8-10]. It decreases chronic lymphocytic cancer cell chemotaxis and prevents cellular linkage followed by stimulus at the BCR[11-13]. Structure of ibrutinib is shown in fig. 1. The in vitro metabolic profile of ibrutinib with many metabolites has been given in the literature with different source of metabolic enzymes for biotransformation e.g. hepatocytes of human, dog and rat[14], specific cytochrome enzyme (CYP3A4*22)[15] but not with any liver microsomes. Since, drug metabolism study with liver microsomes is more convenient in comparison to cell lines or purified specific cytochromes, thus study with liver microsomes remained to cover with scientific way.
In vitro methods are developed in which the metabolism of drugs is studied outside the body using liver microsomal enzymes from small animals (rat, mice or guinea pig). The identification and characterization of metabolites formed had been a very challenging task, but with the advancement in technology, new analytical methods are now available for the qualification, quantification and identification of novel metabolites. Liquid Chromatography coupled with Mass Spectrometry (LC-MS) had proven itself as the most powerful analytical tool for the identification of drug metabolites. The samples generated after in vitro incubation and in vivo exposure are then injected for metabolite profiling and identification by Liquid Chromatography with Tandem Mass Spectrometry (LC-MS/MS). There are several LC-MS/MS and High Performance Liquid Chromatography (HPLC) methods available in literature showing the capacity to analyze the degradation products of different anticancer drugs[16-18].
The present work was designed to study in vitro metabolism of anticancer drug, ibrutinib using RLM and to characterize the formed metabolites[19] using LCMS/ MS. The study also discusses the precise and rapid method with the column (Charged Surface Hybrid (CSH) C18 100×2.1 mm×1.7 μ) to separate, identify and characterize the formed phase-I metabolites of ibrutinib. Based on the data of the sophisticated LC-MS/ MS technique, the probable structures of metabolites of ibrutinib were proposed.
Materials and Methods
Chemicals and reagents:
Pharmaceutical grade ibrutinib standard was procured from MSN Laboratories Limited, Hyderabad, as a gift sample. All solvents, chemicals and reagents used in the current study were of analytical grade procured from Merck life sciences, Bangalore, India. LC-MS grade ACN, formic acid was procured from JT Baker. Tris(hydroxymethyl)aminomethane (Tris) buffer, Sodium hydroxide (NaOH) was purchased from Merck (Mumbai, India). The solutions used in the study were filtered through 0.22 μm filter paper (Millipore, India). Purification of water used for the preparation of solution was done by the Milli-Q-Plus system.
Preparation of RLM:
Male Wistar rat used for liver procurement was approved for experimentation from ethical committee (Institutional Animal Ethic Committee (IAEC) /56/1060) and was not exposed to any form of medication before. The entire procedure was performed at refrigerated (0°-4°) temperature using an ice bath. The excised livers (20 g per batch and 5 such batches) were frozen, finely cut with scissors and the excised liver was homogenized using four times (40 ml) the weight of the liver of Tris buffer (pH 7.4). The homogenate was subjected to centrifugation at 4° for about 10 min, the centrifugation chamber and the supernatant was maintained at 4° and solid calcium chloride was added to the supernatant (10 mM final concentration) with continuous stirring. The firmly packed pellets with the help of a homogenizer was obtained and stored in cold condition (-70°) for further use. The prepared Rat Liver Microsomes (RLM) was evaluated for its activity and retention using p-nitrophenol as substrate to CYP2E1[20]. The results showed its specific activity 110.6±13.5 pmol/min/mg protein which was between the range of different polymorphic forms[21].
Microsomal metabolism of ibrutinib:
Microsomal drug metabolism was carried out by incubating RLM with ibrutinib in Eppendorf (EP) tubes having a capacity of 1.5 ml. Incubation system comprised of Tris buffer (0.05 M, pH 7.4), RLM, Nicotinamide Adenine Dinucleotide Phosphate (NADPH) generating system and ibrutinib solution (prepared with the final concentration of 0.2 mM) with a total volume of 1.0 ml. NADPH generated solution comprises glucose 6-phosphate, NADP and magnesium chloride. Incubation was performed for 30 min at about 37° and the metabolic reaction was enhanced with the help of the NADPH generating system[22]. After 30 min of incubation, the metabolic reaction was quenched by 1.0 ml 0.5 M NaOH. Control incubation was also carried out simultaneously without the addition of RLM in the incubation system to define the contamination or interference obtained due to incubation components. Before injecting into the Ultra-Performance Liquid Chromatographic (UPLC) system, samples were kept in refrigerated conditions. The incubation mixture was filtered through a 0.22 μm filter before injecting into the UPLC system. All the reactions were performed in triplicate.
Sample preparation for LC analysis:
Samples were extracted using ethyl acetate before injecting them into the LC system. After extraction, both the aqueous and organic layers were allowed to separate. The organic layer (ethyl acetate) was evaporated at 45° until dry on a water bath for nearly about 2-3 h. After drying, the volume was made up with diluent to achieve the final nominal concentration and injected into the UPLC system.
Optimized UPLC conditions:
The analysis of the drug was executed on an UPLC system equipped with a Quaternary Solvent Manager (QSM), a 20 μl injection loop (Rheodyne® 7725i) and a Photodiode Array (PDA) detector. The chromatograms were analyzed using Empower 2.0 software. Drug substances and its metabolites were separated with a reverse phase CSH C18 column (100 mm×2.1 mm×1.7 μm). The composition of the mobile phase was phosphate buffer, triethylamine (pH-6) and Eluent-B: ACN with flow rate 0.3 ml/min using a gradient mode of elution (Tmin/% B): 0/20, 10/70, 14.9/70 and 15/20 and column temperature was 45°. Run time was kept at 15 min and absorbance was monitored at 215 nm. Metabolites were recognized by evaluation of Retention Time (RT) and co-injection of standards (spiking the metabolite mixture with the authentic standard of drug). Optimized chromatographic conditions are given in Table 1.
| Column | Acquity UPLC CSH C18 (100´2.1 mm, 1.7 µm) |
|---|---|
| Eluent A | 20 mm potassium dihydrogen phosphate, 0.1 % v/v triethylamine, pH adjusted to 6.0 with dilute ortho-phosphoric acid solution |
| Eluent B | ACN |
| Elution type | Gradient |
| Injection volume | 5 µl |
| Flow rate | 0.3 ml/min |
| Detector, wavelength | PDA, 215 nm |
| Column temperature | 45° |
| Auto sampler temperature | 10° |
| Run time | 15 min |
| Diluent | Water:ACN (50:50)v/v |
| Sample/Nominal concentration | 100 µg/ml |
Note: PDA: Photo Diode Array detector
Table 1: Chromatographic Conditions for Optimized Method.
LC-MS instrumentation:
A new method for the identification and characterization of in vitro metabolites by LC-MS technology was developed. Chromatographic separation was carried out on an Agilent Technologies 1200 series LC system equipped with a column Waters CSH C18 column (2.1 mm internal diameter (id)×100 mm, 1.7 μ). A mobile phase consisting of Eluent-A: Ammonium acetate (20 mm, pH 6.0) and Eluent-B: ACN with flow rate of 0.3 ml/min using a gradient mode of elution (Tmin/% B): 0/20, 10/70, 14.9/70 and 15/20. The mobile phase was degassed on the sonicator and filtered through a 0.22 μm before the start of the analysis. The sample injection volume was 5 μl and detection was carried out at 215 nm. LC system coupled with an MS of Agilent technology with triple Quadrupole mass analyzer 6460 operated using Electrospray Ionization (ESI) source in positive mode. Analysis was performed in Selected Ion Monitoring (SIM) mode. It was chosen for the identification of the interested compound. The following parameters were set as capillary voltage: 3500 V, nebulizer voltage: 500 V, nebulizer pressure: 35 psi, sheath gas flow: 10 l/min, Sheath gas temperature: 350°, gas temperature: 300° with a gas flow: 10 l/min. Mass hunter software was used to do the acquisition and processing in the LC-MS system.
Enzymes kinetic evaluation:
Before evaluation of the enzyme kinetics, the environments for incubation period and concentrations of proteins in RLM were established to obtain a linear metabolic rate. Protein concentration in RLM was found to be 200 μg/μl. The rate of formation of M1 and M2 were linear within 30 min at 0.5 mg/ml of RLM. Therefore, for enzyme kinetic studies, the incubation mixture contained Tris-Hydrochloride (Tris-HCl) buffer (100 mM, pH 7.4), NADPH (1 mM), RLM (0.5 mg/ml) a series concentration of ibrutinib. Ten different concentration of substrate (20.0, 40.0, 60.0, 80.0, 100, 120, 140, 160, 180 and 200 mM) were assessed in triplicate. The incubation time was 30 min and the temperature condition was set at 37°.
Results and Discussion
For UPLC method development and standardization assay, the samples were prepared as per the specified incubation conditions. Standard ibrutinib was eluted at 7.6 min under the stated developed UPLC conditions. When RLM incubated ibrutinib solutions were spiked, two metabolites were observed based on their RTs. The unchanged ibrutinib was eluted at 7.6 min. The metabolites M1 and M2 were eluted at 5.35 and 6.48 min respectively. PDA analysis showed value of peak angle less than the peak threshold representing all peaks are pure and ruled out possibility of co-elution any other peak or metabolite in RLM treated ibrutinib solution. The chromatogram representing control sample (without RLM treatment) and microsomal incubation sample was shown below and substrate blank (enzyme without substrate) and enzyme blank (substrate without enzyme) was also injected and chromatograms were observed.
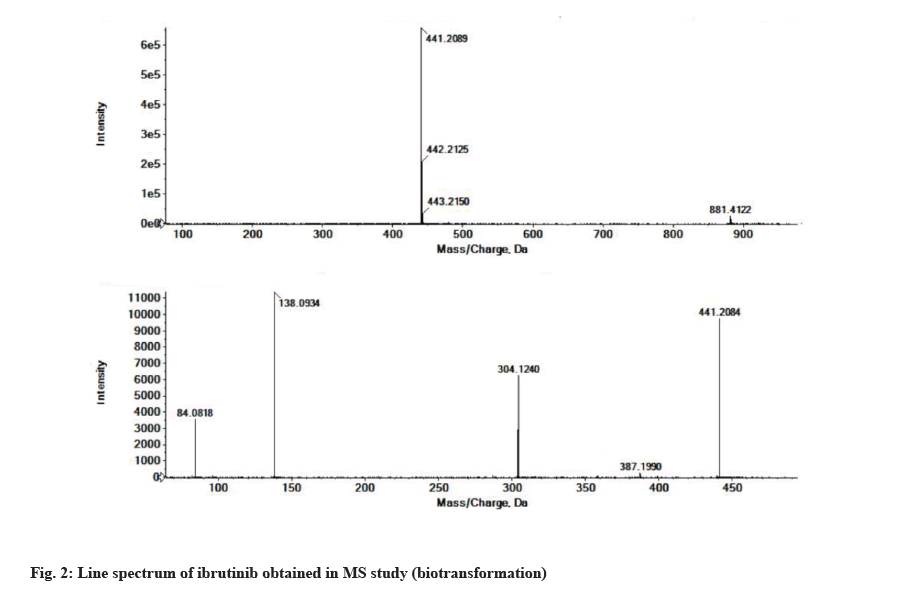
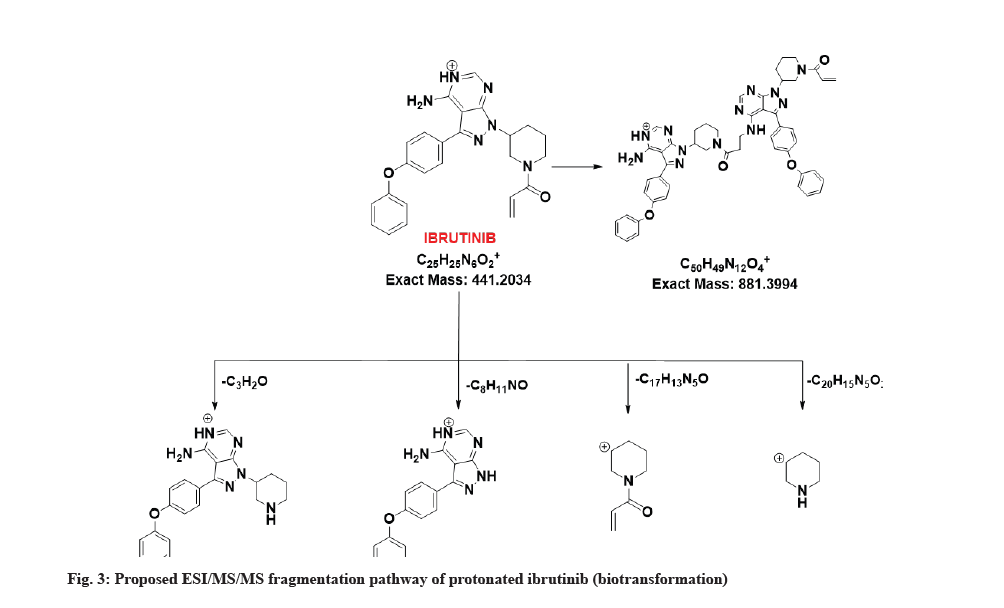
The LC-MS/MS line spectrum of the ibrutinib is depicted in fig. 2. The extracted sample was further analyzed for metabolite identification by the LC-MS technique. A total of two phase-I metabolites were observed using RLM. Total ions chromatograms of the test incubation showed three peaks for M1, M2 and ibrutinib respectively. The ibrutinib has a mass to charge ratio (m/z) value of 441.2089 Da (M+1) having the RT of 7.6 min in standard and incubation samples under the same LC/MS conditions. The fragmentation pattern for ibrutinib is depicted in fig. 3.
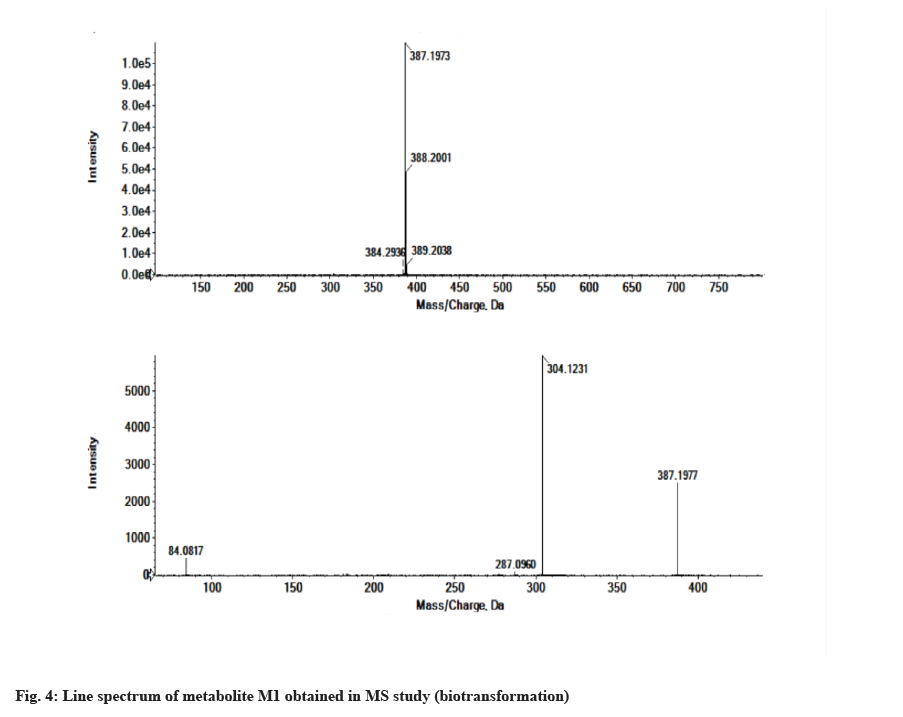
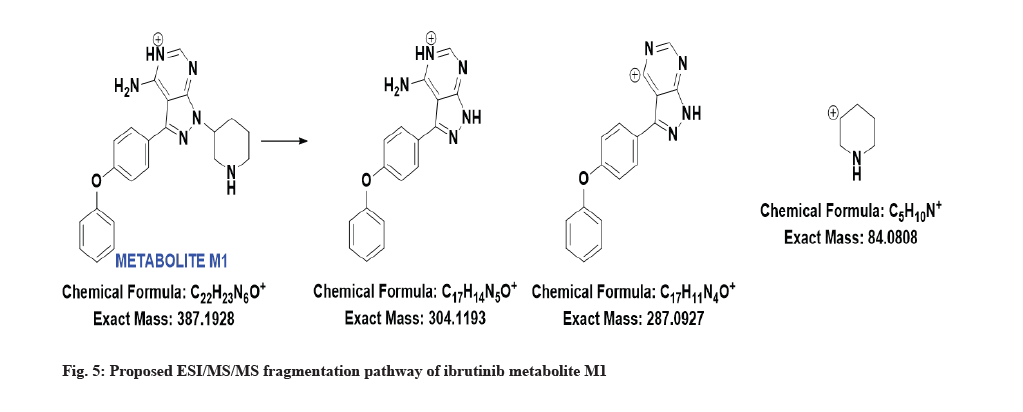
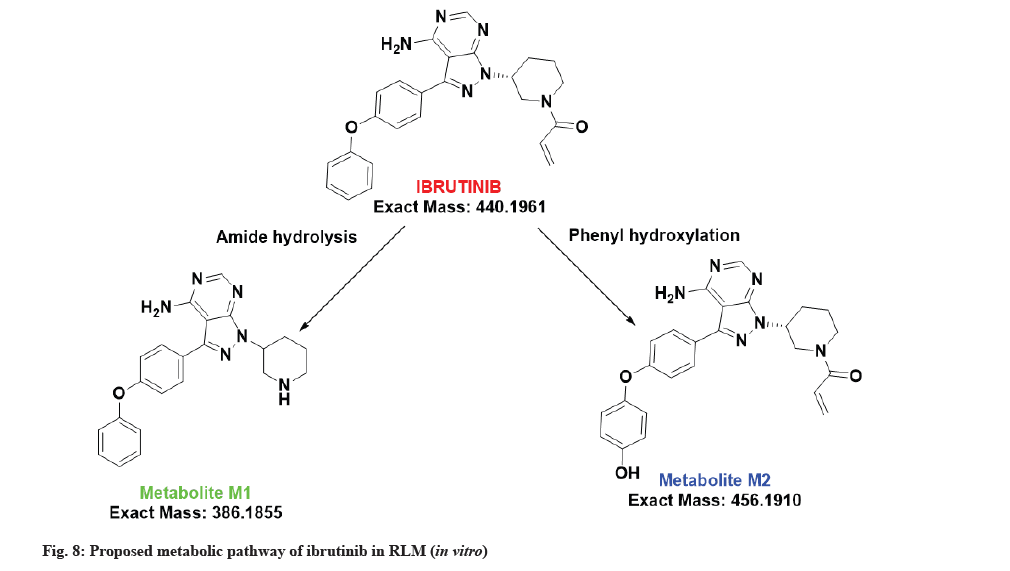
The LC-MS/MS line spectrum of the metabolite M1 is depicted in fig. 4. The metabolite M1 from the incubation mixture showed m/z value of 387.1973 Da (M+1) having a RT of 5.35 min and the difference in the m/z value (54 amu) indicated that amide hydrolysis followed by decarboxylation has taken place. Based on the mass observed, probable metabolite M1 can be 3-(4-phenoxyphenyl)-1-(piperidin-3-yl)-1Hpyrazolo[3,4-d]pyrimidin-4-amine. The fragmentation pattern for metabolite M1 is depicted in fig. 5.
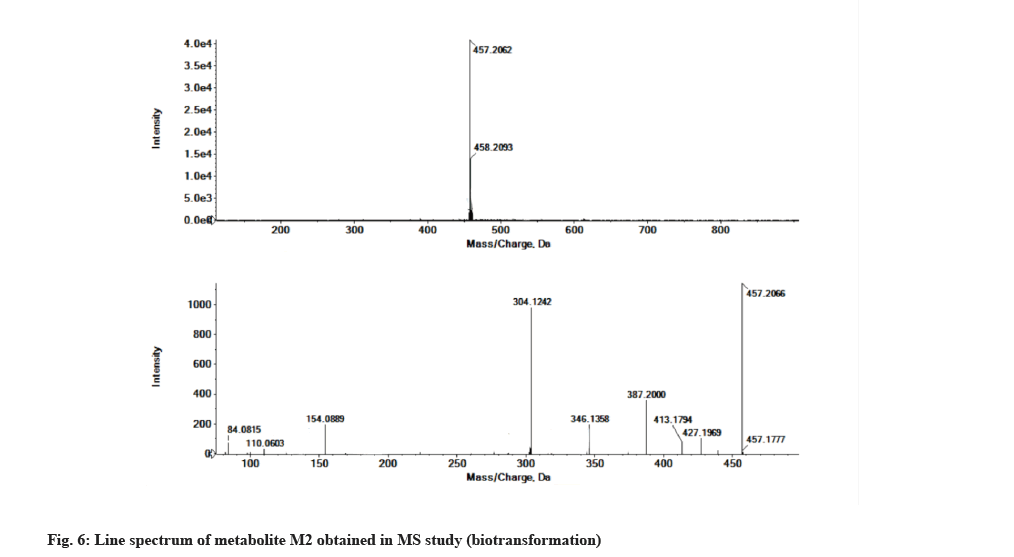
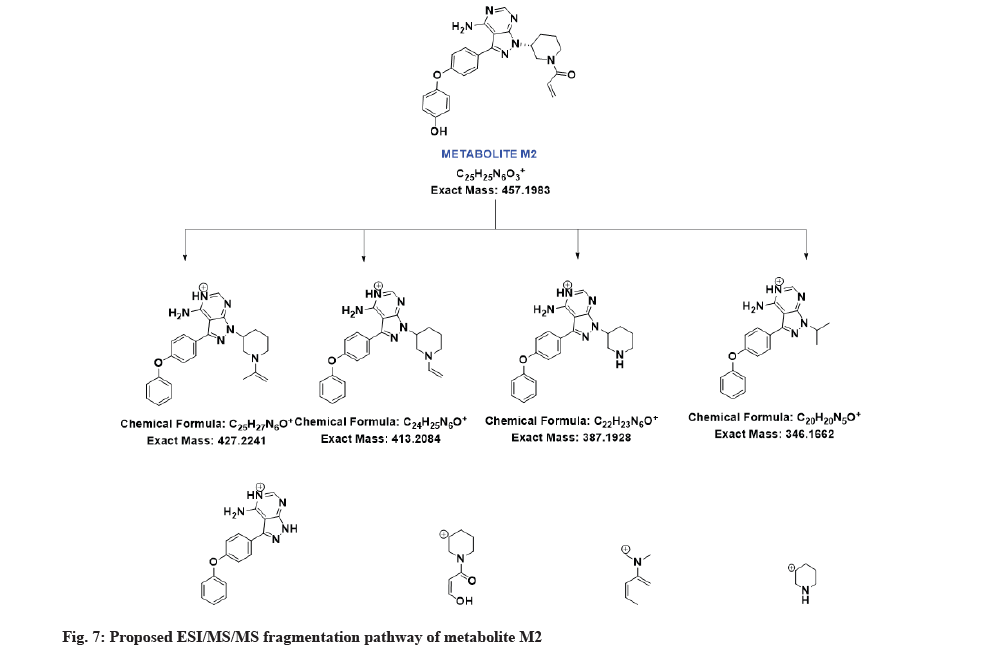
The LC-MS/MS line spectrum of the metabolite M2 is depicted in fig. 6. The metabolite M2 from the incubation mixture showed an m/z value of 457.2062 Da (M+1) having a RT of 6.48 min and the difference in the m/z value (16 amu) indicated that the phenyl hydroxylation has taken place in ibrutinib. Based on the mass observed, probable metabolite M2 can be (3-(4-amino-3-(4-(4-hydroxyphenoxy)phenyl)-1Hpyrazolo[3,4-d]pyrimidin-1-yl)piperidin-1-yl)prop-2-en-1-one.The fragmentation pattern for metabolite M2 is depicted in fig. 7.
The metabolite M1 accounting for the 2.44 % whereas metabolite M2 was a minor metabolite, accounting for a lesser percent, 0.94 %. The RT, measured and theoretical masses, mass errors and characteristic fragment ions of the proposed metabolites are summarized in Table 2.
| Compound | RT (min) | [M+H] (m/z) | Fragment ions | Molecular weight | Metabolic pathways |
|---|---|---|---|---|---|
| M0 | 7.63 | 441.2089 | 881.4122, 387.1990, 304.1240, 138.0934, 84.0818 | 440.1961 | Parent |
| M1 | 5.35 | 387.1973 | 304.1231, 287.0960, 84.0817 | 386.1855 | Amide hydrolysis followed by decarboxylation |
| M2 | 6.48 | 457.2062 | 427.1969, 413.1794, 387.2000, 346.1358, 304.1242,154.0889, 110.0603, 84.0815 | 456.1910 | Phenyl hydroxylation |
Note: After incubation of ibrutinib with RLM, two metabolites were formed. Their RT masses are included in this table
Table 2: RT, MS/MS and Characterization of Ibrutinib and its Metabolites.
The proposed metabolic pathway of ibrutinib is shown in fig. 8.
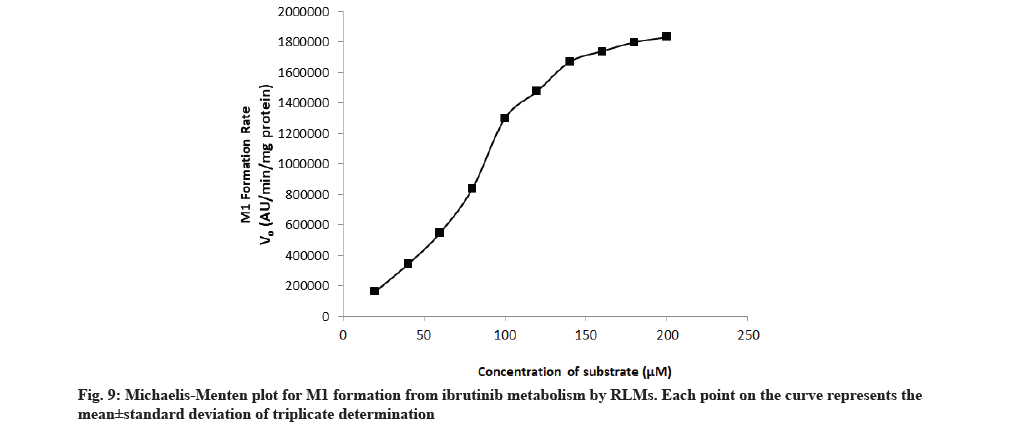
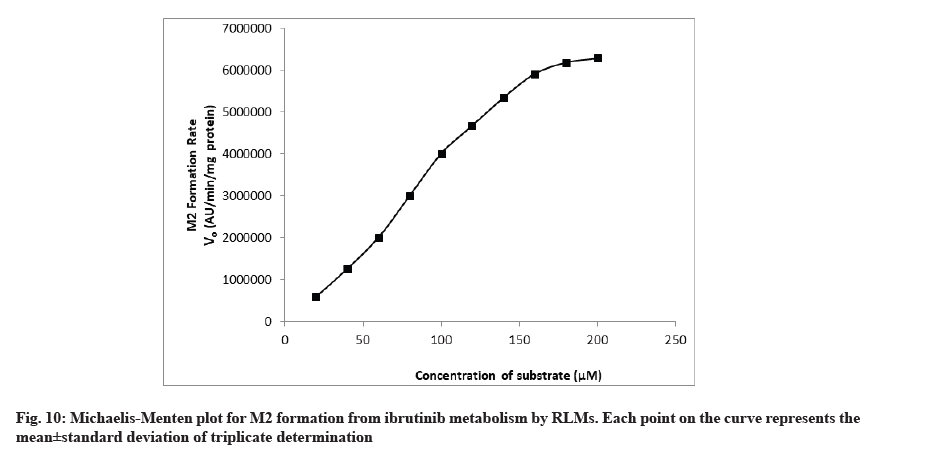
The rate of formation of metabolites M1 and M2 from ibrutinib by using RLM well suited to the Michaelis-Menten kinetics equation. The Michaelis-Menten enzyme kinetic plots of metabolite M1 and M2 are given in fig. 9 and fig. 10, respectively. The straight line obtained from the double reciprocal plot (1/S vs. I/V) provided a slope that corresponds to Km/ Vmax and intercept (1/Vmax) for both metabolites. The regression equation was y=0.0000256x-0.0000001 and the correlation coefficient (r2) was 0.9987 for M1 and regression equation was y=0.0001288x-0.0000003 and the r2 was 0.9951 for M2 metabolite. With the help of a double reciprocal plot, we obtained the Km and Vmax values of both the metabolites. The Km values for the formation of M1 and M2 were 256±11.67 μM and 425±15.17 μM in RLM, respectively. Km is a characteristic of any enzyme which shows affinity of an enzyme towards its range of substrates or range of enzymes for particular substrate. At constant enzyme concentration, lower enzyme Km value towards particular substrate suggests more affinity[23,24]. Since the RLM is not a pure enzyme, neither the content of different enzyme is known so affinity/Km value will also depend upon the content of enzyme along with the enzyme affinity. Hence, Km value obtained in this study was less in case of M1 so it is conclusive that the enzyme set present in the RLM has more affinity and/or content of converting substrate ibrutinib into M1.
Metabolite formed due to amide hydrolysis followed by decarboxylation (M1) in comparison to enzyme set for converting ibrutinib to corresponding phenyl hydroxylated metabolite (M2). In a research, purified cytochrome of different polymorphs were used and its outcome in terms of Km showed large variation (minimum 8.01±0.33 μM for CYP3A4.34 to maximum 193.53±97.66 μM for CYP3A4.2)[15] while our results of M1 and M2 are high Km value that can be attributed to the presence of large set of structural and other functional protein in the RLM in comparison to purified cytochromes.
In summary, our present study focused on prediction of in vitro drug metabolism of newly approved FDA drug, ibrutinib. The study also includes determination of metabolic pathways of the formed metabolites which are needed to clarify the effects of drug-metabolizing enzymes in vitro which will further assist in expanding the knowledge about hepatic biotransformation in vivo. Further, enzyme kinetic parameters (Km and Vmax) were also evaluated that will assist in pharmacokinetic studies of drug. Two metabolites of ibrutinib were identified and characterized using LC-MS/MS. Metabolism of ibrutinib was found to generate metabolite M1 due to amide hydrolysis followed by decarboxylation and to generate metabolite M2 due to phenyl hydroxylation. The method employed for separation and detection is quite accurate and able to detect the metabolites. The formed phase I metabolites might represent an important step in designing and planning future studies with ibrutinib.
Author’s contributions:
Parul Grover and Monika Bhardwaj contributed equally to this work.
Acknowledgements:
The authors are highly grateful to the Director Dr. (Col.) A. Garg and Joint Director, Dr. Manoj Goel, KIET Group of Institutions and Dr. K. Nagarajan, Principal, KIET School of Pharmacy, Ghaziabad for their motivation, all-round support and arranging research facilities. We are also very much thankful to MSN Laboratory, Hyderabad for providing us with pure drug as a gift sample to carry out the research.
Conflict of interests:
The authors declare that there are no conflicts of interest.
References
- Jia L, Liu X. The conduct of drug metabolism studies considered good practice (II): In vitro experiments. Curr Drug Metab 2007;8(8):822-9.
[Crossref] [Google Scholar] [PubMed]
- Schonborn JL. The role of the liver in drug metabolism anaesthesia tutorial of the week 179. World Federation of Societies of Anesthesiologists; 2010.
- Prakash C, Shaffer CL, Nedderman A. Analytical strategies for identifying drug metabolites. Mass Spectrom Rev 2007;26(3):340-69.
[Crossref] [Google Scholar] [PubMed]
- Honigberg LA, Smith AM, Sirisawad M, Verner E, Loury D, Chang B, et al. The Bruton tyrosine kinase inhibitor PCI-32765 blocks B-cell activation and is efficacious in models of autoimmune disease and B-cell malignancy. Proc Natl Acad Sci USA 2010;107(29):13075-80.
[Crossref] [Google Scholar] [PubMed]
- Neuman LL, Ward R, Arnold D, Combs DL, Gruver D, Hill W, et al. First-in-human phase 1a study of the safety, pharmacokinetics and pharmacodynamics of the noncovalent bruton tyrosine kinase (BTK) inhibitor SNS-062 in healthy subjects. Blood 2016;128(22):2032.
- Ponader S, Balasubramanian S, Pham LV, Chen J, Tamayo AT, Wang M, et al. Activity of Bruton's tyrosine kinase (Btk) inhibitor PCI-32765 in mantle cell lymphoma (MCL) identifies Btk as a novel therapeutic target. Blood 2011;118(21):3688.
- Wang L, Martin P, Blum KA, Kahl BS, Maeda LS, Advani R, et al. The Bruton's tyrosine kinase inhibitor PCI-32765 is highly active as single-agent therapy in previously-treated mantle cell lymphoma (MCL): Preliminary results of a phase II trial. Blood 2011;118(21):442.
- Sheridan C. Companies in rapid pursuit of Btk immunokinase. Nat Biotechnol 2012;30(3):199-200.
[Crossref] [Google Scholar] [PubMed]
- de Vries R, Smit JW, Hellemans P, Jiao J, Murphy J, Skee D, et al. Stable isotope?labelled intravenous microdose for absolute bioavailability and effect of grapefruit juice on ibrutinib in healthy adults. Br J Clin Pharmacol 2016;81(2):235-45.
[Crossref] [Google Scholar] [PubMed]
- Ponader S, Chen SS, Buggy JJ, Balakrishnan K, Gandhi V, Wierda WG, et al. The Bruton tyrosine kinase inhibitor PCI-32765 thwarts chronic lymphocytic leukemia cell survival and tissue homing in vitro and in vivo. Blood 2012;119(5):1182-9.
[Crossref] [Google Scholar] [PubMed]
- de Rooij MF, Kuil A, Geest CR, Eldering E, Chang BY, Buggy JJ, et al. The clinically active BTK inhibitor PCI-32765 targets B-cell receptor and chemokine-controlled adhesion and migration in chronic lymphocytic leukemia. Blood 2012;119(11):2590-4.
[Crossref] [Google Scholar] [PubMed]
- Pavlasova G, Borsky M, Seda V, Cerna K, Osickova J, Doubek M, et al. Ibrutinib inhibits CD20 upregulation on CLL B cells mediated by the CXCR4/SDF-1 axis. Blood 2016;128(12):1609-13.
[Crossref] [Google Scholar] [PubMed]
- Seda V, Mraz M. B?cell receptor signalling and its crosstalk with other pathways in normal and malignant cells. Eur J Haematol 2015;94(3):193-205.
[Crossref] [Google Scholar] [PubMed]
- Dong J, Li S, Liu G. In vitro metabolism of ibrutinib in rat, dog and human hepatocytes using liquid chromatography combined with diode?array detection and Q?Exactive Orbitrap tandem mass spectrometry. Rapid Commun Mass Spectrom 2019;33(23):1804-15.
- Xu RA, Wen J, Tang P, Wang C, Xie S, Zhang BW, et al. Functional characterization of 22 CYP 3A4 protein variants to metabolize ibrutinib in vitro. Basic Clin Pharmacol Toxicol 2018;122(4):383-7.
[Crossref] [Google Scholar] [PubMed]
- Mehta L, Naved T, Grover P, Bhardwaj M, Mukherjee D. LC and LC-MS/MS studies for identification and characterization of new degradation products of ibrutinib and elucidation of their degradation pathway. J Pharm Biomed Anal 2021;194:113768.
- Mehta L, Naved T, Grover P, Bhardwaj M, Mukherjee D. Development and validation of novel and highly sensitive stability-indicating reverse phase ultra-performance liquid chromatography method for quantification of ibrutinib and its ten degradation products. Indian J Pharm Sci 2020;82(6):958-66.
- Mehta L, Naved T, Grover P, Bhardwaj M, Mukherjee D, Vennapu DR. Identification and characterization of new degradation products of belinostat using UHPLC-Q-TOF-MS/MS and in silico toxicity prediction. J Liq Chromatogr Relat Technol 2021;44(5):285-97.
- Mehta L, Grover P, Naved T, Mukherjee D. Metabolite detection and profiling using analytical methods. Curr Pharm Anal 2021;17(1):2-9.
- Elbarbry F, Wilby K, Alcorn J. Validation of a HPLC method for the determination of p-nitrophenol hydroxylase activity in rat hepatic microsomes. J Chromatogr B Analyt Technol Biomed Life Sci 2006;834(1):199-203.
[Crossref] [Google Scholar] [PubMed]
- Zhang H, Gao N, Tian X, Liu T, Fang Y, Zhou J, et al. Content and activity of human liver microsomal protein and prediction of individual hepatic clearance in vivo. Sci Rep 2015;5(1):1-2.
- Jia L, Liu X. The conduct of drug metabolism studies considered good practice (II): In vitro experiments. Curr Drug Metab 2007;8(8):822-9.
[Crossref] [Google Scholar] [PubMed]
- Kumar S, Jana AK, Dhamija I, Singla Y, Maiti M. Preparation, characterization and targeted delivery of serratiopeptidase immobilized on amino-functionalized magnetic nanoparticles. Eur J Pharm Biopharm 2013;85(3):413-26.
[Crossref] [Google Scholar] [PubMed]
- Kumar S, Jana AK, Dhamija I, Maiti M. Chitosan-assisted immobilization of serratiopeptidase on magnetic nanoparticles, characterization and its target delivery. J Drug Target 2014;22(2):123-37.
[Crossref] [Google Scholar] [PubMed]
