- *Corresponding Author:
- W. Lin School of Sports and Health, Guangzhou Sport University, Guangzhou 510500, China E-mail: gtwtli@163.com
| This article was originally published in a special issue, “Trends in Therapeutic Management of Various Clinical Conditions II” |
| Indian J Pharm Sci 2021:83(2)Spl issue;179-183 |
This is an open access article distributed under the terms of the Creative Commons Attribution-NonCommercial-ShareAlike 3.0 License, which allows others to remix, tweak, and build upon the work non-commercially, as long as the author is credited and the new creations are licensed under the identical terms
Abstract
Resistin plays an important role in the body’s metabolic system and its devastation is associated with obesity. Thyroid hormones also play a role in regulating the body’s overall metabolism. So in this experimental study, we tried to investigate the relationship between the resistin gene expression and thyroid hormones in Wistar rat. For experiments, 24 Wistar rats, were used to develop obesity (obese group, n=8) or hypothyroidism (hypothyroid group, n=8); also 8 rats were used as control. To cause obesity in obese rats, they were kept for 60 d and fed with a high fat diet. Propylthiouracil was used to induce hypothyroidism. Resistin messenger ribonucleic acid expression was evaluated by real time polymerase chain reaction in all rats. Data were compared between the groups of study by statistical package for the social sciences. The results showed that the obese group had a significantly higher weight than the two hypothyroid and control groups (p<0.05). However, the hypothyroid group, despite having a higher average weight than the control group, did not have a statistically significant difference in weight with the control group (p=0.067). Examination of triiodothyronine and thyroxine hormones also showed that the hypothyroid group had significantly lower triiodothyronine and thyroxine than both control and obese groups (p<0.05). However, the two groups of obesity and control did not differ in terms of the level of these hormones (p>0.05). The results of the study of the relative expression of resistin gene in the three study groups did not show a significant difference (p>0.05). However, the control group had less expression than the two obese and hypothyroid groups. Separating animals to 2 groups of high resistin and low resistin expression revealed higher triiodothyronine and thyroxine in a group of animals expressing low resistin (p<0.05). There were so many controversies between studies and this disagreement could be because of serum resistin. The short half-life of resistin cannot be considered for the study of resistin and as well as the human studies should also assess its expression.
Keywords
Resistin, hypothyroidism, obesity, thyroid
Thyroid hormones play an important role in the metabolism of the body and defects in the function of the thyroid gland and the improper secretion of these hormones have many physiological consequences[1]. Decreased plasma concentrations of thyroid hormones may contribute to weight gain and loss of appetite and changes in body tissues as well as increased fat. Subcutaneous adipose tissue makes up 80 % of body fat[2]. Adipose tissue is the body’s most important source of energy storage, secreting specific proteins called cytokines and hormones to regulate physiological responses such as controlling energy exchange, inflammation and homeostasis[3]. Resistin is among the proteins secreted by adipose tissue. Resistin is a cysteine rich hormone that is mainly made in abdominal fat stores and resin crystalline structures show that it is a combination of several subunits that interact non covalently and ultimately form its structure[4]. Also, the length of resistin peptide in humans is 108 amino acids and in mice 114 amino acids. In general, only small amounts of resistin are expressed in humans in adipose tissue and more of its production sources are due to bone marrow, spleen, lung tissue and placenta. Resistin is also produced during the differentiation of macrophage monocytes[5]. This hormone is known to have a contribution against atherosclerosis and is an important factor in predicting cardiovascular disease and heart attack risk. Increased blood resistin levels are more likely to occur with systemic inflammation. Increased blood resistin or hyper cysteine state in the body, impairs glucose tolerance, increases insulin resistance in the liver and impairs insulin activity[6].
Because thyroid hormones are the most well-known regulators of the body’s overall metabolism as well as adipose tissue metabolism, resistin having similar roles may be associated with thyroid hormones. So, in this experimental study, we tried to investigate the relationship between the resistin gene expression and thyroid hormones in Wistar rat.
Materials and Methods
Study animals
For the experiments, 24 Wistar rats were used with a mean weight of 160 g. Animal storage conditions during the experiment were controlled by temperature, humidity, light, nutrition and other biological factors. The ambient temperature was 22±2? and its humidity was 30 % to 40 %. The amount of light applied each day and night with a period of 12 h of darkness and 12 h of light. The animals were randomly divided into three groups, one control group, one hypothyroidism groups and one obese group, each containing 8 rats. During this period (60 d), the animals in the control group received normal non medicated drinking water.
Induction of hypothyroidism
To induce hypothyroidism, animals were fed high dose treatment of 10 mg/100 ml of pure propylthiouracil powder for 10 d after dissolved in drinking water. The propylthiouracil was carefully weighed by a digital scale and after dissolving in ordinary drinking water they were poured into animal drinking bowls and given to the animals.
Induction of obesity
To cause obesity in the obese group, rats were kept for 60 d and fed a high fat diet. Standard mice and high fat foods were prepared for weight gain in mice (Table 1). Animal body weight was determined by the digital scale from the beginning to the end of the experiment.
| Percentage of compounds | Standard diet | High fat diet |
|---|---|---|
| Protein | 23 % | 17 % |
| Carbohydrate | 65 % | 43 % |
| Fat | 12 % | 40 % |
Table 1: Nutrient Composition of the Rats in the Obese Group
Then, rats on a high fat diet which reached weight more than 310 g were identified as obese mice based on Lee’s index[7]. Lee’s index was obtained from the following formula:
√Body weight/Body length×1000
This formula explains that the body weight in grams and the length of the body or height of the animal is equal to the distance from the nose to the anal area (in cm).
At the end of the 8th w, after anesthesia and blood sampling from the heart, the mice were killed and samples of visceral adipose tissue were collected. The tissues in the micro tube were washed with saline and transferred to a freezer -80? using a nitrogen tank. At the end of the treatment period, the animals were anesthetized by intramuscular injection (IM) of 100 mg of ketamine per kilogram of body weight (100 mg/kg, IM) with mild anesthesia and then the anesthetized animal was placed on the back on the operating table. The animal’s arms and legs were fixed. And after ensuring complete anesthesia by not observing the corneal reflex, the animal’s chest was opened and blood was drawn from the right atrium of their heart with clean and suitable syringes. Blood serum was irradiated by centrifugation and serum samples were kept in special doors and wings at -80? without damaging the connective tissue around the thyroid (capsule), it was gently removed from the tracheal cartilage. Then, using a digital scale, the weight of the gland was obtained and analyzed in statistical studies. Specimens of rat tissue were sent to the Genetics Laboratory by the Symbol Green method to check the messenger ribonucleic acid (mRNA) level of the resistin gene mRNA by the real time polymerase chain reaction (PCR) method, which is summarized in this way.
According to the instructions, the RNA extraction kit was used. 25 mg of adipose tissue was removed from the frozen microtubule and crushed with a razor (Ultratodox T25) and homogenized using a shaker mixer. The test steps were then performed according to the kit method to complete the extraction and preparation of pure RNA.
Random hexane was used as a primer to convert total RNA to complementary DNA (cDNA) due to the high length of the RNA sequence and after binding the primers to the RNA strand was performed with the help of reverse transcriptase enzyme from RNA. The Hypoxanthine phosphoribosyltransferase (HPRT) gene was used as the housekeeping gene to control and compare the expression of the target gene (resistin). The sequence of primers used included:
Resistin forward: 5TCATGCCCAGAACCGAGTTG3
Resistin reverse: 5CAGCCCCAGGACAAGGAAGA3
To make cDNA, according to the instructions mentioned on the US Thermo kit, it was used and finally real time PCR was performed by the cyber green method. The calculation of relative fold change in gene expression was performed in experimental groups using the method described previously[8].
Sample measurement and analysis
The amount of triiodothyronine (T3) and thyroxine (T4) hormones in the serum was determined by the radioimmunoassay method with the corresponding commercial kits.
Statistical methods
The research data were presented using descriptive statistics like a mean and standard error. Initially, the Kolmogorov- Smirnov test was used to evaluate the normal distribution of the data. Then, for the initial comparison between the weight data in the studied groups, one way analysis of variance test was used and then in case of the statistical difference between groups, the Toki test was used. In case of non-parametric data Kruskal-Wallis one way analysis was used. Independent t test was also used to compare the expression of resistin gene between the double groups and the significance level was considered to be less than 0.05. All statistical calculations were performed using version 19 of SPSS software. The charts were also drawn using Graphpad prism software.
Results and Discussion
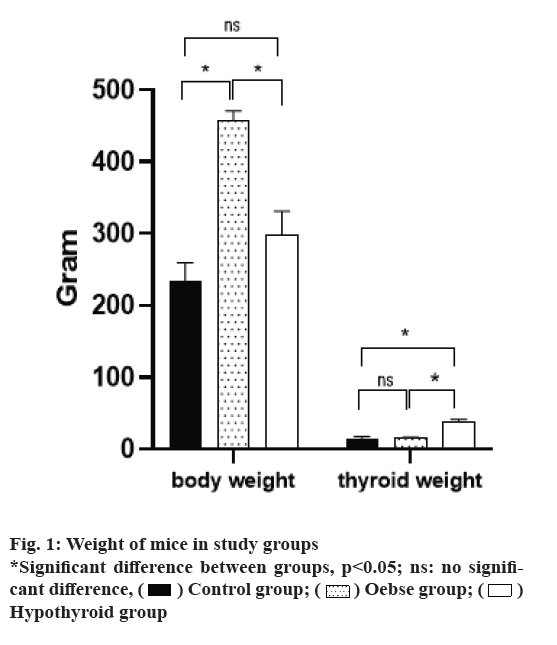
As shown in fig. 1, a study of weight measurement in three intervention groups found that the obese group with a mean weight of 345±12.8 g had a significantly higher weight than the two hypothyroid and control groups (p<0.05). However, the hypothyroid group, despite having a higher average weight than the control group, did not have a statistically significant difference with the control group (p=0.067). Hypothyroidism group had a significantly higher thyroid weight than the two hypothyroid and control groups (p<0.05). There was no difference between the obese and the control group in terms of thyroid weight (p=0.327).
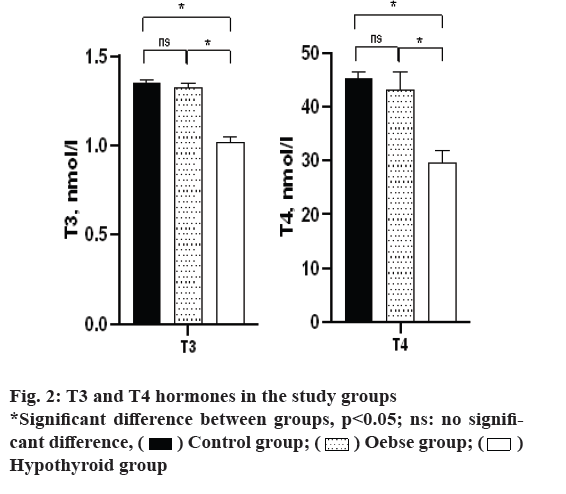
According to fig. 2, the study of T3 and T4 hormones also showed that the hypothyroid group had significantly lower T3 and T4 than both control and obese groups (p<0.05). However, the two groups of obesity and control did not differ in terms of the level of these hormones (p>0.05).
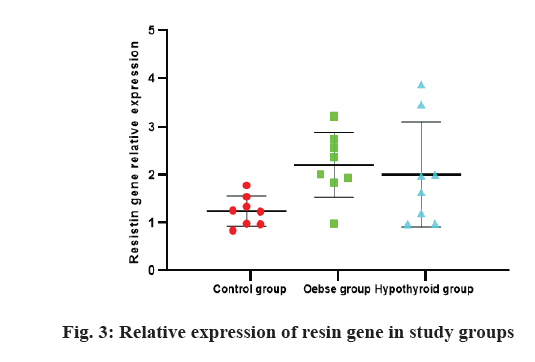
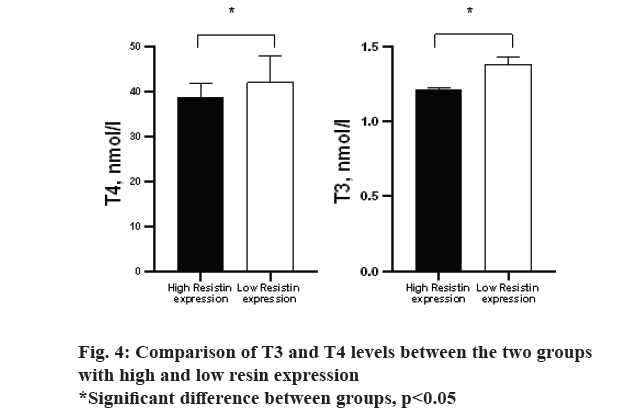
The results of the study of the relative expression of resistin gene in three study groups are shown in fig. 3. There was no significant difference in Kruskal-Wallis one way analysis between three study groups (p>0.05). However, the control group had less expression than the two obese and hypothyroid groups. Based on the area under the curve (AUC) calculated for the ratio of gene expression and whether or not the animals were obese (AUC=0.764, p=0.031), the cut off 1.44 was calculated. Based on this, the mice were divided into two groups: high resin expression and low resin expression. Based on this, a comparison of T3 and T4 levels between the two groups was performed and the results are shown in fig. 4. Accordingly, the group with high expression of resin had less T4 and T3 than the group with low expression of resistin (p=0.001, 0.027, respectively).
The function of the thyroid gland and adipose tissue are strongly linked together. Recently, the discovery of endocrine functions of adipose tissue has shown that adipose tissue has not only a storage function but also an active regulatory function in energy metabolism[9].
Changes in the number of thyroid hormones have been found to influence insulin release and responsiveness. The link between insulin tolerance and thyroid activity has been explored in both human and animal studies.
Resistin plays a significant function in the pathogenesis of obesity related insulin resistance and type 2 diabetes mellitus in animal models, but its exact position in humans remains unclear. Resistin has certain pro inflammatory cytokine properties and plays a significant function in inflammatory diseases independent of its function in insulin resistance. It was proposed that resistin modulates molecular pathways that sustain cross talk between inflammation and metabolic markers[10]. Thyroid hormone abnormalities and resistin interference have been studied in different diseases. Our results showed an inverse relationship between resistin gene and thyroid function[10].
In confirmation of our study, Botella-Carretero et al.[11] demonstrated an increase in resistin and thyroid stimulating hormone (TSH) in thyroid cancer patients during the withdrawal of thyroid hormones for iodine scan, but this increase was not different from the control group. Prescribing T4 and reducing thyrotropin levels was no longer significant to increase resistin with the control group, but in this study, thyroid follicular cancers were examined because of their higher prevalence.
While Krassas et al. could not demonstrate a relationship between resistin and thyroid hormone status[12]. High doses of T3 did not have any effect on resistin, whereas diminished leptin and adiponectin gene expression in calorie restricted obese rats occurred. A positive correlation between resistin, free T3 (fT3) and free T4 (fT4) had been documented by Yaturu et al.[13].
Bossowski et al. showed similar results in untreated Graves’ patients in whom resistin levels were higher compared to simple goiter and Hashimoto disease patients[14]. Nogueiras et al. observed resistin mRNA levels increased in adipose tissue in hypothyroid rats, whereas it decreased to almost undetectable levels in hyperthyroid rats[15].
In another study consisting of 53 hypothyroid patients and 30 controls, Krassas et al. also did not observe any difference between control and patient groups in terms of resistin. After 4-5 mo treatment, normalization of thyroid hormone levels did not result in a significant change in resistin levels[12]. Iglesias et al. observed similar resistin levels in pre-treatment and post treatment periods in hypothyroid patients, whereas those levels were significantly lower in hypothyroid patients than the euthyroid control group[16].
Feng and his colleagues strongly linked cancers like prostate, colorectal, breast and gastric cancers with resistin, but did not mention a link between adipokines and thyroid diseases[17]. Owecki and his colleagues point to a decrease in the amount of resistin in people with thyroid cancer after total thyroidectomy[18]. Nogueiras et al. showed in patients with hyperthyroidism, the level of resistin decreases[15].
There are so many contradictions between studies and this disagreement could be due to difference in study methods and study design as well as we have used animal models while other studies have evaluated resistin levels in human subjects. Also, we have evaluated its expression, not the amount of resistin in the serum. The reasons for the inconsistent results from various studies can be summarized as follows: Plasma serum cannot be considered for the study of resistin, because, firstly, plasma levels of resistin are derived from various tissues such as bone marrow, liver and muscle. The secondary nervous system helps to produce this hormone in the body and secondly, the plasma half-life of resistin is short, which could be a reason for the weak effects observed in the laboratory.
So far, various studies have evaluated the effect of thyroid function on plasma concentrations of adipocytes and the results show a change in serum levels of various adipokines in thyroid disease compared to normal thyroid function. While our results showed an inverse relationship between resistin gene and thyroid function.
Conflict of interests
The authors declared no conflicts of interest.
References
- Iwen KA, Schroder E, Brabant G. Thyroid hormones and the metabolic syndrome. Eur Thyroid J 2013;2(2):83-92.
- Keller U, Lustenberger M, Muller-Brand J, Gerber PP, Stauffacher W. Human ketone body production and utilization studied using tracer techniques: regulation by free fatty acids, insulin, catecholamines and thyroid hormones. Diabetes Metab Rev 1989;5(3):285-98.
- Garcia-Solis P, Garcia OP, Hernandez-Puga G, Sanchez-Tusie AA, Saenz-Luna CE, Hernandez-Montiel HL, et al. Thyroid hormones and obesity: a known but poorly understood relationship. Endokrynol Pol 2018;69(3):292-303.
- Steppan CM, Bailey ST, Bhat S, Brown EJ, Banerjee RR, Wright CM, et al. The hormone resistin links obesity to diabetes. Nature 2001;409:307-12.
- Bokarewa M, Nagaev I, Dahlberg L, Smith U, Tarkowski A. Resistin, an adipokine with potent proinflammatory properties. J Immunol 2005;174(9):5789-95.
- Banerjee RR, Rangwala SM, Shapiro JS, Rich AS, Rhoades B, Qi Y, et al. Regulation of fasted blood glucose by resistin. Science 2004;303:1195-8.
- Lee MO. Determination of the surface area of the white rat with its application to the expression of metabolic results. Am J Physiol 1929;89(1):24-33.
- Livak KJ, Schmittgen TD. Analysis of relative gene expression data using real-time quantitative PCR and the 2−ΔΔCT method. Methods 2001;25(4):402-8.
- McTernan PG, Kusminski CM, Kumar S. Resistin. Curr Opin Lipidol 2006;17(2):170-5.
- Steppan CM, Lazar MA. Resistin and obesity-associated insulin resistance. Trends Endocrinol Metab 2002;13(1):18-23.
- Botella-Carretero JI, Alvarez-Blasco F, Sancho J, Escobar-Morreale HF. Effects of thyroid hormones on serum levels of adipokines as studied in patients with differentiated thyroid carcinoma during thyroxine withdrawal. Thyroid 2006;16(4):397-402.
- Krassas GE, Pontikides N, Loustis K, Koliakos G, Constantinidis T, Kaltsas T. Resistin levels are normal in hypothyroidism and remain unchanged after attainment of euthyroidism: relationship with insulin levels and anthropometric parameters. J Endocrinol Invest 2006;29(7):606-12.
- Yaturu S, Prado S, Grimes SR. Changes in adipocyte hormones leptin, resistin and adiponectin in thyroid dysfunction. J Cell Biochem 2004;93(3):491-6.
- Bossowski A, Sawicka B, Szalecki M, Koput A, Wysocka J, Zelazowska-Rutkowska B. Analysis of serum adiponectin, resistin and leptin levels in children and adolescents with autoimmune thyroid disorders. J Pediatr Endocrinol Metab 2010;23(4):369-77.
- Nogueiras R, Gualillo O, Caminos JE, Casanueva FF, Dieguez C. Regulation of resistin by gonadal, thyroid hormone and nutritional status. Obes Res 2003;11(3):408-14.
- Iglesias P, Alvarez Fidalgo P, Codoceo R, Diez JJ. Serum concentrations of adipocytokines in patients with hyperthyroidism and hypothyroidism before and after control of thyroid function. Clin Endocrinol 2003;59(5):621-9.
- Feng Z, Zhang H. Resistin and cancer risk: a mini-review. Endocrinol Metab Syndr. 2011;4:003.
- Owecki M, Ryszard Wasko ZE, Nikisch E, Sowinski J. Circulating resistin levels are lower in hypothyroid women but independent from thyroid hormones concentrations. Neuroendocrinol Letters. 2008 Feb 1;29(1):131-6.

 Control group;
 Oebse group;
 Hypothyroid group


