- *Corresponding Author:
- M. Anudeep Reddy
Department of Veterinary Pharmacology and Toxicology, College of Veterinary Science, Hyderabad-500 030, India
E-mail: anudeepreddy07@gmail.com
| Date of Submission | 30 June 2016 |
| Date of Revision | 05 November 2016 |
| Date of Acceptance | 05 January 2017 |
| Indian J Pharm Sci 2017;79(1): 58-64 |
This is an open access article distributed under the terms of the Creative Commons Attribution-NonCommercial-ShareAlike 3.0 License, which allows others to remix, tweak, and build upon the work non-commercially, as long as the author is credited and the new creations are licensed under the identical terms
Abstract
An experimental study was conducted to evaluate the hepatoprotective effect of aqueous extract of Camellia sinensis or green tea extract and N-acetyl-L-cysteine in acetaminophen-induced hepatotoxicity in rats. Male Wistar rats (n=24) of 3 mon age were equally divided into 4 groups. Group 1 served as normal control. Hepatotoxicity was induced in the remaining three groups with oral administration of 500 mg/kg of acetaminophen from day 1 to day 3. Groups 2, 3 and 4 were subsequently administered orally with distilled water, 300 mg/kg of N-acetyl-L-cysteine and 100 mg/kg green tea extract, respectively for 11 days. Mean body weights and biomarkers of hepatotoxicity were estimated on days 0, 4 (confirmation of toxicity) 15 (at the end of treatment). Hematological parameters were evaluated on 4 and 15 d. Antioxidant profile and ATPase enzymes were assessed at the end of the experiment. Livers were subjected to histopathology and transmission electron microscopy after the sacrifice on day 15. Antioxidant profile, ATPase, hematological and serobiochemical parameters were significantly altered and histopathological changes were noticed in liver of toxic control group. These changes were reversed in groups 3 and 4 that were administered with N-acetyl-L-cysteine and green tea extract, respectively. The results of the present investigation enunciated that green tea extract has potent hepatoprotective activity, though N-acetyl-L-cysteine was found superior in restoring the pathological alterations in acetaminophen-induced hepatotoxicity in Wistar rats.
Keywords
Acetaminophen, Camellia sinensis, catechins, green tea, hepatotoxicity, N-acetyl-L-cysteine, rats
The liver is one of the vital organs of the body and plays a key role in the metabolism and detoxification process; disorders of this organ remain some of the most serious health problems [1]. Drug-induced hepatic injury is considered as the primary cause of hepatotoxicity [2]. Acetaminophen (paracetamol, N-acetyl-p-aminophenol) via CYP450-mediated N-hydroxylation metabolized to N-acetyl-pbenzoquinoneimine (NAPQI) [3]. N-acetyl-pbenzoquinoneimine (NAPQI), a highly toxic, reactive metabolite of acetaminophen, which causes oxidative stress and glutathione (GSH) depletion plays a key role in dose-dependent hepatotoxicity [4]. N-acetyl- L-cysteine (NAC) is a sulfur-based amino acid and potent antioxidant proved effective as an antidote for hepatotoxicity due to acetaminophen overdose [5]. NAC acts as a precursor for GSH synthesis and was shown to be beneficial against reactive oxygen species (ROS) generation, mitochondrial dysfunctions and in mitochondrial dependent and independent apoptotic cell death in cancer [6].
Herbal alternatives are one of the best ways to minimize liver damage and were used prophylactically, also as antidotes [7]. Green tea is an important dietary source of the plant polyphenols from Camellia sinensis [8]. The phenol rings in the compound are comprised of phenyl and hydroxyl group structures that possess antiinflammatory, immunomodulatory and antioxidant properties [9]. Singarvel et al. [10] reported that the hepatoprotective effect of C. sinensis in CCl4-treated rats owing to its antioxidant property. Hence, an experimental study was conducted to assess the hepatoprotective effect of C. sinensis (green tea) against acetaminopheninduced hepatotoxicity in male Wistar rats.
Materials and Methods
Acetaminophen and NAC were purchased from Himedia, Mumbai and Sisco Research Laboratories Pvt. Ltd., Mumbai, respectively. Green tea (Lipton) was procured from the local supermarket and green tea extract (GTE) was prepared by brewing in hot water. Male Wistar rats (n=24) of 3 mon age were procured from Sanzyme Pvt. Ltd., Hyderabad, India. The experimental protocol was approved by the Institutional Animal Ethics Committee (IAEC, Approval No. CPCSEA I/10/2014, Dated: 27.11.2014). All animals were maintained under standard conditions prescribed by CPCSEA.
Experimental design
The experimental study was carried out on 24 rats that were randomly divided into four groups comprising of 6 rats in each group. Group 1 served as normal control. Group 2 animals were administered acetaminophen (500 mg/kg p.o) once daily for the first 3 d and distilled water (5 ml/kg p.o) once daily for the next 11 d after the last dose of acetaminophen. Group 3 animals received acetaminophen as in group 2 followed by NAC (300 mg/kg p.o) once daily for the next 11 d. Group 4 rats received acetaminophen as in group 2 followed by GTE (100 mg/kg p.o) once daily for the next 11 d. Following a 24 h fasting with access to water ad libitum, hepatotoxicity was induced in groups 2, 3 and 4 with 500 mg/kg of acetaminophen per oral administration for 3 consecutive days [11].
Mean body weights of the groups were estimated on days 0, 4 (confirmation of toxicity) and 15 (at the end of treatment). Haematological parameters such as total erythrocyte count, total leukocyte count, haemoglobin, and packed cell volume and prothrombin time were estimated in all the groups on days 4 and 15. On the day 15, blood samples were collected centrifuged; sera were separated and stored at −80° until assayed for alanine transaminase, bilirubin, total protein and glucose. At the end of the experiment, liver tissues were collected for the assay of reduced GSH, glutathione peroxidase (GPX), super oxide dismutase (SOD), catalase (CAT) and thiobarbituric acid reacting substance (TBARS). The liver tissue was collected in ice cold conditions for determining ATPase activity. Histopathological and transmission electron microscopic studies of liver tissues were performed to draw possible conclusions at the end of the experiment.
Tissue samples were homogenized in 1 ml of 10 mM Tris HCl buffer of pH 7.1 and centrifuged at 12 000 g for 10 min. The supernatant was used for the measurement of liver enzymatic and non-enzymatic antioxidants. SOD was estimated by the procedure involving inhibition of superoxide-dependent reduction of tetrazolium dye MTT to formazan [12]. CAT is allowed to split H2O2 followed by adding dichromate/acetic acid mixture to stop the reaction, resultant chromic acid measured gives the amount of freely available H2O2 [13]. Quantitative estimation of GSH was done by the method where reduced GSH was reacted with 5-5’ dithiobis-2-nitrobenzoic acid (DTNB) and absorbance was measured at 412 nm [14]. The activity of GPx [15] and TBARS [16] was estimated as prescribed by the previous studies.
Na+-K+ATPase and Mg2+ATPase estimation [17]
Na+-K+ATPase and Mg2+ATPase transports Na+, K+ and Mg2+, respectively against concentration gradient at the cost of ATP molecule liberating inorganic phosphate (Pi). The liberated Pi was estimated as per the micro method determination of Pi reported Chen et al. [18]. Ouabain, a Na+-K+ATPase inhibitor, was used to assess the Mg2+ATPase in the sample. Na+-K+ATPase was determined by difference in the presence and absence of ouabain.
Reaction mixture comprising of 1 M NaCl-1.40 ml, 1 M KCl-140 μl, 0.1 M MgCl2-300 μl, 0.2 M EDTA-10 μl, 0.5 M tris-HCl pH 7.4-400 μl and distilled water 2.75 ml was prepared and stored in a refrigerator. Half milliliter of the above mixture was taken and made to a final volume of 1.0 ml. ATP 30 mM was prepared by dissolving 181.8 mg of disodium ATP in 6 ml of distilled water, pH was adjusted to 7.4 with 0.5 M Tris base, final volume was made up to 10 ml with distilled water and stored in frozen condition. Ouabain (10 mM) solution was prepared by dissolving 14.57 mg of ouabain in 2 ml of distilled water, which was kept frozen in an amber coloured bottle. Trichloroacetic acid (TCA) 10% was prepared and used.
Enzyme preparation and ATP solution were thawed and kept on ice. Liver microsomes were diluted to 3 mg protein/ml. The following solutions were added serially. The reaction was terminated exactly after 30 min of incubation by adding 1 ml of 10% TCA and tubes were immediately transferred to ice, kept for 10 min and centrifuged for 5 min to remove the precipitate. Whole supernatant was taken for phosphate estimation using the micro method reported by Chen et al. [18]. Five hundred microlitres of the supernatant and 3.5 ml of distilled water were taken in a test tube and 4 ml of the reagent containing 1 volume of 10% ascorbic acid, 1 volume of 2.5% ammonium molybdate and 2 volumes of distilled water, was added. All tubes were incubated at 37° for 2 h. The absorbance was read at 820 nm. The enzyme activity was expressed as μg of Pi liberated/mg microsomal protein/30 min.
Hepatic alanine transaminase, total bilirubin, glucose and total protein concentration in serum were estimated as per the instructions given in the Erba diagnostic kit using Erba Chem 7 autoanalyser. At the end of the study, all the animals were sacrificed; liver samples were collected and fixed in 10% neutral buffered formalin. Subsequently, the fixed samples were processed and stained with haematoxylin and eosin (H and E) stain as described by Singh and Sulochana [19]. For microscopic studies, samples were transferred to vials and fixed in 3% glutaraldehyde, stained with saturated aqueous uranyl acetate and counter stained with 4% lead citrate [20] and were observed at different magnifications under transmission electron microscope (Model: Hitachi, H-7500) at Ruska Laboratory, PVNR TVU, College of Veterinary Science, Hyderabad, India.
Statistical analysis
The experimental data were expressed as mean±standard error of mean. Using one way analysis of variance (ANOVA) followed by Duncan’s [21] post hoc analysis. All groups are compared and tested for significance with the help of Statistical Package for Social Sciences (SPSS 21.0). Values were considered significant if (P<0.05).
Results and Discussion
Significant (P<0.05) reduction of mean body weights (Table 1) in acetaminophen control group could mainly attributed to oxidative stress and ROS generated in acetaminophen-induced hepatotoxicity and altered metabolism of liver [22]. Weight reduction might also be attributed to hyperglycaemia induced in this study, which adds to the catabolism of proteins, resulting in weight loss. Weight gain observed in the animals treated with NAC and GTE (groups 3 and 4, respectively) might be due to restoration of antioxidant defences and recovery of hepatic histoarchitecture as evident from the findings of this study.
| Group | Control | APAP control | APAP+NAC | APAP+GTE |
|---|---|---|---|---|
| Day 0 | 173.16±1.04a | 172.83±0.94a | 173.50±0.99a | 173.33±0.88a |
| Day 4 | 194.16±4.32a | 179.33±2.04b | 193.33±1.02a | 193.5±0.88a |
| Day 15 | 239.5±2.18a | 192.83±1.13d | 233.66±2.41b | 226.33±1.85c |
APAP is acetaminophen, NAC is N-acetyl-L-cysteine and GTE is green tea extract. Values are expressed mean±standard error (n=6); One way ANOVA (SPSS). Means with different alphabets as superscripts differ significantly (P<0.05) among the groups at respective time intervals.
Table 1: Mean Body Weights (G) of Different Groups of Rats
The levels of serum markers like ALT, total bilirubin and glucose presented in Table 2 were significantly (P<0.05) increased and total proteins was significantly (P<0.05) decreased in this study could be due to loss of functional integrity of cell membrane in liver. This is in agreement with findings of Madhu Kiran et al. [23]. Treatment with NAC and GTE significantly (P<0.05) decreased the activity of above marker enzyme on 15 d, suggesting their protective effect in this study. These observations supports that the reversal of serum transaminases levels to normal may be due to regeneration of hepatocyte and healing of hepatic parenchyma [24].
| Parameter | Control | APAP control | APAP+NAC | APAP+GTE | |
|---|---|---|---|---|---|
| Total protein Concentration (g/dl) |
Day 4 | 7.57±0.07a | 4.56±0.06b | 4.67±0.02b | 4.66±0.02b |
| Day 15 | 7.56±0.08a | 4.59±0.05a | 6.23±0.12b | 5.56±0.03c | |
| Total bilirubin Concentration (mg/dl) |
Day 4 | 0.7±0.01c | 1.42±0.01a | 1.41±0.0ab | 1.38±0.01b |
| Day 15 | 0.81±0.03c | 1.39±0.01a | 0.79±0.01c | 0.9±0.01b | |
| Glucose Concentration (g/dl) |
Day 4 | 80.85±0.19c | 98.87±0.24a | 97.86±0.46b | 98.48±0.30ab |
| Day 15 | 82.24±0.44c | 96.26±0.25a | 82.91±0.33c | 88.67±0.37b | |
| ALT activity (IU/l) | Day 4 | 38.86±0.33c | 90.96±1.18a | 88.03±0.46b | 88.16±0.32b |
| Day 15 | 37.36±0.43d | 37.36±0.43a | 66.40±0.74c | 76.31±0.97b |
APAP is acetaminophen, NAC is N-acetyl-L-cysteine and GTE is green tea extract. Values are mean±standard error (n=6); One way ANOVA (SPSS). Means with different alphabets as superscripts differ significantly (P<0.05) among the groups at respective time intervals.
Table 2: Liver Functional Biomarkers in Different Groups of Rats
The reduced GSH level of liver tissue were significantly (P<0.05) increased in groups treated with NAC and GTE when compared to toxic group. However NAC surpassed GTE, which might be due to the ability of NAC to generate GSH and maintain GSH homeostasis in the body [24]. TBARS levels was significantly (P<0.05) increased in acetaminophen-treated control group signified that acetaminophen triggered massive lipid peroxidation [25,26], which was responsible for liver injury. GTE showed free radical scavenging ability that was comparable to NAC. SOD and CAT activities were significantly (P<0.05) increased in NAC and GTE treated groups as compared to toxic group 2 and also there was corresponding decrease in TBARS (extend of lipid peroxidation) in liver of treated groups 3 and 4 (Table 3).
| Parameter | Control | APAP control | APAP+NAC | APAP+GTE |
|---|---|---|---|---|
| TBARS concentration (n moles of MDA released/mg protein) |
14.36±0.1c | 17.64±0.09a | 14.41±0.12c | 15.80±0.11b |
| GSH concentration (n moles/mg protein) |
6.53±0.08a | 1.47±0.01d | 4.08±0.01b | 3.94±0.02c |
| GPX activity (U/mg protein) |
6.53±0.08a | 1.47±0.01d | 4.08±0.01b | 3.94±0.02c |
| SOD activity (U/mg protein) |
8.46±0.07a | 6.67±0.01d | 7.45±0.06c | 7.85±0.03b |
| Catalase activity (U/mg protein) | 4.94±0.01a | 3.18±0.01d | 4.64±0.02b | 4.19±0.01c |
APAP is acetaminophen, NAC is N-acetyl-L-cysteine and GTE is green tea extract. Values are mean±standard error (n=6); One way ANOVA (SPSS). Means with different alphabets as superscripts differ significantly (P<0.05) among the groups.
Table 3: Antioxidant and Peroxidation Parameters of Liver in Different Groups of Rats
The activities of Na+/K+ATPase and Mg2+ATPase in liver presented in Table 4 were significantly (P<0.05) increased in treatment groups might be due to the membrane stabilizing activity of NAC and GTE extract owing to their antioxidant potential. This may be attributed to the changes in the levels of total cholesterol and triglycerides as the activity of ATPase enzymes is more likely to be changed with the change in the level of these lipids [27].
| Parameter | Control | APAP control | APAP+NAC | APAP+GTE |
|---|---|---|---|---|
| Mg+2ATPase activity (µg of pi liberated/mg microsomal protein/30 min) |
4.48±0.01a | 2.75±0.01d | 3.94±0.01b | 3.72±0.01c |
| Na+-K+ATPase activity (µg of pi liberated/mg microsomal protein/30 min) |
10.32±0.14a | 5.84±0.07b | 10.02±0.22a | 9.89±0.02a |
APAP is acetaminophen, NAC is N-acetyl-L-cysteine and GTE is green tea extract. Values are mean±standard error (n=6); One way ANOVA (SPSS). Means with different alphabets as superscripts differ significantly (P<0.05) among the groups.
Table 4: ATPase Activity of Liver in Different Groups of Rats
Acute acetaminophen treatment in group 2 significantly (P<0.05) lowered TEC, Hb and PCV levels as compared to all other groups at respective time intervals from day 4-15. It might be due to acetaminophen-treated hepatic damage [28]. Further, significant (P<0.05) rise in TLC in acetaminophen-treated control group could possibly be due to the stimulation of immune system against the invading antigens and also to an IL-1β-mediated rise in the respective colony stimulating factors [29]. Treatment with NAC and GTE reversed these alterations in haematological parameters, which could be attributed to the protective effects on tissue repair and deceleration of disease progression.
In the present study, acetaminophen-induced prothrombin time prolongation seen in the group 2 controls might as well be attributed to hepatic injury resulting in a reduction in the production and activation of certain blood clotting factors as the metabolic machinery could have been compromised in the liver [30]. The treatment improved the clotting time owing to the regeneration of hepatic histoarchitecture and its physiology (Table 5).
| Parameter | Control | APAP control | APAP+NAC | APAP+GTE | |
|---|---|---|---|---|---|
| Total erythrocyte count (×106/mm) | Day 4 | 7.25±0.03a | 6.33±0.02c | 6.47±0.01b | 6.43±0.03b |
| Day 15 | 7.46±0.05a | 6.28±0.03c | 7.38±0.01a | 6.88±0.03b | |
| Total leukocyte count (103/mm3) | Day 4 | 7.86±0.01d | 9.64±0.01a | 9.24±0.01c | 9.58±0.02b |
| Day 15 | 7.94±0.01b | 9.69±0.01a | 7.89±0.01c | 7.960.01b | |
| Haemoglobin concentration (g/dl) |
Day 4 | 14.80±0.02a | 10.49±0.01b | 10.52±0.06b | 10.59±0.04b |
| Day 15 | 14.66±0.04a | 9.64±0.05d | 14.32±0.01b | 12.69±0.02c | |
| Packed Cell Volume (%) |
Day 4 | 37.46±0.01a | 33.48±0.15b | 33.56±0.03b | 33.41±0.07b |
| Day 15 | 37.43±0.01a | 28.27±0.16d | 36.72±0.03b | 35.88±0.02c | |
|
Prothrombin time (s) |
Day 4 | 15.23±0.02b | 27.42±0.04a | 27.37±0.04a | 27.36±0.06a |
| Day 15 | 15.24±0.02d | 29.84±0.02a | 16.25±0.02c | 19.55±0.06b |
APAP is acetaminophen, NAC is N-acetyl-L-cysteine and GTE is green tea extract. Values are mean±standard error (n=6); One way ANOVA (SPSS). Means with different alphabets as superscripts differ significantly (P<0.05) among the groups at respective time intervals.
Table 5: Hematological Parameters of Different Group of Rats
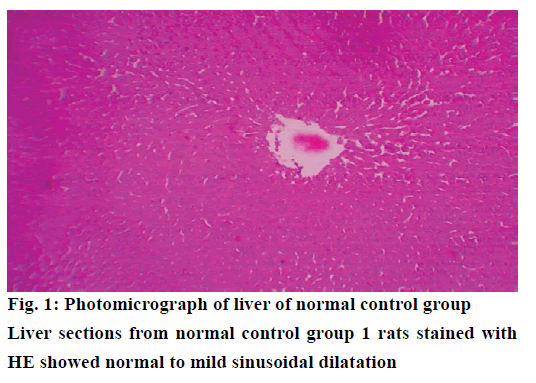
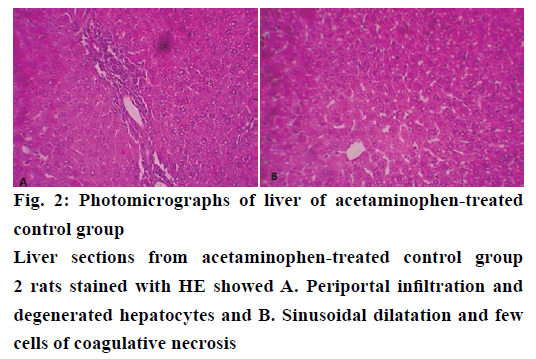
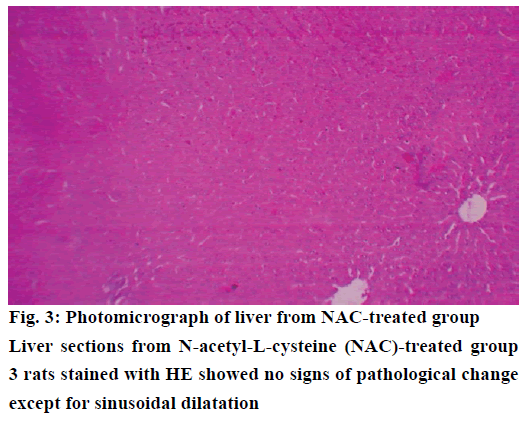
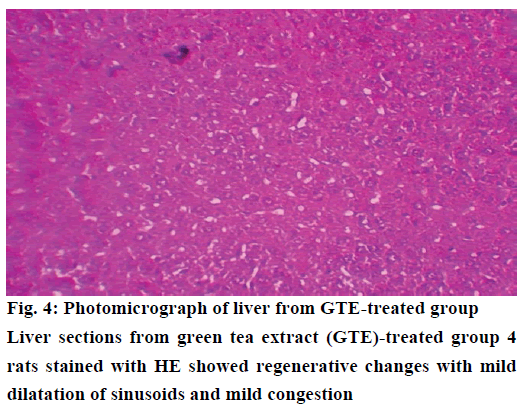
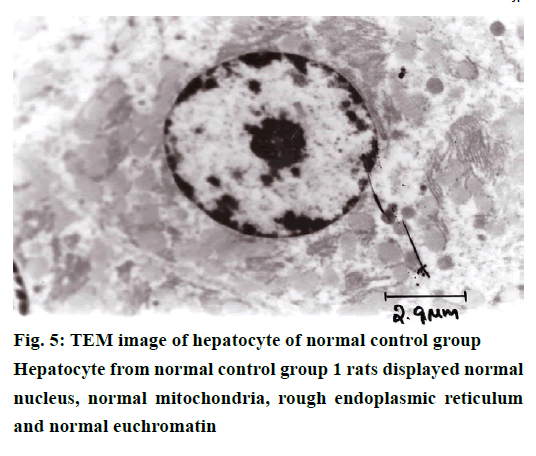
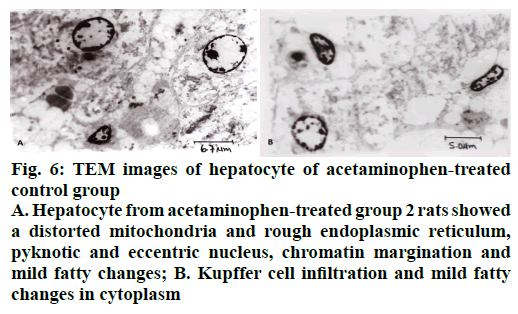
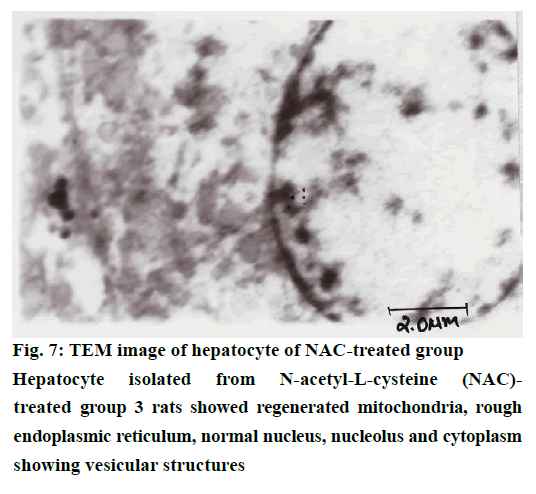
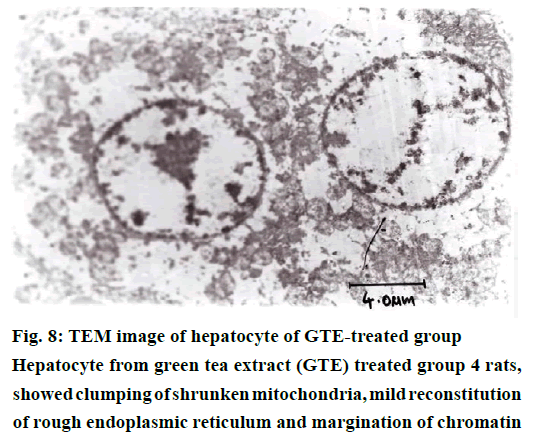
The histological examination of liver sections from acetaminophen-treated control (group 2) revealed periportal infiltration, moderate to severe necrotic degeneration and fatty changes when compared to normal control group 1 (Figures 1, 2A and 2B). NACtreated group 3 showed regenerative changes and GTE-treated group 4, revealed mild congestion and moderate degenerative changes as shown in Figures 3 and 4. Quantitative measures of liver histological alterations were presented in Table 6. TEM image of hepatocyte of normal control group 1 (Figure 5) showed normal nucleus, normal mitochondria, rough endoplasmic reticulum and normal euchromatin. TEM image of hepatocyte of acetaminophen-treated group 2 (Figure 6A and B) revealed Kupffer cell infiltration and mild fatty changes in cytoplasm. NAC-treated group 3 (Figure 7) showed hepatocyte with regenerated mitochondria, rough endoplasmic reticulum, normal nucleus and nucleolus. Similarly, TEM of hepatocyte of GTE-treated group 4 (Figure 8) showed reconstitution of mitochondria and mild margination of chromatin material.
| Groups | Sinusoidal dilatation | Cellular infiltration | Degenerative changes | Necrosis |
|---|---|---|---|---|
| Control | + | - | - | - |
| PCM control | +++ | +++ | ++++ | ++++ |
| PCM+NAC | + | + | ++ | ++ |
| PCM+GTE | ++ | ++ | +++ | +++ |
Table 6: Quantitative Measures of Liver Histological Alterations
Figure 6: TEM images of hepatocyte of acetaminophen-treated
control group
A. Hepatocyte from acetaminophen-treated group 2 rats showed a distorted mitochondria and rough endoplasmic reticulum, pyknotic and eccentric nucleus, chromatin margination and mild fatty changes; B. Kupffer cell infiltration and mild fatty changes in cytoplasm
The present study revealed that NAC and GTE extract protected against acetaminophen-induced hepatotoxicity probably due to inhibiting inflammatory and oxidative biomarkers. The overall beneficial effects of GTE are attributed to antioxidant potential as evident from oxidant-antioxidant markers in this study coupled with hepatoprotective property.
Acknowledgements
The authors thank the Associate Dean, College of Veterinary Science, PVNR TVU, Rajendranagar, Hyderabad for providing the necessary financial and infrastructure facilities for this study.
Conflict of interest
There are no conflicts of interest.
Financial support and sponsorship
Nil.
References
- Samuel AJ, Mohan S, Chellappan DK, Kalusalingam A, Ariamuthu S. Hibiscus vitifolius (Linn.) root extracts shows potent protective action against antitubercular drug induced hepatotoxicity. J Ethnopharmacol 2012;141:396-02.
- Lee HS, Won NH, Kim KH, Lee H, Jun W, Lee KW. Antioxidant effects of aqueous extract of Terminalia chebula In vivo and In vitro. Bio Pharm Bull 2005;28:1639-44.
- Brunton LL, Chabner BA, Knollmann BC. Goodman and Gilman’s The Pharmacological Basis of Therapeutics. 12th ed. New York: McGraw Hill Professional; 2011.
- Shah VN, Deval K. Hepatoprotective activity of leaves of Parkinsonia aculeata Linn against paracetamol induced hepatotoxicity in rats. Int J Pharm 2011;1:59-66.
- Lauterburg BH, Corcoran GB, Mitchell, JR. Mechanism of action of N-acetyl cysteine in the protection against the hepatotoxicity of acetaminophen in rats in vivo. J Clin Invest 1983;71:980-91.
- Malik F, Kumar A, Bhushan S, Khan S, Bhatia A, Suri KA, et al. Reactive oxygen species generation and mitochondrial dysfunction in the apoptotic cell death of human myeloid leukemia HL-60 cells by a dietary compound withaferin A with concomitant protection by N-acetyl cysteine. Apoptosis 2007;1:2115-33.
- Gopi KS, Reddy AG, Jyothi K, Kumar BA. Acetaminophen-induced hepato and nephrotoxicity and amelioration by silymarin and Terminalia chebula in Rats. Toxicol Int 2010;17:64-6.
- Chan EWC, Soh EY, Tie PP, Law YP. Antioxidant and antibacterial properties of green, black, and herbal teas of Camellia sinensis. Pharmacognosy Res2011;3:266-72.
- Del Rio D, Costa LG, Lean MEJ, Crozier A. Polyphenols and health: what compounds are involved? Nutr Metab Cardiovas 2010;20:1-6.
- Singaravel S, Srinivasan D, Nandhakumar J, Rasilingam D, Mani V. Hepatoprotective activity of Camellia sinensis and its possible mechanism of action. Iranian J Pharmacol Ther 2008;7:9-14.
- Sreedevi CD, Latha PG, Ancy P, Suja SR, Shyamal S, Shine VJ, et al. Hepatoprotective studies on Sida acuta Burm. f. J Ethnopharmacol 2009;12:171-15.
- Madesh M, Balasubramanian KA. Micro titer plate assay for superoxide dismutase using MTT reduction by superoxide. Indian J Biochem Bio 1998;35:184-8.
- Asru KS. Colorimetric assay of catalase.Anal Biochem 1972;47:389-94.
- Moron MS, Depierre JW, Mannervik B. Levels of glutathione, glutathione reductase and glutathione S transferase in rat lung and liver. Biochim Biophys Acta 1979;582:67-8.
- Paglia DE, Valentine WN. Studies on the quantitative and qualitative characterization of erythrocyte glutathione peroxidase.J Lab Clin Med 1967;70:158-69.
- Balasubramanian KA, Manohar M, Mathan VI. An unidentified inhibitor of lipid peroxidation in intestinal mucosa. Biochim Biophys Acta 1988;96:51-8.
- Nakao K, Kurashina S, Nakao M. Adenosine triphosphatase activity of erythrocyte membrane in hereditary spheocytosis. Life Sci 1967:6:595-600.
- Chen PS, Tosibara TV, Warner H. Micro determinations of phosphorus. Anal Biochem 1956:28:1756-9.
- Singh UB, Sulochana S. Handbook of Histopathological and Histochemical Techniques. 2nd ed. Hyderabad: Premier Publishing House; 1997.
- Bozzola JJ, Russell LD. Electron Microscopy: Principles and Techniques for Biologists. 2nd ed. Boston (USA): Jones and Bartlett; 1999.
- Duncan DB. Multiple ‘F’ test. Biometrics 1955;1:142.
- Canayakin D, Bayir Y, Kilic-Baygutalp N, Sezen Karaoglan E, Atmaca HT, Kocak-Ozgeris FB. et al. Paracetamol-induced nephrotoxicity and oxidative stress in rats: the protective role of Nigella sativa. Pharm Biol 2016;54:2018-91.
- Madhu Kiran P, Vijay Raju A, Ganga Rao B. Investigation of hepatoprotective activity of Cyathea gigantea (Wall. ex. Hook) leaves against paracetamol-induced hepatotoxicity in rats. Asian Pac J Trop Biomed 2012;2:352-6.
- Saito C, Zwingmann C, Jaeschke H. Novel mechanisms of protection against acetaminophen hepatotoxicity in mice by glutathione and N-acetyl cysteine. Hepatology 2010;51:246-54.
- Wendell A, Feuerstein S, Konz KH. Acute paracetamol intoxication of starved mice leads to lipid peroxidation in vivo. Biochem Pharmacol 1979;28:2051-5.
- Hinson JA, Roberts DW, James LP. Mechanisms of acetaminophen-induced liver necrosis. Hand Exp Pharmacol 2010;19:369-405.
- Upasani CD, Balaraman R. Effect of vitamin E, vitamin C and Spirulina on the levels of membrane bound enzymes and lipids in some organs of rats exposed to lead. Indian J Pharmacol 2001;33:185-91.
- Senthilkumar R, Chandran R, Parimelazhagan T. Hepatoprotective effect of Rhodiola imbricata rhizome against paracetamol-induced liver toxicity in rats. Saudi J Biol Sci 2014;21:409-16.
- Antoniades CG, Quaglia A, Taams LS, Mitry RR, Hussain M, Abeles R, et al. Source and characterization of hepatic macrophages in acetaminophen-induced acute liver failure in humans. Hepatology 2012;56:735-46.
- Dixon MF, Nimmo J, Prescott LF. Experimental paracetamol-induced hepatic necrosis: a histopathological study. J Pathol 1971;103:225-9.
