- *Corresponding Author:
- Juti Rani Devi
Department of Pharmaceutics, Netes Institute of Pharmaceutical Science, Mirza, Guwahati, Assam 781025, India
E-mail: jutiranidevi@gmail.com
| Date of Received | 07 December 2022 |
| Date of Revision | 03 June 2023 |
| Date of Acceptance | 25 March 2024 |
| Indian J Pharm Sci 2024;86(2):692-702 |
This is an open access article distributed under the terms of the Creative Commons Attribution-NonCommercial-ShareAlike 3.0 License, which allows others to remix, tweak, and build upon the work non-commercially, as long as the author is credited and the new creations are licensed under the identical terms
Abstract
Tramadol hydrochloride is an opiate analgesic used to treat mild to moderate pain. The present study aimed to optimize and evaluate the formulation of tramadol hydrochloride as a sustained release tablet using a hydrophilic and a hydrophobic polymer, i.e., hydroxypropyl methylcellulose K100M and glyceryl behenate, respectively. A central composite experimental design with 2 factors at 3 levels each was used to evaluate the effects of the critical variables, i.e., concentration of hydroxypropyl methylcellulose K100M and glyceryl behenate, on the drug release properties of the formulated tablets. The responses (dependent variables) studied for this investigation were release after 12 h (T12), time to 100 % release (T100) and R2 of Higuchi equation. Response surface analysis clearly showed the positive effect of the polymers on T12, T100 and R2. The tablets were evaluated for thickness, weight variation test, drug content, hardness, friability and in vitro release. All tablet formulations exhibited acceptable pharmacotechnical properties and met in-house specifications for the tested parameters. The optimized formulation showed drug release of >12 h. The statistically optimized formulation showed acceptable stability performed according to the guidelines of international council for harmonisation. The result of the study suggests that the mixed matrix of hydroxypropyl methylcellulose and glyceryl behenate can be used as a release retarder for the formulation of Tramadol hydrochloride, a drug with good water solubility.
Keywords
Sustained release, tramadol, glyceryl behenate, hydroxypropyl methylcellulose K100M, optimization, response surface methodology
Sustained release dosage forms are commonly taken only once or twice daily, compared with conventional forms that may have to take three or four times daily to achieve the same therapeutic effect[1]. The primary objectives of sustained drug delivery are to ensure safety and enhancement of efficacy of drug with improved patient compliance. Sustained release delivery system is increasingly being used in the treatment of acute and chronic diseases as they maintain the concentration of drug in plasma above the minimum effective concentration and below the minimum toxic level for an extended period of time. Thus it provides optimum drug therapy with reduced frequency of dosing and side effects [2-4].
To develop a sustained release dosage form it is important to design an optimized formulation with minimum number of trials. For this a computer optimization technique, based on Response Surface Methodology (RSM) utilizing a polynomial equation has been widely used. When a few significant factors are involved in optimization then this method is used. 32 full factorial designs, central composite design, Box-Behnken design are various types of RSM designs. This technique is more effective and cost-effective than the conventional methods of formulating sustained release dosage forms as it requires less experimentation and time[5-8].
Tramadol, a synthetic opioid of the aminocyclohexanol group, is a centrally acting analgesic with weak opioid agonist properties, and effects on noradrenergic and serotonergic neurotransmission[9]. Sustained-release tablets reach to peak concentrations after 4.9 h and have a bioavailability of 87 %-95 % compared with capsules. The mean elimination half-life is ~6 h and requires dosing every 6 h in order to maintain optimal relief of chronic pain. The half-life of a drug is about 5.5 h and the usual oral dosage regimen is 50-100 mg every 4-6 h with a maximum dosage of 400 mg/ day. To reduce the frequency of administration and to improve patient compliance, a sustained release formulation of tramadol is developed[10].
The drug is freely soluble in water. So to obtain a desirable sustain release formulation proper selection of the release retardant is necessary. Hydrophilic polymer matrix systems are widely used in oral controlled drug delivery because of their flexibility to obtain a desirable drug release profile, costeffectiveness, and broad regulatory acceptance. But for highly water-soluble drugs, hydrophilic matrix system is restricted due to rapid diffusion of the dissolved drug through the hydrophilic gel network. For such case, hydrophobic polymers mainly waxes are suitable as matrixing agents for developing sustained-release dosage forms. Hydrophobic polymers provide several advantages, ranging from good stability at varying pH values and moisture levels to well-established safe applications[11,12].
Materials and Methods
Tramadol Hydrochloride (THCL) was obtained as a gift sample from Balaji Drugs, Mumbai, India. Hydroxypropyl Methylcellulose (HPMC) K100M was purchased from Himedia, Mumbai. Glyceryl behenate, Microcrystalline Cellulose (MCC) and Polyvinylpyrrolidone (PVP) were purchased from Merck specialist Pvt. Ltd., Mumbai, India. All other chemicals and reagents used were of analytical grade.
Drug-excipient compatibility by Fourier-Transform Infrared Spectroscopy (FTIR) and Differential Scanning Calorimetry (DSC) study:
The drug and excipients must be compatible with one another to produce a product that is stable, efficacious, attractive and easy to administer and safe. FTIR spectra of tramadol, HPMC, glyceryl behenate, 1:1 w/w physical mixture of tramadol-HPMC and 1:1 w/w physical mixture of tramadol-glyceryl behenate, stored 24 h in a glass desiccator, and recorded after on FTIR spectrophotometer (Bruker Alpha-E, Bruker®, Germany) in the range of 400-4000 cm-1 using an Attenuated Total Reflectance (ATR) attachment equipped with zinc selenium optical assembly.
A differential scanning calorimeter (Perkin Elmer (United States of America (USA)), Model- Jade DSC) was used for analysis of thermal stress on tramadol and their mixture. Individual sample (tramadol) as well as 1:1 w/w physical mixtures of drug and excipients were weighed to about 5 mg in the DSC aluminum pan and scanned in the temperature range of 50°-300° in nitrogen environment. A heating rate of 10°/min was used, and the thermogram was reviewed for evidence of any interaction.
Optimization of the tramadol matrix tablet:
Optimization of formulation of sustained release tramadol tablet was done by Design Expert® Software (Version 8.0.7.1, Stat-Ease Inc.). A 32 full factorial design was constructed where the amounts of HPMC K100M (X1) and glyceryl behenate (X2) were selected as two independent variables. The levels of two factors were selected on the basis of literatures available and preliminary investigations carried out before implementing the experimental design. The responses (dependent variables) studied for this investigation was release at 12 h (T12), time taken to 100 % release (T100) and R2 of Higuchi equation. The polynomial equations required for the purpose of Analysis of Variance (ANOVA) are obtained from the factorial designs as shown in Table 1.
| Factors (independent variable) | Actual values (% w/w) | Response (dependent variable) | ||
|---|---|---|---|---|
| – 1 | 0 | +1 | ||
| X1 | 15 | 20 | 25 | Release at 12 h time taken to 100 % release R2 of Higuchi equation |
| X2 | 10 | 15 | 20 | |
Table 1: Variable Selected for Optimization
Preparation of THCL matrix tablet:
Tramadol layer was prepared by double granulation technique i.e., first melt granulation followed by wet granulation method. At first glyceryl behenate was exactly weighed as per formulation design and melted in porcelain dish on a water bath maintained at 75° for 3 min. THCL were exactly weighed and gradually added to the melted compound with continuous stirring till uniformly mixed. The molten mixture was allowed to cool and solidify at room temperature. The solidified mass was crushed in mortar and passed through a #22 mesh sieve. The prepared granules were subjected to air dried for 1 h. HPMC K100M, MCC were thoroughly mixed with the tramadol granules and mixed with PVP solution. The PVP solution was prepared by dissolving PVP in Isopropyl Alcohol (IPA). The wet mass was passed through mesh #22 and dried in tray dryer at 45° for 30 min and dried granules were sieved through mesh #22. Finally well-formed granules were lubricated with magnesium stearate and talc. The granules were compressed into 10 mm diameter flat-faced tablet punch as shown in Table 2.
| Ingredient (mg) | TR1 | TR2 | TR3 | TR4 | TR5 | TR6 | TR7 | TR8 | TR9 |
|---|---|---|---|---|---|---|---|---|---|
| Tramadol | 100 | 100 | 100 | 100 | 100 | 100 | 100 | 100 | 100 |
| HPMC K100M | 37.5 | 37.5 | 37.5 | 50 | 50 | 50 | 62.5 | 62.5 | 62.5 |
| Glyceryl behenate | 25 | 37.5 | 50 | 25 | 37.5 | 50 | 25 | 37.5 | 50 |
| MCC | 65 | 52.5 | 40 | 52.5 | 40 | 27.5 | 40 | 27.5 | 15 |
| PVP | 12.5 | 12.5 | 12.5 | 12.5 | 12.5 | 12.5 | 12.5 | 12.5 | 12.5 |
| Talc | 5 | 5 | 5 | 5 | 5 | 5 | 5 | 5 | 5 |
| Magnesium stearate | 5 | 5 | 5 | 5 | 5 | 5 | 5 | 5 | 5 |
Table 2: Composition of Formulations for Various Batches
Pre compression parameters:
Bulk density (Db) and Tapped density (Dt): Accurately weighed powder was carefully transferred into graduated measuring cylinder. The power bed was then made uniform and the volume occupied by the powder was noted as per the graduation marks on the cylinder as ml. then it was manually tapped for 50 times. Volume occupied by the powder was noted. The Db and Dt were calculated using the following formulas
Db=M/Vb
Dt= M/Vt
Where, M=Mass, Vb=Bulk volume and Vt=Tapped volume of the powder.
Compressibility index (I) and Hausner’s ratio: Carr’s index and Hausner’s ratio measure the propensity of powder to be compressed and the flow ability of granule. Carr’s index and Hausner’s ratio were calculated using following formula.
Carr’s index, I=Dt–Db/Dt×100
Hausner’s ratio, Dt/Db=Vb/Vt
Angle of repose (θ): The frictional forces in a loose powder can be measured by the angle of repose. This is the maximum angle possible between the surface of a pile of powder and the horizontal plane. Sufficient quantities of tramadol granules were passed through a funnel from a particular height (2 cm) onto a flat surface until it formed a heap, which touched the tip of the funnel. The height and radius of the heap were measured as shown in Table 3. The angle of repose was calculated using the formula
| Batch code | Bulk density (gm/ml) | Tapped density (gm/ml) | Carr’s Index (%) | Hausner’s ratio | Angle of repose (θ) |
|---|---|---|---|---|---|
| T1 | 0.4732 | 0.5323 | 11.1 | 1.1 | 23.5 |
| T2 | 0.4245 | 0.4732 | 10.29 | 1.19 | 23.62 |
| T3 | 0.4323 | 0.5091 | 15.08 | 1.17 | 25.32 |
| T4 | 0.4614 | 0.5647 | 18.2 | 1.22 | 25.02 |
| T5 | 0.4352 | 0.5156 | 15.59 | 1.18 | 24.07 |
| T6 | 0.4538 | 0.5402 | 15.99 | 1.19 | 25.3 |
| T7 | 0.4745 | 0.5534 | 14.25 | 1.16 | 24.56 |
| T8 | 0.4865 | 0.5568 | 12.02 | 1.14 | 25.78 |
| T9 | 0.4857 | 0.5623 | 13.62 | 1.15 | 24.98 |
Table 3: Pre Compression Parameters of All Formulations
Angle of repose (θ)=Tan-1 (h/r)
Where, h=height of the pile in cm and r=radius of the pile.
Post compression parameters:
Tablet dimensions: Thickness and diameter were measured using calibrated digital Vernier calipers. Ten tablets of each formulation were picked randomly, and thickness and diameter was measured individually[13].
Hardness test: The prepared tablets were subjected to hardness test. It was carried out by using Monsanto hardness tester and expressed in kg/cm2[13,14].
Friability test: Tablet strength was tested by Roche friabilator. Pre weighed tablets were given 100 revolutions in 4 min and were dedusted. The percentage weight loss was calculated by reweighing the tablets. The percent loss in weight (or friability) was calculated by the formula given below[13]:
% Friability= (1-W1/W0)×100
Weight variation test: 20 tablets were selected at random from the lot, weighed individually and the average weight was determined. The percent deviation of each tablets weight against the average weight was calculated. The test requirements are met, if not more than two of the individual weights deviate from the average weight by >5 % and none deviates >10 %[13,14].
Uniformity of drug content: Drug content was determined by dissolving sustained release granules equivalent to 100 mg of THCL in 70 ml of distilled water. It was shaken for 15 min and then diluted to 100 ml with distilled water. It was filtered through Whatman filter paper grade-41. 1 ml of this solution was transferred to 10 ml volumetric flask and final volume was made 10 ml. Absorbance of the resulting solution was measured at 271 nm. The drug content was determined by referring to the calibration curve[9].
In vitro drug release study:
Drug release studies were conducted in USP (II) dissolution test apparatus (Lab India, DS8000). The dissolution medium was 900 ml phosphate buffer pH 6.8, maintained at 37°±2°. The vessel maintained at 50 rpm under stirring conditions by means of paddle fabricated for purpose in dissolution apparatus. At various intervals of time, samples were withdrawn and filtered. The samples are then analyzed UV spectrophotometrically at 271 nm up to almost complete release of drug[9,10,12].
Drug release kinetics:
To investigate the kinetics of drug release from formulated tramadol sustained release tablets, the data of in vitro drug release study were fitted to different mathematical models. The order of drug release from matrix systems was described by using zero order or first order kinetics. The mechanism of drug release from matrix systems was studied by using Higuchi diffusion model and Hixson-Crowell model.
Korsemeyer-Peppas support the drug release mechanism for further judgment. The respective equations for these models are shown below[14,15]:
Zero order model: Q0-Qt=K0t
First order model: logC= logC0 ̶ Kt/2.303
Higuchi model: ft=Q=A√D (2C-CS) CSt
Hixson-Crowell model:W01⁄3-Wt1⁄3=Kt
Korsemeyer-Peppas Model: Mt⁄M∞=Ktn
Physical stability study: Short-term physical stability studies were carried out according to the International Conference on Harmonization (ICH) guidelines. The optimized formulation of tramadol tablets (T1 and T2) were enclosed in a polyethylene bottle using a screw cap and placed in a stability test chamber (Remi Environment Test Chamber, Remi Laboratory Instruments, India). The chamber environmental condition was set at 40° temperature and 75 % relative humidity, and maintained for 3 mo. At specified time intervals, the tablets were examined for any statistical difference in their hardness values, matrix integrity, and in vitro dissolution profile using a paired Student’s t-test. Differences were considered to be significant at p<0.05[16-18].
Results and Discussion
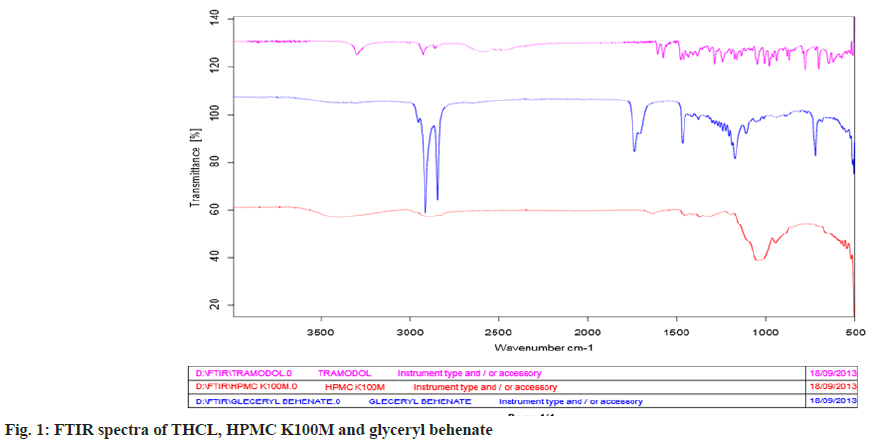
The FTIR study is carried out to find out the possible interaction between drug and the polymers. FTIR study of tramadol showed the peaks at 3299.25, 3011.56, 2927.76, 2859.67, 1576.67, 1239.03, 1195.00 and 1109.98 cm-1 due to the functional group like N-H, C-H (aromatic), C-H (Aliphatic), C- H, C=C, C-O, and C-N respectively. The physical mixture of drug with polymers like glyceryl behenate and HPMC K100M are also retaining the same peaks, which reveals that, there is no interaction between the selected drug and the polymers as shown in fig. 1.
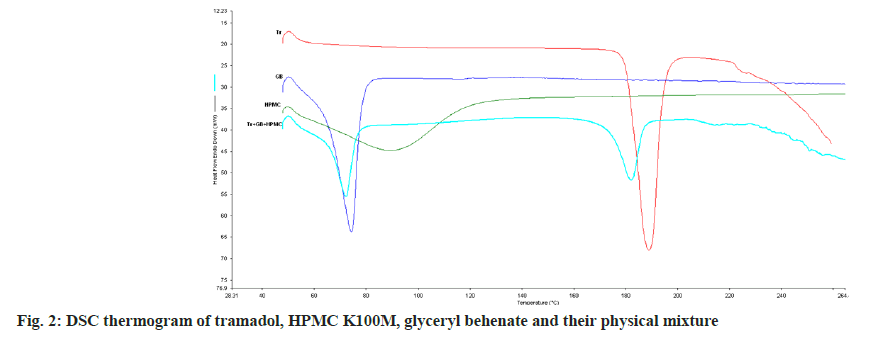
DSC thermogram of tramadol, glyceryl behenate, HPMC and their physical mixture are shown in fig. 2. DSC thermogram of tramadol shows a sharp endothermic peak at 189.04° which is characteristic melting peak of pure tramadol. DSC thermogram of glyceryl behenate shows its melting endothermic peak at 74.31° and HPMC shows wide and poorly absorb peak at 90.64° which is mainly due to evaporation of water. Thermogram of mixture of tramadol with glyceryl behenate and HPMC showed a melting endotherm at 182.21° and 72.14° due to melting of tramadol and polymer in mixture. There was neither any other endothermic peak nor any sharp exothermic peaks within the scanning range indicating there is not significant chemical and physical interaction between tramadol, glyceryl behenate and HPMC.
The prepared tramadol powders for tableting were prepared by double granulation method. The prepared tramadol granules were evaluated for angle of repose, Db, Dt and compressibility index, and Hausner’s ratio. The Db and Dt of the powder were found to be in the range of 0.4245-0.4865 g/ml and 0.4732-0.5647 g/ml. The angle of repose varied from 23.50-25.78 which indicate good flow properties of the powder. Hausner’s ratio was ranged between 1.1- 1.2, while the compressibility index was in the range of 10.29-15.99, these values indicates that the powder mixture of all batches of formulation exhibited good flow properties.
The tramadol tablets were prepared by double granulation method. The prepared tablets were evaluated for weight variation, hardness, friability and drug content. The hardness, friability, thickness, weight variation, drug content were found to be from 3.2-3.5 kg/cm2, <1 % (in case of all formulation), 3 mm, 99.12 %-100.76 % respectively.
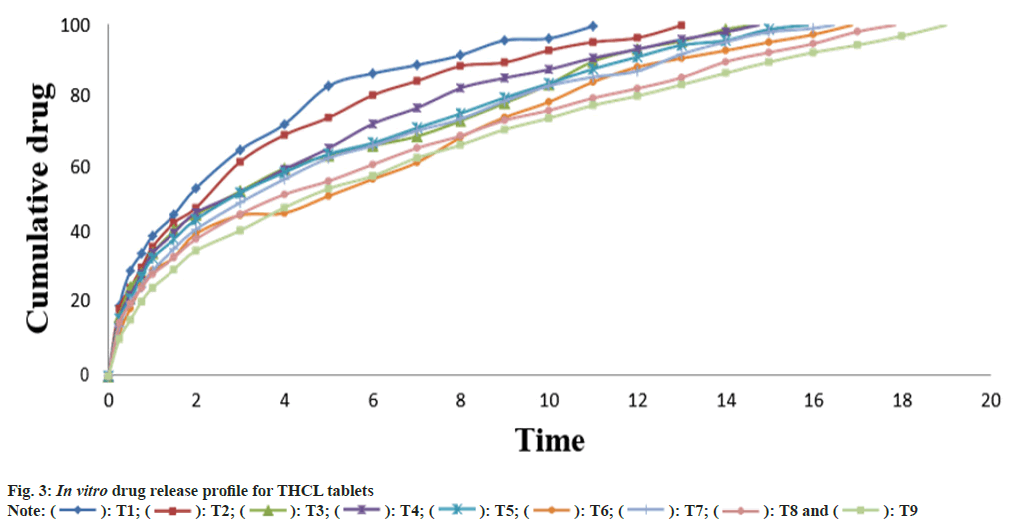
The in vitro drug release data of THCL matrix tablets is presented in Table 4 and the drug release profiles is shown in fig. 3. Clearly identifiable differences were observed in the release behavior of all tramadol formulations. In the formulations, release of tramadol in the 1st h varies between 39.94 in T1 and 25.15 in T9 and duration of drug release extended from 11 h in T1 to 19 h in T9. The results reveal that with increase concentration of HPMC and glyceryl behenate retardation of drug release takes place.
| Time (h) | Cumulative % drug release | ||||||||
|---|---|---|---|---|---|---|---|---|---|
| T1 | T2 | T3 | T4 | T5 | T6 | T7 | T8 | T9 | |
| 0.25 | 20.01 | 19.17 | 16.8 | 16.58 | 16.25 | 12.27 | 14.13 | 15.16 | 10.57 |
| 0.5 | 30.01 | 25.17 | 25.27 | 23.06 | 21.97 | 19.3 | 21.29 | 20.61 | 16.04 |
| 0.75 | 34.93 | 30.97 | 29.2 | 29.07 | 28.17 | 25.61 | 25.33 | 25.13 | 21.24 |
| 1 | 39.94 | 36.83 | 35.06 | 35.05 | 33.64 | 30.09 | 30.11 | 29.04 | 25.15 |
| 1.5 | 45.97 | 43.74 | 41.55 | 40.77 | 39.02 | 33.89 | 36.26 | 33.74 | 30.33 |
| 2 | 53.5 | 47.92 | 45.97 | 46.58 | 44.62 | 40.54 | 41.79 | 39.02 | 35.73 |
| 3 | 64.44 | 61.06 | 52.67 | 52.24 | 52.21 | 45.84 | 49.44 | 46.15 | 41.49 |
| 4 | 71.76 | 68.71 | 59.15 | 58.92 | 58.04 | 46.47 | 56.13 | 51.75 | 48 |
| 5 | 82.68 | 73.66 | 62.85 | 64.94 | 63.29 | 51.32 | 62.14 | 55.59 | 53.42 |
| 6 | 86.25 | 80.07 | 65.68 | 71.91 | 66.45 | 56.13 | 65.7 | 60.32 | 57.03 |
| 7 | 88.67 | 84.13 | 68.36 | 76.43 | 70.74 | 60.91 | 69.89 | 64.98 | 62.2 |
| 8 | 91.48 | 88.39 | 72.78 | 82.08 | 74.86 | 68.04 | 73.32 | 68.52 | 65.91 |
| 9 | 95.68 | 89.4 | 77.8 | 84.96 | 79.35 | 73.71 | 78.37 | 72.88 | 70.27 |
| 10 | 96.24 | 92.81 | 83.13 | 87.4 | 83.39 | 78.12 | 82.72 | 75.73 | 73.5 |
| 11 | 99.73 | 95.2 | 89.65 | 90.66 | 87.52 | 83.82 | 85.23 | 79.23 | 77.17 |
| 12 | 96.39 | 93.19 | 93.16 | 90.96 | 88.08 | 86.93 | 81.97 | 79.85 | |
| 13 | 99.98 | 95.5 | 95.95 | 94.32 | 90.57 | 91.76 | 85.08 | 83.05 | |
| 14 | 98.8 | 98.09 | 95.69 | 92.79 | 95.26 | 89.58 | 86.36 | ||
| 15 | 100.67 | 100.69 | 98.83 | 95.15 | 98.04 | 92.23 | 89.49 | ||
| 16 | 100.22 | 97.35 | 99.15 | 94.73 | 92.23 | ||||
| 17 | 100.47 | 101.29 | 98.17 | 94.37 | |||||
| 18 | 100.38 | 96.92 | |||||||
| 19 | 100.05 | ||||||||
Table 4: Cumulative In Vitro Drug Release Data of All Batches
The in vitro release studies data was quantified to determine the release mechanism, to fit various mathematical models and to determine which the best-fit model was.
In order to optimize the formulation of sustained release tablet of tramadol, the effect of selected variables viz. amount of HPMC and amount of glyceryl behenate was studied on the nature and the performance of the drug delivery device. According to the central composite design, nine formulations were prepared by varying the amount of independent variables. The individual and interactive effects of the independent variables on the selected responses have been studied and presented in a tabular form.
The statistical analysis of the data obtained from trial batches, performed by 32 full factorial design using Design Expert® software (version 8.0.7.1, Stat-Ease Inc., USA). The data clearly indicates that the values of three dependent variable viz. T12, T100, R2 strongly depends on independent variables viz. amount of HPMC and glyceryl behenate. Analysis of Variance (ANOVA) was performed to identify significant and insignificant factors. The model F-values for the responses i.e., T12, T100 and R2 were found to be 217.75, 78.82 and 281.65 respectively. This implies that the models were significant. The values of Prob>F (<0.05) for all the responses indicated the significance of the model as shown in Table 5. The polynomial equations relating the responses to the factors have been generated by multiple linear regression analysis as expressed below:
| Model | Formulation code | |||||||||
|---|---|---|---|---|---|---|---|---|---|---|
| T1 | T2 | T3 | T4 | T5 | T6 | T7 | T8 | T9 | T10 | |
| Zero order | R² | 0.2386 | 0.3134 | 0.4409 | 0.4301 | 0.4599 | 0.6703 | 0.5374 | 0.571 | 0.6779 |
| K0 | 11.68 | 9.826 | 8.175 | 8.408 | 7.784 | 7.088 | 7.367 | 6.715 | 6.303 | |
| First order | R² | 0.9427 | 0.9489 | 0.8795 | 0.9333 | 0.9194 | 0.9231 | 0.9426 | 0.9241 | 0.9571 |
| K1 | 0.392 | 0.319 | 0.223 | 0.248 | 0.22 | 0.171 | 0.205 | 0.171 | 0.153 | |
| Higuchi | R² | 0.939 | 0.9509 | 0.9672 | 0.9718 | 0.9757 | 0.9881 | 0.9861 | 0.9894 | 0.9981 |
| KH | 33.349 | 30.434 | 26.996 | 27.824 | 26.555 | 24.655 | 25.829 | 24.162 | 23.193 | |
| Hixon-Crowel | R² | 0.8872 | 0.8947 | 0.8177 | 0.8824 | 0.8657 | 0.9 | 0.9011 | 0.8812 | 0.9286 |
| KHC | 0.105 | 0.085 | 0.057 | 0.064 | 0.056 | 0.045 | 0.053 | 0.044 | 0.04 | |
| Korsmeyer-Peppas | R² | 0.9856 | 0.9899 | 0.9922 | 0.9969 | 0.998 | 0.9894 | 0.9985 | 0.999 | 0.9993 |
| KKP | 40.979 | 37.736 | 32.917 | 33.877 | 32.283 | 26.098 | 30.231 | 27.947 | 24.563 | |
| n | 0.388 | 0.393 | 0.409 | 0.409 | 0.413 | 0.475 | 0.432 | 0.438 | 0.476 | |
Table 5: Kinetic Analysis of In Vitro Drug Release Mechanism
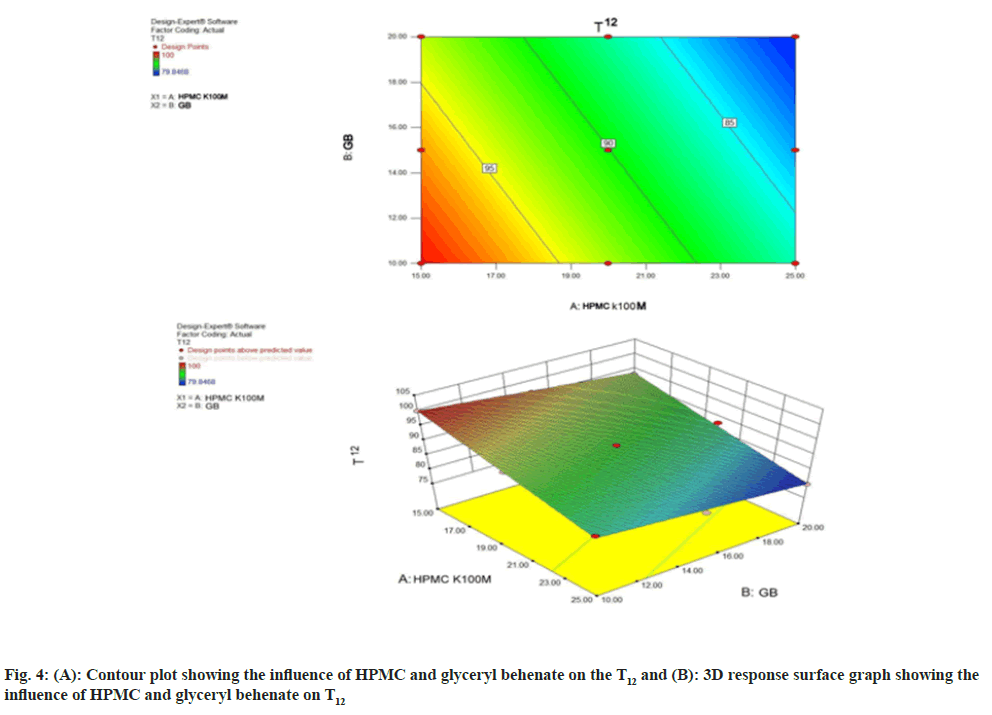
T12=90.0584-6.8062X1-3.1622X2 Eq. (1)
T100=15.6667+2.5X1+1.333X2 Eq. (2)
R2=0.9765+0.0194X1+0.0094X2-0.004X1X2-0.0067X12+0.003X22 Eq. (3)
Where, X1 and X2 are coded values of the test variables i.e., amount of HPMC and glyceryl behenate in % w/w.
The polynomial equation for T12 (Eq. 1) illustrates that both the variables viz. HPMC and glyceryl behenate was found to have negative effect on T12. Fig. 4A and fig. 4B represent the contour plot and three dimensional analyses for the studied response properties of release at 12 h. From the contour plot it can be concluded that the T12 decreases with augmentation of both variables. The response changes the variables in a linear and descending manner.
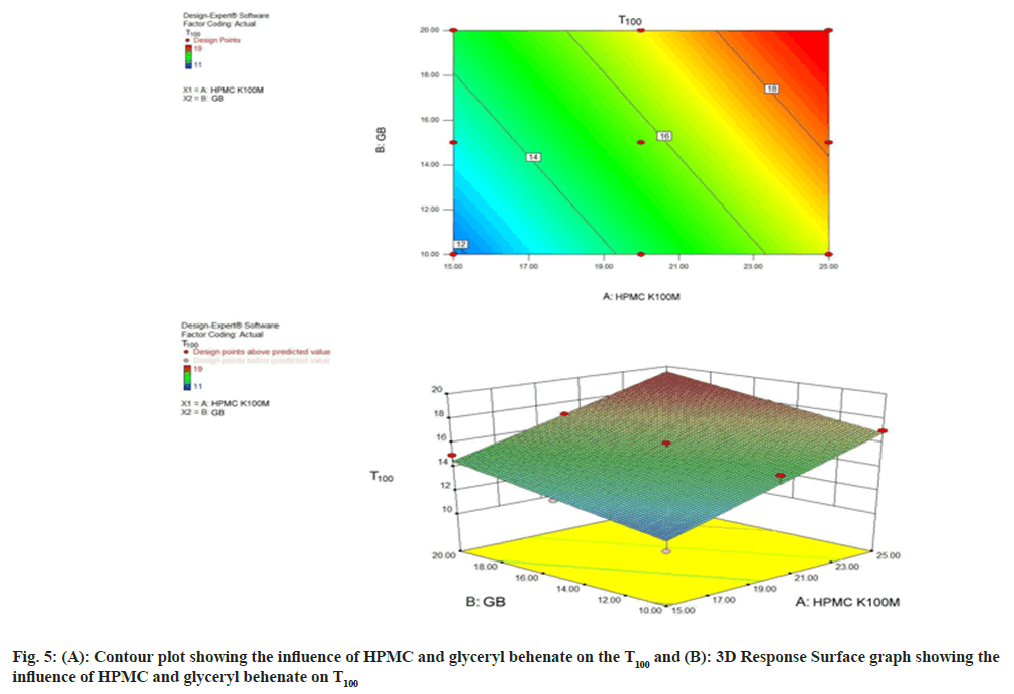
The polynomial equation for T100 (Eq.2) illustrates that both the variables viz. HPMC and glyceryl behenate was found to have positive effect on T100. Fig. 5A and fig. 5B indicate that as the concentration of both the polymer HPMC and glyceryl behenate was increased, time taken to 100 % release of the tramadol tablet has increased. The response changes the variables in a linear and descending manner.
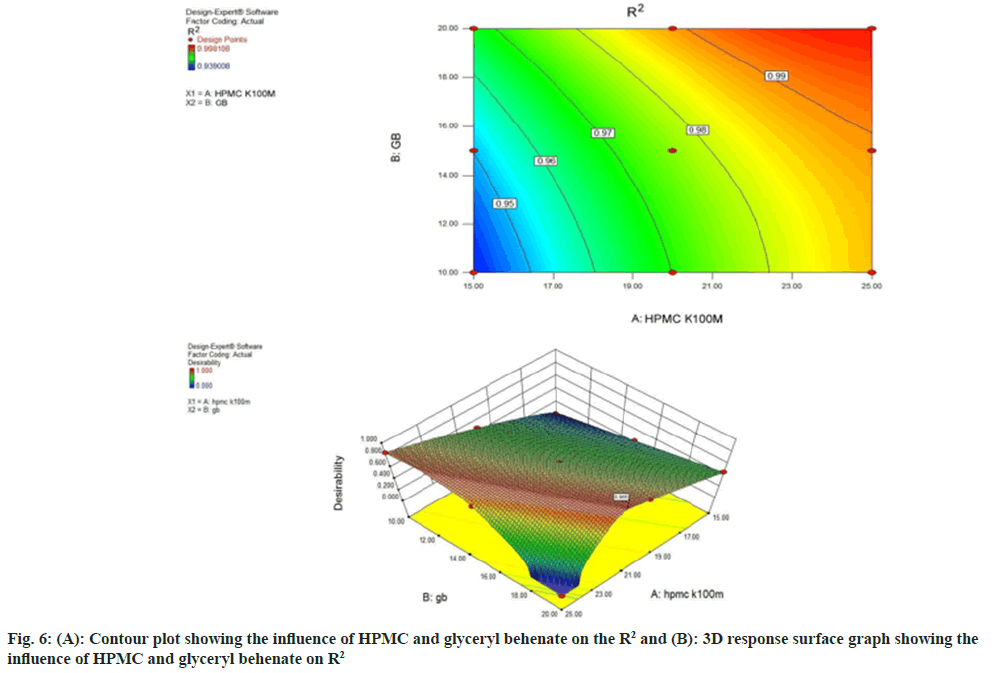
The contour and response surface plot (fig. 6A and fig. 6B) illustrate that the value of R2 (derived from Higuchi model) increased from 0.9390-0.9981, as the concentration of HPMC and glyceryl behenate was increased. Polynomial equation for R2 (Eq. 3) illustrated that both the independent variables viz. HPMC and glyceryl behenate have additive effect on R2. The increased concentration of HPMC and glyceryl behenate offers a linear release pattern as shown in Table 6.
| Formulation code | Factor 1 | Factor 2 | Response R1 | Response R2 | Response R3 |
|---|---|---|---|---|---|
| HPMC (% w/w) | GB (% w/w) | T12 (%) | T100 (h) | R2 | |
| T1 | 15 | 10 | 100 | 11 | 0.939 |
| T2 | 15 | 15 | 96.39 | 13 | 0.9508 |
| T3 | 15 | 20 | 93.19 | 15 | 0.9671 |
| T4 | 20 | 10 | 93.15 | 15 | 0.9718 |
| T5 | 20 | 15 | 90.95 | 16 | 0.9757 |
| T6 | 20 | 20 | 88.07 | 17 | 0.9881 |
| T7 | 25 | 10 | 86.92 | 17 | 0.9861 |
| T8 | 25 | 15 | 81.97 | 18 | 0.9894 |
| T9 | 25 | 20 | 79.84 | 19 | 0.9981 |
Table 6: Response Parameters of Various Formulations Prepared As Per the Experimental Design
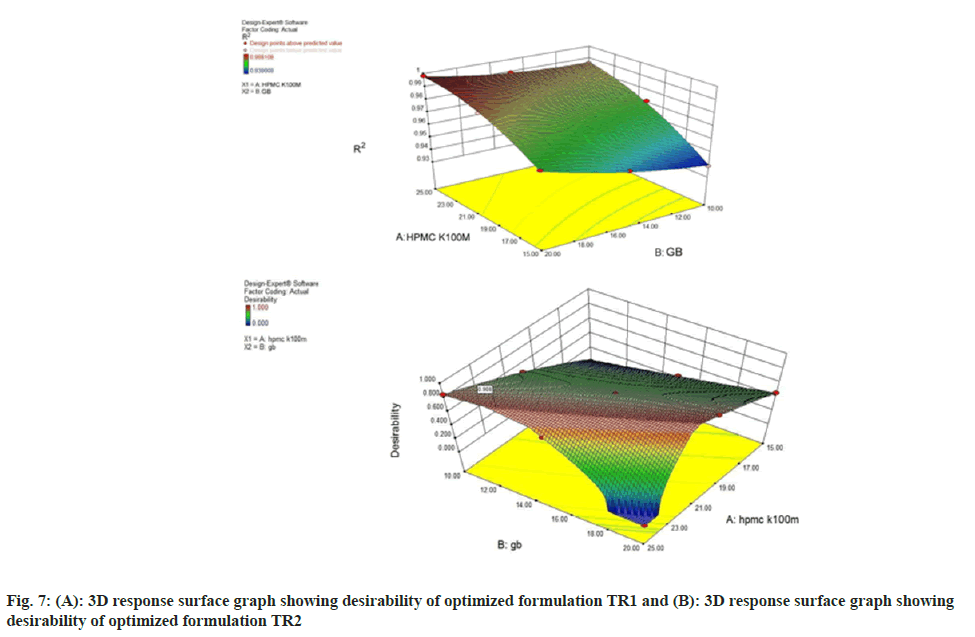
The most important part of RSM is to search the optimized formulation (fig. 7A and fig. 7B). Response surface optimization is more advantageous than the traditional single parameter optimization in that it saves time, space and raw material. A numerical optimization technique using the desirability approach was employed to develop a new formulation with the desired responses. The two formulations composition with HPMC concentration of 21.39 % and 25 %, the amount of glyceryl behenate was 20 % and 12.24 % respectively, fulfilled maximum requirements of an optimum formulation, desirability 0.955 and 0.907 respectively. The higher desirability value indicates the more suitability of the formulation in terms better regulation of drug release rate. The optimized formulation was evaluated for various dependent variables. The response values were calculated and compared to the corresponding predicted values.
Table 7 lists the values of the observed responses and those predicted by mathematical models along with the percentage prediction errors. The prediction error for the response parameters ranged between 0.43 % and 3.37 %.
| Response parameter | Observed value | Predicted value | Error (%) | |||
|---|---|---|---|---|---|---|
| TR1 | TR2 | TR1 | TR2 | TR1 | TR2 | |
| T12 | 83.56 | 82.12 | 84.99 | 84.99 | 1.68 | 3.37 |
| T100 | 18 | 18 | 17.69 | 17.42 | 1.75 | 3.32 |
| R2 | 0.988 | 0.995 | 0.992 | 0.987 | 0.43 | 0.88 |
Table 7: Comparison of Experimentally Observed Responses of the Optimized Tramadol Tablet with Predicted Responses
Statistical analysis of the results, before and after conducting the stability studies for 3 mo, was carried out using paired Student’s t-test. No significant difference (p>0.05) was observed in the tablet appearance, hardness or thickness. The similarity factor (f2) was calculated for comparison of dissolution profile before and after stability studies. The f2 values were found >50 (97.56 and 89.34 respectively after 1 mo and 3 mo) that indicate a good similarity between both the dissolution profiles. Similarly, no significant difference was observed in the drug content. The periodic data of stability study is presented in Table 8. The results of stability studies indicate that the developed formulation has good stability.
| Parameters | Study period (months) | ||
|---|---|---|---|
| 0 | 1 | 3 | |
| Appearance | Off-white coloured round shaped tablets | Off-white coloured round shaped tablets | Off-white coloured round shaped tablets |
| Hardness (kg/m2) | 3.5 | 3.4 | 3.4 |
| Thickness (mm) | 3 | 3 | 3 |
| Drug content (% w/w) | 99.45 | 98.83 | 98.28 |
| Dissolution profile Similarity factor (f2 %) | 98 | 96 | 97 |
Table 8: Results of Short Term Physical Stability Study
In conclusion, tramadol is a highly water soluble drug so alone hydrophilic matrix of HPMC could not control the tramadol release effectively. The experimental findings of the present study clearly pointed towards the use of a hydrophilic-hydrophobic mixed matrix system which allows drug release effectively for >12 h. An effective results observed in the response surface analysis indicates efficiency of the selected model in optimization of the formulation. The dependent variables, namely T12, T100 and R2 found to be modulated by formulation variables viz. concentration of HPMC K100M and concentration of glyceryl behenate. This result indicates that, the mixed matrix of HPMC K100M and glyceryl behenate can be used for formulation of controlled release tablets of highly water soluble drugs such as THCL.
Acknowledgments:
Girijananda Chowdhury Institute of pharmaceutical Sciences is gratefully acknowledged for providing laboratory facility during conduction of research work.
Conflict of interests:
The authors declare no competing interests.
References
- Lehmann KA. Tramadol in acute pain. Drugs 1997;53(2):25-33.
[Crossref] [Google Scholar] [PubMed]
- Raghavendra RN, Gandhi S, Patel T. Formulation and evaluation of sustained release matrix tablets of tramadol hydrochloride. Int J Pharm Pharm Sci 2009;1(1):60-9.
- Lachman L, Lieberman HA. The Theory and Practice of Industrial Pharmacy. Special Indian edition; 2009. p. 681-710.
- Wise DL. In handbook of pharmaceutical controlled release technology. Marcel Dekker. New York and Basel; 2005. p. 435-40.
- Ladani RK, Patel MJ, Rakesh PP, Bhatt T. Modern optimization techniques in field of pharmacy. Res J Pharm Biol Chem Sci 2010;1(2):148.
- Mathure DM, Bhalekar MR, Mathure DM, Padalkar RR, Dawane BS, Chobe SS. Formulation and statistical optimization of controlled release pellets of cetrizine dihydrochloride. Der Pharm Lett 2011;3(3):443-52.
- Mandal U, Gowda V, Ghosh A, Selvan S, Solomon S, Pal TK. Formulation and optimization of sustained release matrix tablet of metformin HCl 500 mg using response surface methodology. Yakugaku Zasshi 2007;127(8):1281-90.
[Crossref] [Google Scholar] [PubMed]
- Sahoo BK, Chakraborty U, Mukherjee J, Pal T. Optimization and validation of modulated release formulation of ranitidine HCl by response surface methodology. Int JPharm Sci Drug Res 2011;3(1):13-8.
- Kavitha K, Rakesh K, Theetha G. Preparation and evaluation of sustained release matrix tablets of tramadol hydrochloride using Compritol® 888 ATO by melt granulation technique. Res J Pharm Bio Chem Sci 2010;1(3):431.
- Mehulkkumer P, Patel M, Middha A. Formulation of sustain release matrix tablet of tramadol hydrochloride using hydrophilic polymer. Int J Pharm Res Dev 2013;5(56):e64.
- Lakade SH, Bhalekar MR. Formulation and evaluation of sustained release matrix tablet of anti-anginal drug, influence of combination of hydrophobic and hydrophlic matrix former. Res J Pharm Technol 2008;1(4):410-3.
- Tiwari SB, Murthy TK, Raveendra PM, Mehta PR, Chowdary PB. Controlled release formulation of tramadol hydrochloride using hydrophilic and hydrophobic matrix system. AAPS PharmSciTech 2003;4(3):E31.
[Crossref] [Google Scholar] [PubMed]
- Shirse P. Formulation and evaluation of bilayer tablets of diclofenac sodium with ranitidine HCl for sustained and immediate release. J Appl Pharm Sci 2012;30:136-41.
- Indian pharmacopoeia; Indian Pharmacopoeia Commission, Ghaziaabad; 2007;1:142-3.
- Dash S, Murthy PN, Nath L, Chowdhury P. Kinetic modeling on drug release from controlled drug delivery systems. Acta Pol Pharm 2010;67(3):217-23.
[Google Scholar] [PubMed]
- Gandhi CK, Mehta TJ, Patel MR, Patel KR, Patel NM. Box-Behnken design for optimization of formulation variables of Tramadol HCL sustained release matrix tablet. Int J Pharm Res Scholars 2012;1(2):99-113.
- Matthews BR. Regulatory aspects of stability testing in Europe. Drug Dev Ind Pharm 1999;25(7):831-56.
[Crossref] [Google Scholar] [PubMed]
- Ravala JA, Patel MM. Design and development of a swellable and mucoadhesive gastroretentive tablets of amoxicillin. Asian J Pharm Sci 2011;6(3-4):141-50.
