- *Corresponding Author:
- S. M. Alam
Department of Chemistry, Aliah University, Kolkata-700 156, India
E-mail: mafizchem@gmail.com
| Date of Submission | 18 July 2016 |
| Date of Revision | 04 January 2017 |
| Date of Acceptance | 20 April 2017 |
| Indian J Pharm Sci 2017; 79(3):402-410 |
This is an open access article distributed under the terms of the Creative Commons Attribution-NonCommercial-ShareAlike 3.0 License, which allows others to remix, tweak, and build upon the work non-commercially, as long as the author is credited and the new creations are licensed under the identical terms
Abstract
Silver nanoparticles were synthesized and applied to sensitize Ru(bipy)32+-Ce(IV) chemiluminescence system for the quantitative estimation of moxifloxacin. Prior to the experiment, silver nanoparticles were prepared using the well-reputed aqueous-gaseous phase reaction between ammonia and solution of silver nitrate. The utilization of silver nanoparticle was found to have enhanced effect on the weak chemiluminescence intensity of Ru(bipy)32+-Ce(IV) system. Additionally, the enrichment of the intensity was linearly proportional to the concentration of target compound. The effects of different experimental parameters were checked to obtain best results. Under the ideal experimental conditions, the linearity of the proposed method was obtained over the moxifloxacin concentration range of 5.6x10⁻⁹-2.2x10⁻⁶ M with the correlation coefficient (r2) value 0.9998. The detection limit was found to be 1.5x10⁻⁹ M and the relative standard deviation calculated from five replicate measurements was 2.1%. The interference from various foreign species for the analysis of moxifloxacin was tested since they may suppress or enhance the chemiluminescence signal. The obtained quality parameters and no significant interference effect on the intensity confirm that the method is reproducible, simple and could be applied for the successful evaluation of moxifloxacin in commercial tablet and human urine.
Keywords
Chemiluminescence, tris-(2,2′-bipyridyl) ruthenium (II), cerium (IV), silver nanoparticles, moxifloxacin
Moxifloxacin (MF) is the fourth-generation 8-methoxyquinolone derivative of fluoroquinolone (FQ) drug. It is belongs to a family of broad-spectrum antibacterials. According to IUPAC nomenclature, it is 1-cyclopropyl-7-[2,8-diazobicyclo(4.3.0)nonane]- 6-fluoro-8-methoxy-1,4-dihydro-4-oxo-3-quinolone carboxylic acid. Extensive use of MF has been reported earlier in the literature, which demonstrated in vitro activity against Gram-positive bacteria comparable to its activity against Gram-negative bacteria [1-3]. Bayer AG produced a pharmaceutical formulation of MF and marketed as its hydrochloride salt under the brand names of Avalox, Avelox and Avelon. Ophthalmic solution of MF is also available in the market as Moxeza and Vigamox for the treatment of conjunctivitis. Intravenous and oral formulations of MF are also available in the market and oral formulations have good bioavailability. MF is rapidly absorbed and reach maximum plasma concentrations between 1 and 4 h, after oral administration [3]. Some limitations for the application of MF have been reported in the literature. For example, MF therapy is associated with some serious adverse effects such as, irreversible peripheral neuropathy, tendonitis (inflammation of fibrous tissue that associates a bone to a muscle), tendon rupture (tearing of fibrous tissue) [4], uveitis [5], hepatitis, psychiatric effects and Clostridium difficile-associated disease [6].
Literature search revealed a number of analytical procedures for the determination of MF including high performance liquid chromatography (HPLC)-FL detection [7], solid phase extraction HPLC [8], conventional HPLC [9], hyphenated liquid chromatography combined with tandem mass spectrometry (LC-MS/MS) [2] and spectrophotometric method [10,11]. Other reported methods such as, differential pulse polarography (DPP) [12], electro analytical detection [13,14] and capillary electrophoresis with HeCd laser-induced fluorescence (FL) [15] were used for the analysis of MF.
A number of sensitizer chemiluminescence (CL) methods have also been reported in the literature for the analysis of drug substances. For example, analysis of FQ using sensitizing influence of terbium(III) on the CL intensity of the KMnO4-sodium sulphite system [16], benzamides analysis by their sensitizing effect on the Ce-sodium sulphite reaction [17], terbium sensitized CL for ciprofloxacin analysis [18], Lanthanide-sensitised CL for the quantitation of levofloxacin, MF and trovafloxacin in tablets [19] and silver nanoparticle (AgNP) sensitized CL for the determination of gatifloxacin [20].
In the current investigation, Ru(bipy)32+-Ce(IV) reaction based flow injection CL method has been reported. In the CL technique, the emission intensity related to the concentration of the chemical species was used for analytical measurement purpose. The proposed CL method offered many advantages in terms of high sensitivity because the absence of strong background light levels reduced the noise of the signals, shorter analysis time, wide linear range, low instrumentation cost as it required simple basic instrumentation and automation [21-23]. The CL system involved the use of the tris-(2,2′-bipyridyl) ruthenium (II) complex Ru(bipy)32+ and cerium (IV) (Ce IV) have been comprehensively studied and exploited for a wide variety of analytical applications [24-26]. But the major limitation including weak CL intensity often found in some traditional systems, which can be enhanced by introducing metal ion catalysts and nano materials in CL reactions system. Thus, to overcome the limitation of poor signal intensity, AgNP has been extensively studied as they possesses useful electrical, optical, and catalytic properties [27-30]. Therefore, the effect of AgNP on the proposed Ru(bipy)32+-Ce(IV) CL reaction system was studied. AgNPs were found to enhance the CL intensity of the reaction between Ru(bipy)32+ and Ce(IV) in presence of MF. The effects of the different reaction conditions on the CL intensity were checked for best result. The studied AgNP enhanced Ru(bipy)32+-Ce(IV) CL reaction system was applied for the quantitative analysis of MF in commercial tablet and human urine.
Materials and Methods
The flow system used two peristaltic pumps (Model 404, Ismatec, Zurich, Switzerland) and a six-way injection valve Rheodyne (Model 7125, Cotati, CA, USA). Polytetrafluoroethylene (PTFE) tubing (0.8 mm id) was used throughout the manifold to carry all components. A Spex (Model F111, Spex industries, Edison, NJ, USA) spectrofluorimeter equipped with a coiled glass flow cell was used for detecting and recording the CL intensity of the reaction product. The data acquisition was performed by Spex DM 3000 program. For the CL measurement, the lamp of the spectrofluorimeter was switched off. The slit width of the emission monochromator was 0.25 mm. High voltage for the photomultiplier tube (Model R 928, Hamamatsu, Japan) was set to 950 V.
All chemicals used during the CL analysis were of analytical reagent grade and were used as received. Distilled deionized (DI) water (Millpore, MilliQ Water System, USA) was used during the experimental process. MF was purchased from Sigma-Aldrich (St. Louis, USA). Stock solutions (1.0×10⁻³ M) of MF were prepared in DI water. Working solutions of desired concentrations were freshly prepared by further dilution of the stock solution with DI water. Stock solution (1.0×10⁻³ M) of Ru(bipy)32+ was prepared by dissolving appropriate amount of tris(2,2’-bipyridyl)dichloro-ruthenium(II) (Sigma-Aldrich, St. Louis, USA) powder in DI water. Ce IV solutions (1.0×10⁻³ M) were prepared by dissolving proper amount of Ce IV sulfate (Sigma-Aldrich, St. Louis, USA) in proper volumes of H2SO4 (Duksan, Ansan, Korea) and diluting to the mark with distilled water in 100 ml volumetric flasks. Working solutions were prepared daily with proper dilution with DI water. Silver nitrate and ammonia solution were procured from Sigma (Louis, USA).
Sample solutions for analysis were prepared as follows. The average tablet weights were calculated from the weight of each of 10 tablets, which were selected from the same group randomly. An accurately weighed portion of each homogenized sample containing 400 mg of MF (Avolex) was transferred separately into 1000 ml calibrated dark flask containing 500 ml of water and dissolved in ultrasonic bath for 20 min and diluted with de-ionized water to mark. The dissolved sample was passed through Millipore membrane filter paper (MF-Millipore™, 0.8 μm pore size and 150 μm thicknesses, USA) and diluted with water to obtain the appropriate concentration for analysis. Blank urine samples were collected from several volunteers. After immediate collection, 25 ml aliquots of urine samples from 5 volunteers were then spiked with MF separately at variable concentration levels, in order to calculate the recoveries of the proposed method. From these pools, each 0.5 ml aliquots were distributed to 0.5 ml Eppendorf and stored at freezing temperature (–18°) until analysis.
AgNPs were prepared following the reported method with some minor alterations [31]. The NP synthesis was based on the aqueous-gaseous phase reaction of AgNO3 solution and NH3 gas. Briefly, to a 100 ml two neck round bottom flask, 50 ml of silver nitrate solution (1.0×10⁻³ M) was added and the flask was placed into a constant temperature oil bath on a magnetic stirrer. About 50 ml ammonia solution (1 M) was added to another 500 ml flask kept in a water bath at room temperature. The flasks were connected with glass tubes through which ammonia gas volatilized and diffused slowly into the flask of silver nitrate. Ammonia solution then reacted with silver nitrate. The whole system was exposed to the light of daylight lamp. The steps involved during the preparation of AgNPs were, step 1, silver nitrate containing flask was kept under stirring (~70° oil bath) for 6 h; step 2, settling the flask for 6 h without stirring and heating; step 3, following step 1 for 5 h; step 4, repeating the step 2; step 5, following step 1 for 3 h.
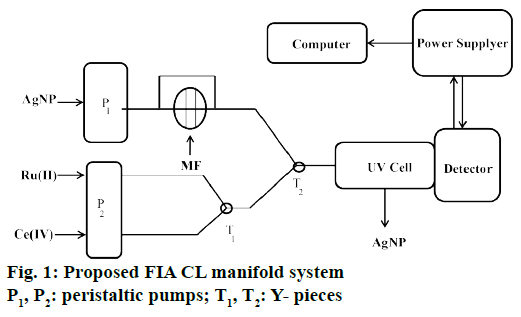
The flow injection analysis (FIA) system (Figure 1) comprised of a three-channel manifold using two peristaltic pumps. Prior to the CL measurement acquisition corresponding to the solution containing, Ru II stream was mixed with Ce IV solution stream in a three-way “T1” connector. Pump P1 delivers AgNP solution and the solution then mixed with sample solution through injection valve. The two streams then merged in the second “T2” connector and reached to the flow cell in the fluorimeter. The CL intensity produced in higher amount when a MF solution was incorporated into the carrier stream. The original CL signal corresponding to a blank was proportional to the sample concentration and used as analytical signal for the determination purposes.
Results and Discussion
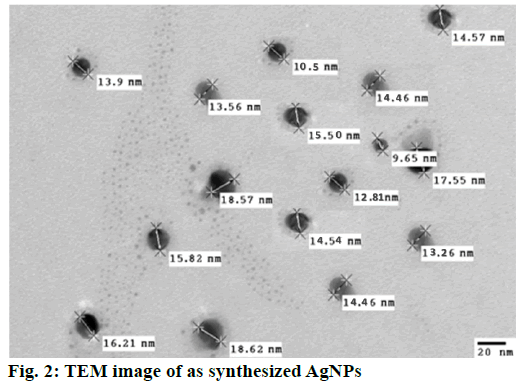
The transmission electron microscopy (TEM) image of AgNP showed (Figure 2) that the average size of AgNP is about 15.1 nm with well dispersion. This was further confirmed by the UV/Vis absorption spectrum of the synthesized AgNP. The narrow absorption peak found near 400 nm corresponded to the characteristic wavelength of silver absorbance and also confirmed the high level of monodispersity of the AgNPs in the solution [32,33].
In order to investigate the influence of oxidizing agents on the CL intensity, the effects of five different oxidizing agents on the CL intensity were investigated. In this study, five soluble oxidants were tested. One hundred micromolar concentrations of the following oxidants were prepared in 1.010−2 M H2SO4, Ce(SO4)2, KMnO4, KIO3 and KBrO3, while K3Fe(CN)6 was tested in 0.1 M NaOH solution. The results obtained showed that the CL intensity was strongly dependent on the oxidizing agents and the best CL intensity was found when Ce(SO4)2 was used as the oxidant. Therefore, Ce(SO4)2 was chosen for subsequent experiment.
The influence of acid media was studied by using 1.0×10⁻⁴ M Ce(SO4)2 in 1.0×10⁻² M of each of the following acids, HCl, H3PO4, HNO3 and H2SO4. The results showed that H2SO4 was the acid that gave the highest CL intensity. Therefore, H2SO4 was chosen for subsequent studies. It might probably because Ce(SO4)2 in H2SO4 gave sufficient oxidizing power to oxidize Ru(bipy)32+ to Ru(bipy)32+, which permitted the CL reaction to be favoured.
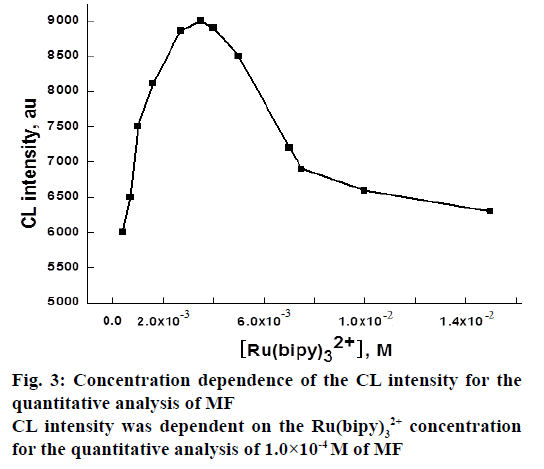
It was apparent that for the Ru(bipy)32+ CL system, the emission of light was generated from the excited state species (Ru(bipy)32+*), which was the reaction product of Ru(bipy)33+ with the appropriate reductants, commonly the analytes. Hence, Ru(bipy)33+ worked as the luminophor of the system [34]. The optimum concentration of Ru(bipy)33+ was established by investigating the effect of Ru(bipy)32+ concentration on CL intensity, while the concentration of MF was kept 1.0×10⁻⁴ M. The concentration of Ru(bipy)32+ was varied from 4.0×10⁻⁴-1.5×10⁻² M by keeping the concentration of the other solutions constant. The results showed that the CL intensity increased up to 3.5×10⁻³ M and then decreased (Figure 3). Thus 3.5×10⁻³ M was chosen as optimum Ru(bipy)32+ concentration for the determination of MF. The increased reagent to analyte ratio might be responsible for enhancement of CL intensity with increasing Ru(bipy)32+ concentration [35]. In addition, the decreased CL response of the system might be due to the effect of chloride counter anion of Ru(bipy)32+ compound on Ru(bipy)32+*.
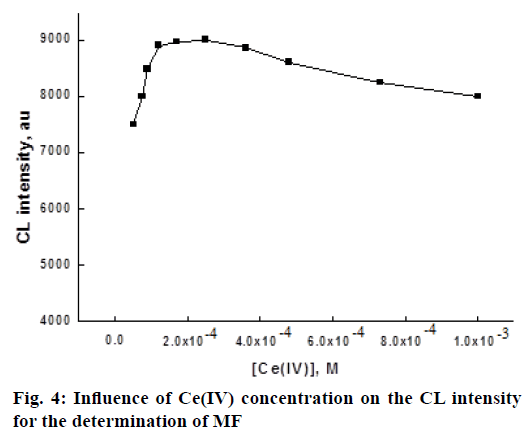
To find out the optimum concentration of Ce(SO4)2 oxidant, the effect of Ce(IV) concentration on the CL intensity was investigated in the range of 5.0×10⁻⁵-1×10⁻³ M. The experimental results indicate that when the concentration of Ce IV increased from 5.0×10⁻⁵ to 2.5×10⁻⁴ M, the CL intensity increased and further increase leads to the reduction in CL intensity (Figure 4). The decrease in CL intensity maybe due to the absorption of light emission by the colored Ce IV solution and the scattering of light emission by the hydrolysis product of Ce IV at the experimental acidity [36]. Hence, 2.5×10⁻⁴ M Ce IV was chosen for the determination of MF.
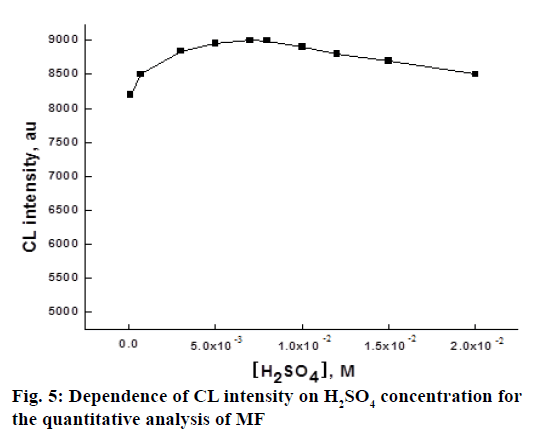
Ce IV species exist as sulphated complexes in the solution of H2SO4 and these species are in a series of equilibria with HSO4 [37]. So, H2SO4 play an important role for the CL reaction involving Ce IV. To find out the optimum concentration of H2SO4 used in the chemiluminogenic reaction for the determination of MF, the effect of H2SO4 concentration in the range of 1.0×10⁻⁴-2.0×10⁻² M on the CL intensity was investigated. The experimental results were shown in Figure 5. The maximum intensity was reached at 7.0×10⁻² M H2SO4 concentration and above this level, the CL intensity started to decrease, which indicated that the amounts of reactive species of the oxidants in the solution was maximum at 7.0×10⁻² M H 2SO4. So, this concentration was chosen as optimal for subsequent studies.
The time taken to transfer the excited product into the flow cell is critical for maximum collection of the emitted light [38]. In order to achieve maximum CL intensity, total flow rates between 1 and 4.5 ml/min were tested with equal flow rates in each channel of both pumps. CL intensity increased as the flow rate increased and reached maximum at 2.0 ml×min-1. Further increasing the flow rate did not alter the analytical signal significantly. It was observed that reagent consumption increased and peak shape as well as measurement rate were affected simultaneously with higher flow rate. Therefore, a flow rate of 2.0 ml×min-1 in each channel was recommended considering greater precision and economy in the use of reagents.
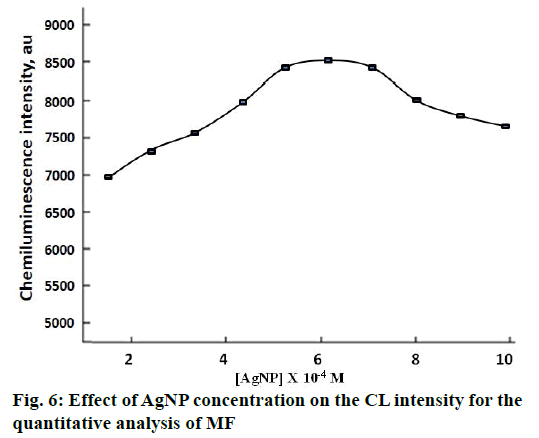
The concentration of AgNP appeared to exert a profound influence on the CL intensity of the studied system. For the determination of MF, the obtained CL intensity was found to be maximum when the concentration of AgNP was 6.0×10⁻⁴ M. Hence, this AgNP concentration was chosen as optimal for further studies (Figure 6).
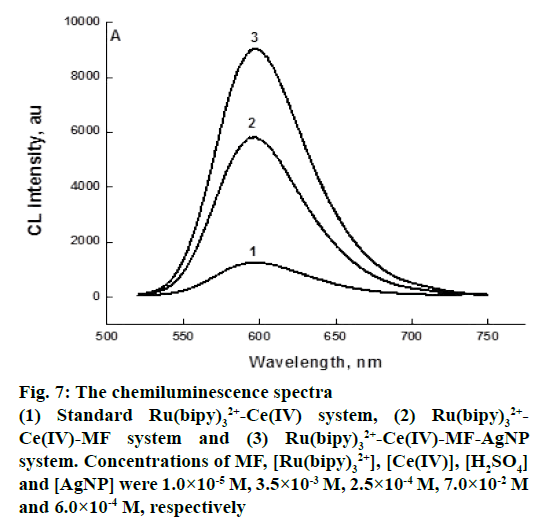
Figure 7 showed the intensity profiles of Ru(bipy)32+-Ce(IV) CL reaction catalyzed by AgNP in the presence of MF. From these spectra, it could be observed that MF exerted strengthening effect on Ru(bipy)32+-Ce(IV) system. Introduction of AgNP further enhanced CL intensity and the value of enhancement was proportional to the concentration of the substances added. By this property, MF could be determined with higher sensitivity using this method. Silver ions have been shown to catalyse the oxidation of various carboxylic acids with Ce IV, via the formation of 1:1 complexes between silver I and substrate [39]. The enhancement of the CL from reactions between, Ru II and Ce IV could therefore be attributed to the catalytic effect of silver ions on the oxidation of Ru II with Ce IV
Figure 7: The chemiluminescence spectra
(1) Standard Ru(bipy)32+-Ce(IV) system, (2) Ru(bipy)32+-Ce(IV)-MF system and (3) Ru(bipy)32+-Ce(IV)-MF-AgNP system. Concentrations of MF, [Ru(bipy)32+], [Ce(IV)], [H2SO4] and [AgNP] were 1.0×10⁻⁵ M, 3.5×10⁻³ M, 2.5×10⁻⁴ M, 7.0×10⁻² M and 6.0×10⁻⁴ M, respectively
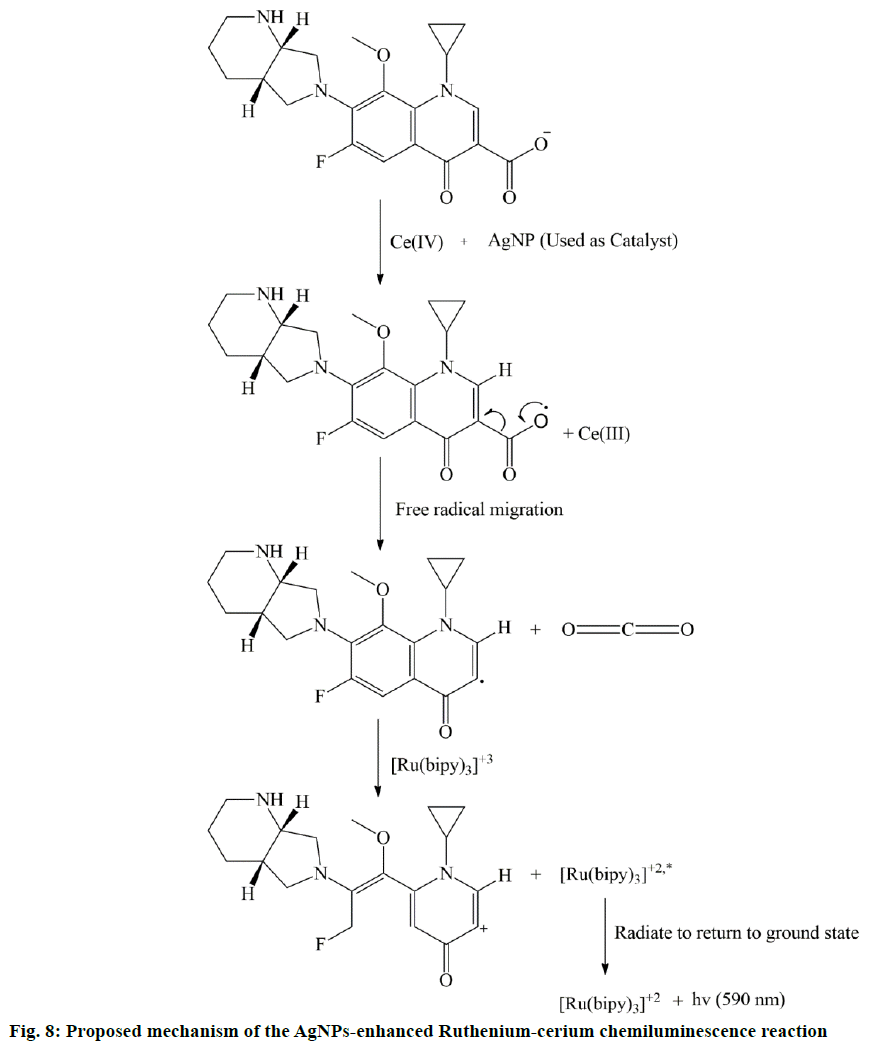
CL involving tris(2,2'-bipyridy1)ruthenium(II) (Ru(bipy)32+) as CL precursor was considered as a handy detection method for the determination of various components, such as amines, alkaloids, amino acids, carboxylic acids, pharmaceuticals and fungicides [40]. The CL mechanism of the (Ru(bipy)32+)-Ce(IV) reaction system could be explained by the following reaction sequence; step 1. Ru(bipy)32+→Ru(bipy)33+, oxidation, due to removal of an electron; step 2. Ru(bipy)33+→Ru(bipy)32+*, reduction with the target compound; step 3. Ru(bipy)32+*→Ru(bipy)32++hν, radiate energy in terms of light to return to ground state and CL emission occurs.
Normally, in all the cases, Ru(bipy)33+ is formed either by photochemical, electrochemical or chemical oxidation of Ru(bipy)32+. But according to Pérez-Ruiz et al., Ru(bipy)33+ itself is not a strong oxidant and the oxidation potential of Ce IV is much higher than Ru(bipy)32+ [41]. Therefore, the addition of Ce IV catalysed the formation of Ru(bipy)33+ and it also helped to form intermediate radicle of MF. Then this intermediate radicle of MF reacted with Ru(bipy)33+ and due to the reduction of Ru(bipy)33+, the excited species Ru(bipy)32+* is formed. After that, excited Ru(bipy)32+* radiate energy (hν) and returned to the ground state and this is responsible for CL emission (Figure 8). The addition of AgNP further increased the CL intensity because the Ag ions helped to reduce the activation energy of the CL reaction system and provided suitable environment to the CL process.
In order to obtain a calibration curve for MF, a series of standard solutions (N=8) was added to the Ru(bipy)32+-Ce(IV)-AgNP system under the optimized experimental conditions and the CL spectra were recorded. The results showed CL intensity was linear over the concentration range of 5.6×10⁻⁹-2.2×10⁻⁶ M, which is more widely linear and sensitive than previously reported results [41-43], where the linear range was 1.0×10⁻⁷ to 1.0×10⁻⁴ M. The limit of detection (LOD) as defined by IUPAC, Clod = 3×Sb/m, where Sb is the standard deviation of the blank signals and m is the slope of the calibration graph) was found to be 1.5×10⁻⁹ M, while in the previous report it was 5.6×10⁻⁹ M [42,43]. The correlation coefficient for the calibration curve was 0.9998. The relative standard deviation calculated from six replicate measurements was 2.1% for 1.0×10⁻⁴ M MF.
In a real sample, the analyte under investigation normally present with various interferents, which might suppress or enhance the CL signal of the proposed analysis technique. Therefore, a systematic study of various interferents on the CL intensity of Ru(bipy)32+-Ce(IV)-AgNP-MF were carried out. For this purpose, the concentration of MF was fixed at 1.0×10⁻⁵ M and the concentration of the other chemicals of the proposed CL system were fixed at Ru(bipy)32+, 3.5×10⁻³ M; Ce(IV), 2.5×10⁻⁴ M; H2SO4, 7.0×10⁻² M and AgNP, 6.0×10⁻⁴ M. The interference was tested by adding increasing concentrations of these potential foreign species to 1.0×10⁻⁵ M solution of MF until a greater than 5% variation in CL intensity was achieved. The experimental results are shown in the Table 1. From the table, it was evident that there was no interference as the results indicated that, most interferents have shown negligible deviation on the CL intensity of the proposed system.
| Interferents species | Foreign species:MF in tablet |
Foreign species:MF in urine |
|---|---|---|
| Na+, K+ | 100 | 90 |
| Al3+, Ca2+, Mg2+ | 90 | 95 |
| Starch, fructose, glucose | 50 | 55 |
| Sucrose, dextrin, lactose, galactose | 45 | 40 |
| Aspirin | 20 | 25 |
Table 1: Maximum Tolerable Concentration of Various Coexisting Ions and Compounds With Respect to the mf Concentration of 1.0×10⁻⁵m
The performance of the method was validated by analysing a marketed preparation Avolex (400 mg of MF) and human urine samples. Assay of the active ingredients in the tablet was performed by weighing 10 tablets, grinding the tablet mass, using an average weight of one tablet and dissolving it in DI water with shaking for 20 min in an ultrasonic bath. The solution was filtered through Millipore membrane filter, and the filtrates were diluted to the 1000 ml flask. Appropriate dilution was made from this solution to meet the linear range. The results and the percent recoveries obtained were summarized in the Table 2. As can be seen from the table, overall recovery of MF was about 96.0- 97.2%. Thus, it could be concluded that the results were satisfactory and in good agreement with the label claims by the manufacturer. The developed method could be easily performed with good precision and accuracy when applied to a drug sample.
| Sample | Active ingredient labelled | Found | Added(×10-9M) | Found (×10-9M) | Recovery mean±RSDa (%) |
|---|---|---|---|---|---|
| Avolex | 400 mg of MF | 397.4 ± 0.25 | 1.0 4.0 |
0.96 3.86 |
96.0±0.6 96.5±0.5 |
| 7.0 | 6.79 | 97.0±0.7 |
Table 2: Determination of mf in Tablets by Proposed Cl System
The analysis of MF was also performed in spiked urine samples. For this purpose, 25 ml aliquots of drug free urine samples were received from 5 volunteers and then spiked immediately with MF at three different concentration levels (2.0×10⁻⁹ M, 4.0×10⁻⁹ M and 6.0×10⁻⁹ M). Then each sample was introduced in the CL system to measure the CL intensity. After the measurement of the CL intensity, the recovery of each spiked standard was estimated from the calibration curve. The obtained results were listed in Table 3. Percent recoveries of MF in urine were obtained in the range of 95.5% to 97.2%. Also, the interference study was carried out by adding various foreign species as stated above, and negligible deviation in the CL intensity was found for a certain concentration of the interferrents. Therefore, it can be concluded that the developed procedure is sufficiently sensitive, selective and simple for the determination of MF in dosage forms and human urine sample.
| Sample | Added (×10-9M) |
Found (×10-9M) |
Recovery (%) mean±RSDa |
|---|---|---|---|
| MF | 2.00 | 1.91 | 95.5±1.2 |
| 4.00 | 3.89 | 97.2±0.8 | |
| 6.00 | 5.82 | 97.0±0.6 |
Table 3: Assays of mf in Spiked Urine Samples by Proposed Cl System
Several CL reactions have been reported in the literature with different CL reagents system, such as Ru-KMnO4, calcein-KMnO4, tris(2,2'-bipyridine) ruthenium(II)-octylphenylpolyglycol ether, K2Cr2O7, luminol-H2O2, luminol and diogenes. Each sensitizer system has its own advantages some being sensitive over the others while some were rapid. Only a few researchers reported that their method was less tedious as compared to the other.
Different pharmaceuticals have been determined using the above mentioned system, our previous method was based on calcein–KMnO4 system with a linear range of 6.0×10⁻⁸ M to 2.5×10⁻⁶ M with a LOD of 5.6×10⁻⁹ M [43]. Suh et al. reported MF determination using microfluidic chip assisted luminol-ferricyanide system [44]. The method reported followed Beer’s law in the range of 0.14-55.0 ng/ml and was able to quantify 0.2 ng/ml of MF with full accuracy. Although the system has greater sensitivity yet the preparation of the microfluidic chip introduces an extra step into the determination process. MF was determined along with levofloxacin and trovafloxacin in tablets using Ce(IV)-sulphite-FQ, the method was linear in the range of 0.2-3.0 μg×ml-1 with a detection limit of 0.035 μg×ml-1 and in this system the authors reported trivalent lanthanide acted the as emission-sensitizer [19]. The current method developed is advantageous over other reported methods except [44] in terms of sensitivity with a linear range of 5.6×10⁻⁹ M (2.25 ng×ml–1)-2.2×10⁻⁶ M (882.2 ng×ml–1) and LOD of 1.5×10⁻⁹ M (0.602 ng×ml–1). In addition to MF other drugs have also been analysed using CL system, aspirin was determined using a system of tris(1,10 phenanthroline)ruthenium(ii)-Ce (IV), which was linear over the range of 0.72-72.00 μg×ml–1 and LOD of 0.45 μg×ml–1 [45]. Some FQ were determined using the same sensitizer system [46] with linear range between 0.003-0.7 mg×ml−1. Hence it can be concluded that the current method is comparable and in good agreement with reported methods with the same sensitizer system and with other sensitizer systems that were used to determine MF.
In the proposed method, AgNPs has been synthesized and employed for the CL estimation of MF. AgNPs were prepared by aqueous-gaseous phase reaction of AgNO3 solution and NH3 gas and was found to enhance the CL intensity of Ru(bipy)32+-Ce(IV) system. This enhancement was linear with the concentration of MF added, based on which the CL system was established. Effects of different chemical variables were investigated. Under the optimal conditions, a linear calibration graph was obtained over the range of 5.6×10⁻⁹-2.2×10⁻⁶ M. The detection limits is 1.5×10⁻⁹ M. The correlation coefficient for the calibration curve was 0.9998. The relative standard deviation calculated from six replicate measurements was 2.1%. From the obtained quality parameters data it can be concluded that the proposed method is simple and reproducible, hence, it could be applied for the successful quantification of MF in commercial pharmaceutical tablets and urine samples.
Acknowledgements
The authors would like to extend their gratitude to the Deanship of Scientific Research, College of Science Research Center, King Saud University, Riyadh, Saudi Arabia for supporting this project.
Conflict of interests
The authors have confirmed that there is no conflict of interest.
Financial support and sponsorship
Nil.
References
- Donati M, Fermepin MR, Olmo A, Apote LD, Cevenini R. Comparative in vitroactivity of moxifloxacin, minocyclie and azithromycin against chlamydia spp. J AntimicrobChemother 1999;43:825-27.
- Vishwanathan K, Bartlett MG, Stewart JT. Determination of moxifloxacin in human plasma by liquid chromatography electrospray ionization tandem mass spectrometry. J Pharm Biomed Anal 2002;30:961-68.
- Biedenbach DJ, Barrett MS, Croco MAT, Jones RN. Antimicrobial activity of gatifloxacin tested against Neisseria gonorrhoeae using three methods and a collection of fluoroquinolone-resistant strains. DiagnMicrobiol Infect Dis 1998;32:307-10.
- https://www.accessdata.fda.gov/drugsatfda_docs/appletter/2004/21277s019,21085s024ltr.pdf.
- Eadie B, Etminan M, Mikelberg FS. Risk for uveitis with oral moxifloxacin: a comparative safety study. JAMA Ophthalmol 2015;133:81-4.
- https://www.accessdata.fda.gov/drugsatfda_docs/appletter/2007/021085s036,021277s030ltr.pdf.
- Kumar AKH, Ramachandran G. Simple and rapid liquid chromatography method for determination of moxifloxacin in plasma. J Chromatogr B 2009;877:1205-08.
- Zhang Y, Chen Y, Chen W. Determination of moxifloxacin in serum by solid phase extraction HPLC. ZhongguoYiyuanYaoxueZazhi 2007;27:481-83.
- Laban–Djurdjevic A, Jeliki´c–Stankov M, DjurdjevicP. Optimization and validation of the direct HPLC method for the determination of moxifloxacin in plasma. J Chromatogr B2006;844:104-11.
- Motwani SK, Chopra S, Ahmad FJ, Khar RK. Validated spectrophotometric methods for the estimation of moxifloxacin in bulk and pharmaceutical formulations. SpectrochimActa A 2007;68:250-56
- Ocana JA, Callejon M, Barragán FJ. Terbium-sensitized luminescence determination of levofloxacin in tablets and human urine and serum. Analyst 2000;125:1851-54.
- Inam R, Mercan H, Yilmaz E, Uslu B. Differential pulse polarographic determination of moxifloxacin hydrochloride in pharmaceuticals and biological fluids. Anal Lett 2007;40:529-46.
- Trindade MAG, da Silva GM, Ferreira VS. Determination of moxifloxacin in tablets and human urine by square-wave adsorptive voltammetry. Microcem J 2005;81:209-16.
- Erk N. Voltammetric behaviour and determination of moxifloxacin in pharmaceutical products and human plasma. Anal BioanalChem 2004;378:1351-56.
- Moller JG, Stass H, Heinig R, Blaschke G. Capillary electrophoresis with laser-induced fluorescence: a routine method to determine moxifloxacin in human body fluids in very small sample volumes. J Chromatogr B 1998;716:325-34.
- Yi L, Zhao H, Chen S, Jin L, Zheng D, Wu Z. Flow-injection analysis of two fluoquinolones by the sensitizing effect of terbium(III) on chemiluminescence of the potassium permanganate-sodium sulphite system. Talanta 2003;61:403-9
- Aly FA, Alarfaj NA, Alwarthan AA. Flow-injection chemiluminometric analysis of some benzamides by their sensitizing effect on the cerium-sulphite reaction. Talanta 2001;54:715-25.
- Lian N, Zhao H, Sun C, Chen S, Lu Y, Jin L. A study on terbium sensitized chemiluminescence of ciprofloxacin and its application. Microchem J 2003;74:223-30.
- Ocaña JA, Barragán FJ, Callejón M, De la Rosa F. Application of lanthanide-sensitised chemiluminescence to the determination of levofloxacin, moxifloxacin and trovafloxacin in tablets. MicrochimActa 2004;144:207-13.
- Wabaidur SM, Alamb SM, Alothman ZA, Mohsin K. Silver nanoparticles enhanced flow injection chemiluminescence determination of gatifloxacin in pharmaceutical formulation and spiked urine sample. SpectrochimActa A MolBiomolSpectrosc 2015;144:170-5.
- Su Y, Chen H, Wang Z, Li Y. Recent advances in chemiluminescence. ApplSpectrosc Rev 2007;42:139-76.
- Marquette CA, Blum LJ. Applications of the luminolchemiluminescent reaction in analytical chemistry. Anal BioanalChem 2006;385:546-55.
- Roda A, Guardigli M, Pasini P, Miracoli M, Michelini E, Musiani M. Bio and chemiluminescence imaging in analytical chemistry. Anal ChimActa 2005;541:25-36.
- Alam SM, Jeon CW, Karim MM, Lee SH, Wabaidur SW, Suh YS, et al. A sensitive procedure for the rapid determination of mandelic acid by flow injection analysis and chemiluminescence detection. Bull Korean ChemSoc 2009;30:102-6.
- Waseem A, Yaqoob M Nabi A. Flow injection determination of thyroxine in pharmaceutical preparations using tris(2,2′–bipyridyl)ruthenium(III)–NADH chemiluminescence detection. Talanta 2007;71:56-61.
- Townshend A, Ruengsitagoon W, Thongpoon C, Liawruangrath S. Flow injection chemiluminescence determination of tetracycline. Anal ChimActa 2005;541:103-9.
- Mallick K, Witcomb M, Scurrell M. Silver nanoparticle catalysed redox reaction: An electron relay effect. Mater ChemPhys 2006;97:283-7.
- Jiang ZL, Yuan WE, Pan HC. Luminescence effect of silver nanoparticle in water phase. SpectrochimActa A MolBiomolSpectrosc 2005;61:2488-94.
- Jin R, Cao YW, Mirkin CA, Kelly KL, Schatz GC, Zheng JG. Photoinduced Conversion of Silver Nanospheres to Nanoprisms. Science 2001;294:1901-3.
- Kottmann JP, Martin OJF. Influence of the cross section and the permittivity on the plasmon-resonance spectrum of silver nanowires. ApplPhys B 2001;73:299-04.
- Liu C, Yang X, Yuan H, Zhou Z, Xiao D. Preparation of silver nanoparticle and its application to the determination of ct-DNA. Sensors 2007;7:708-18.
- Riboh J, Haes A, McFarl A, Yonzon C, Van DuyneR. A Nanoscale Optical Biosensor: Real-time immunoassay in physiological buffer enabled by improved nanoparticle adhesion. J PhysChemB 2003;107:1772-80.
- Malinsky M, Kelly K, Schatz G, Van Duyne R. Chain length dependence and sensing capabilities of the localized surface plasmon resonance of silver nanoparticles chemically modified with alkanethiol self-assembled monolayers. J Am ChemSoc 2001;123:1471-82.
- He Z, Gao H. Simultaneous Determination of oxalic and tartaric acid with chemiluminescence detection. Analyst 1997;122:1343-6.
- Barnett NW, Hindson BJ, Lewis SW, Purcell SD. Determination of codeine, 6–methoxycodeine and thebaine using capillary electrophoresis with tris(2,2′–bipyridyl)ruthenium(II) chemiluminescence detection. Anal Commun 1998;35:321-4.
- Xi J, Xinping A, Zhike H. Chemiluminescence determination of barbituric acid using Ru(phen)32+–Ce (IV) system. Talanta 2003;59:1045-51.
- Wang X, Shen B, Zhao H, Jin L. Determination of ulifloxacin by terbium-sensitized fluorescence with second-order scattering and its applications. Anal Sci 2007;23:1373-6.
- Bian W, Wang Y, Zhu X, Jiang C. Spectrofluorimetric determination of trace amount of coenzyme II using ciprofloxacin-terbium complex as a fluorescent probe. J Luminesc 2006;118:186-92.
- Das AK. Kinetic and mechanistic aspects of metal ion catalysis in cerium(IV) oxidation. CoordChem Rev 2001;213:307-25.
- Birks JW, GraciaAM. Chemiluminescence and Photochemical Reaction Detection in Chromatography. New York: VCH Publishers; 1989. p. 123.
- Perez-Ruiz T, Martinez-Lozano C, Tomás V, Fenoll J. Chemiluminescence determination of citrate and pyruvate and their mixtures by the stoppedflow mixing technique. Anal ChimActa 2003;485:63-72.
- Lee SH, Kim GE, Alam SM, Kang M, Choi JH, Ferdous T, et al. Flow-injection chemiluminescence determination of moxifloxacin using Tris(2,2–bipyridyl) ruthenium(ii)–ce(iv) system. SensLett 2011;9:247-51.
- Wabaidur SM, Alam SM, Alothman ZA, Siddiqui MR, Naushad M, Alqadami AA. Flow-injection chemiluminescence method for the determination of moxifloxacin in pharmaceutical tablets and human urine using silver nanoparticles sensitized calcein-KMnO4 system. Bioprocess BiosystEng 2015;38:1803-10.
- Suh YS, Kamruzzaman M, Alam A-M, Lee SH, Kim YH, Kim G-M, et al. Chemiluminescence Determination of Moxifloxacin in Pharmaceutical and Biological Samples Based on Its Enhancing Effect of the Luminol-Ferricyanide System Using a Microfluidic Chip. Luminescence 2014;29:248-53.
- Mokhtari A, Keyvanfard M, Emami I, Delouei NJ, Pishkhani HF, Ebrahimi A, et al. Determination of aspirin using chemiluminescence system of tris(1,10 phenanthroline)ruthenium(II)–cerium(IV). J BrazChemSoc 2016;27:566-74.
- Aly FA, Al-Tamimi SA, Alwarthan AA. Chemiluminescence determination of some fluoroquinolone derivatives in pharmaceutical formulations and biological fluids using [Ru(bipy)32+]-Ce(IV) system. Talanta 2001;53:885-93.
