- *Corresponding Author:
- N. A. Kadnor
Department of Pharmaceutics (PG), Sanjivani College of Pharmaceutical Education and Research, Kopargaon, Ahmednagar-423 603, India
E-mail: nileshkadnor@gmail.com
| Date of Submission | 26 June 2014 |
| Date of Revision | 03 January 2015 |
| Date of Acceptance | 12 November 2015 |
| Indian J Pharm Sci 2015; 77(6):675-680 |
This is an open access article distributed under the terms of the Creative Commons Attribution-NonCommercial-ShareAlike 3.0 License, which allows others to remix, tweak, and build upon the work non-commercially, as long as the author is credited and the new creations are licensed under the identical terms.
Abstract
Present study was taken up to develop a topical formulation that releases the drug in controlled manner, reduce the side effects associated with topical drug delivery and improve product efficacy with aid of microsponges. Microsponges loaded with sertaconazole nitrate were prepared by using quasi emulsion solvent diffusion with five different proportions of the polymer (Eudragit RS 100). The developed microsponges were analyzed for particle size, production yield, entrapment efficiency and drug content. Scanning electron microscopic images of microsponges revealed that they are spherical in shape and contain pores. Pore structure analysis was done by using mercury intrusion porosimetry technique, which confirmed the porous nature of microsponges. Microsponges were then incorporated in to a 1% corbopol gel and evaluated for pH, drug content, texture profile analysis and in vitro drug release. The batch F IV was found to be optimal as it shown 69.38% controlled drug release in 8 h that followed Higuchi model.
Keywords
Microsponges, sertaconazole nitrate, controlled drug release, particle size
Sertaconazole nitrate (SN) is commonly used in topical formulations to treat various skin disorders like athelete’s foot, tineapedis [1]. SN is an imidazole derivative, which acts as a fungistatic, fungicidal, antibacterial, antiinflammatory, antitrichomonal, and antipruritic. SN inhibits 14 α-demethylase, which blocks ergosterol synthesis resulting in the prevention of fungal cell multiplication and hyphae growth [2]. Topical antifungal preparations sometimes cause skin irritation, pruritis, and sensitization [3]. Side effects could occur due to burst release of drug on application. Modification of release pattern in such a fashion to control the delivery rate of the active ingredient to predetermined site in the human body is a challenging area of research [4]. Controlling the release of a drug from the topical formulation to the epidermis/topical layer of the skin would improve drug residence time as well as reduce absorption of the drug into systemic circulation leading to reduced incidence of side effects [5]. Microsponges have been frequently investigated to achieve these goals in recent years [6].
Microsponges are porous polymeric spheres, containing a myriad of interconnecting voids that have appearance of a tiny sponge with porous surface, through which drugs could be released in a controlled manner [7,8]. Microsponges range from 5-300 μm in size and able to load or adsorb comparatively high degree of actives [8]. Microsponges can enhance stability, reduce side effects and alter release pattern [9].
The present study was aimed to develop a topical formulation, which released the drug in a controlled manner with aid of microsponge. Microsponges of SN were formulated by using Eudragit RS 100 as a control release polymer.
Materials and Methods
The following materials of either AR/LR grade or the best possible pharma grade available were used as supplied by the manufacturer, sertaconzaole nitrate, polyvinyl alcohol (Research-Lab Fine Chem Industries, Mumbai), Eudragit RS100 (Evonik Roehm Pharma polymers), methylene chloride (Research-Lab Fine Chem Industries, Mumbai), triethyl citrate, corbopol 934, triethanolamine, (S. D. Fine Chem, Mumbai).
Preparation of microsponges
Microsponges were prepared using quasi emulsion solvent diffusion method because of feasibility, ease of preparation and reproducibility of the proposed method. Eudragit RS 100 and drug were dissolved in dichloromethane by sonication. Triethyl citrate, a plasticizer was added to the drug polymer solution and poured in to external phase comprising of polyvinyl alcohol in distilled water with continuous stirring for 8 h for removal of dichloromethane. After 8 h the solution was filtered, washed with water and dried in oven above 40° [10].
Infra-red spectroscopy analysis
The pure drug and polymers were subjected to IR studies. In the present study, IR spectra of pure drug, polymer, and mixture were taken by using FTIR spectrophotometer, (FTIR8400S) Shimadzu, Japan.
Differential scanning calorimetry
The DSC thermogram of SN was recorded using differential scanning calorimeter. Pure drug sample were weighed and heated in a closed pierced aluminum pan at a scanning rate of 10°/min between 30 and 300° and 40 ml/min of nitrogen flow.
Determination of the effect of drug/polymer ratio
To study the effect of drug/polymer ratio on physical characteristics and drug release properties of microsponges five different ratios of drug to Eudragit RS 100 (1:1, 4:1, 6:1, 8:1 and 10:1) were formulated as shown in Table 1. In each formulation, the amount of polymer was kept constant at 200 mg the amount of triethyl citrate was 0.2 ml and the solvent amount was 5 ml, external phase volume was 200 ml.
| Formulationcode | Drug:Polymerratio | Production Particle | Drugcontentpercentage | EEpercentage | |
|---|---|---|---|---|---|
| yieldpercentage | size(μm) | ||||
| F1 | 1:1 | 60 | 21.42 | 39.97 | 79.94 |
| F2 | 4:1 | 71.66 | 17.28 | 57.95 | 86.93 |
| F3 | 6:1 | 73.75 | 15.70 | 68.93 | 91.89 |
| F4 | 8:1 | 75.44 | 15.12 | 74.42 | 94.28 |
| F5 | 10:1 | 77.56 | 16.18 | 79.49 | 95.39 |
Table 1: Effect of drug to polymer ratio on Physical characterization
Determination of production yield and entrapment efficiency
Production yield of microsponges was determined by calculating initial weight of raw materials and the final weight of microsponges obtained [11]. Percent yield = (Practical mass of microsponge/Therotical mass (polymer+drug))x100.
Entrapment efficiency
Microsponge equivalent to 20 mg of the drug were taken for evaluation. The amount of drug entrapped was estimated by soaking microsponges overnight with 30 ml of methanol. The amount of drug entrapped in the microsponges was calculated by following formula [7]. Entrapment efficiency = (Actual drug content in microsponge/Therotical drug content) x100.
Particle size analysis of microsponges
Determinations of average particle size of SN-loaded microsponges were done by using optical microscopy (Motic 40X). A minute quantity of microsponges were spread on clean glass side using water and average particle size was calculated by measuring 50 particles of each batch [12].
Morphology
Morphological study was carried out using a scanning electron microscope (SEM). Microsponges were scanned and examined under electron microscope and SEM images were taken [13].
Determination of porosity parameters
Pore related parameters like total specific surface area, % porosity, average pore diameters, total cumulative value, bulk and apparent density were determined by using mercury intrusion porosimetry. Pressure was gradually applied in a cell in which a small sample of the microsponge was placed under mercury. With increasing pressure more mercury was forced to enter even smaller pores of the microsponge, resulting in an apparent reduction in the volume of mercury in the cell that was measured [5,14].
Preparation of gel
A clear dispersion of corbopol was prepared in water by gradual addition of corbopol 934 in water using moderate agitation. SN microsponges equivalent to 2% w/w SN were dispersed in corbopol dispersion and pH was adjusted to neutral by using triethanolamine till firm and transparent gel was formed [13].
Physical parameters of gel
The gel formulations of SN microsponges were characterized for pH using pH meter, viscosity using a Brookfield digital viscometer and texture profile analysis was carried out by CT3-Texture Analyzer.
Drug content
One gram of microsponge-loaded gel was accurately weighed and dissolved in methanol, filtered and volume was made to 100 ml with methanol. The drug content was determined by diluting the resulting solution for 10 times with methanol and measuring the absorbance at 260 nm using Shimadzu-1650 UV/Vis spectrophotometer [15].
pH and homogeneity
The pH of various gel formulations was determined by using pH meter. All developed gels were tested for homogeneity by visual inspection after the gel has been set in the container. They were tested for their appearance and presence of any aggregates.
Texture profile analysis
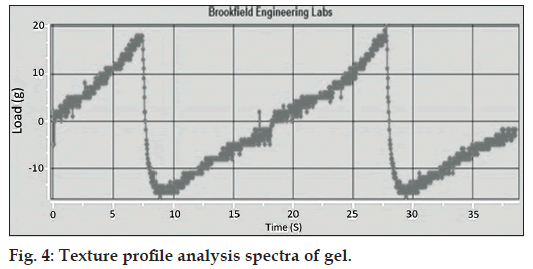
Texture profile analysis (TPA) of prepared gel was carried out by using Brookfield texture analyzer. TPA is a set of definitions relating the sensory properties of a product to the instrumental properties, which can be calculated from the results of a two cycle texture profile analysis test. Texture analyzers perform this test by applying controlled forces to the product and recording its response in the form of force, deformation and time [2,16].
Release kinetics
The in vitro release of microsponges containing SN from the gel formulation was studied through cellophane membrane using Franz diffusion cell apparatus. The diffusion medium was freshly prepared phosphate buffer pH 6.8 and methanol (60:40) ratio was taken. one gram equivalent gel formulation of SN microsponge was kept on diffusion membrane. The temperature of assembly was maintained at 37±1º medium was stirred at 300 RPM. Aliquots each of 3 ml volume were withdrawn periodically at predetermined time interval of 1, 2, 3, 4, 5, 6, 7 and 8 h and replaced by an equal volume of the receptor medium. Samples were analyzed by UV/Vis spectrophotometer at 261 nm [5,12].
Results
Formulation of microsponges
In the present study quasi emulsion solvent diffusion method was used due to feasibility, ease of preparation and reproducibility of proposed method. Microsponges with desired morphology were obtained with this method. Encapsulating shell is form as polymer is insoluble in water and Porous surface results due to diffusion of dichloromethane.
Effect of drug to polymer ratio
Production yield, drug content and entrapment efficiency was found to be increase with increase in drug polymer ratio while drug:polymer ratio has reverse effect on particle size, as drug:polymer ratio increase, particle size decreases up to a certain limit as shown in Table 1, particle size was in decreasing order up to F4 and in F5 increase in particle size was observed. Particle size increases after a particular level, it may attribute to increased viscosity of organic phase due to increased drug:polymer ratio.
Characterization studies
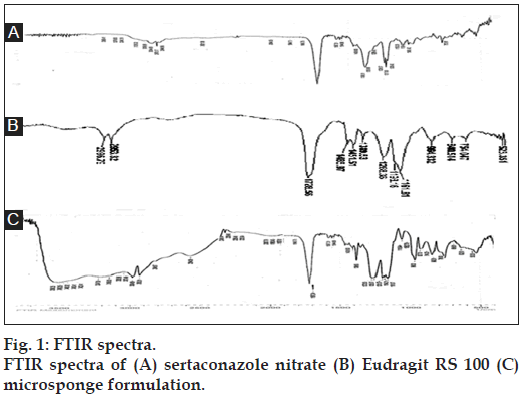
FTIR graphs of pure drug (A), Eudragit RS 100 (B), and the formulation (C) were obtained as shown in fig. 1. The IR spectra of microsponge formulation showed characteristic peaks of pure drug with no significant deviation that are C-Cl stretch at 786 cm-1, C=N stretch at 1720 cm-1, C-N stretch at 1388 cm-1, S-H stretch at 2544 cm-1, C-H stretch at 2952 cm-1. It clearly indicated that no interaction occurred between the drug and the polymer. It also indicated that drug was loaded in the microsponges as it showed peaks of both drug and polymer.
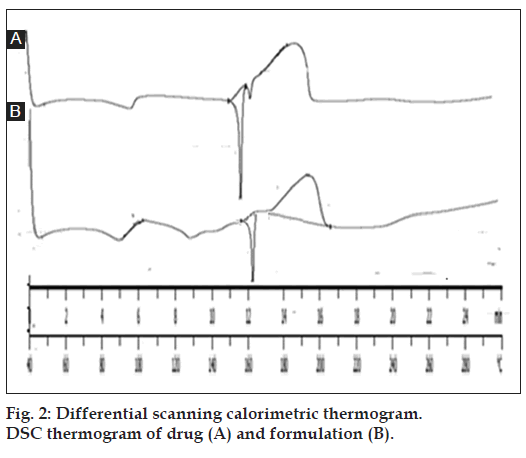
The DSC thermogram of drug showed sharp endothermic peak at 156º, which is near to m.p. of drug (156º-161º) indicating that drug is in pure form. DSC graph of formulation (drug-loaded microsponges) also showed an endothermic peak at 161º. No significant deviation in the peaks was observed it indicates that drug having compatibility with the components of microsponge formulation as shown in fig. 2.
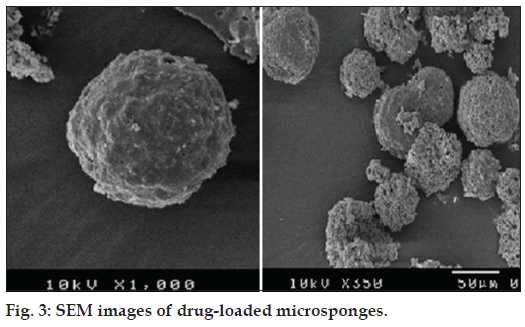
SEM images of microsponges shown in fig. 3 corroborated that microsponges were porous and spherical in shape. Optimized batch was subjected to mercury intrusion porosimetry for pore structure analysis, which gave various parameters related to porosity as shown in Table 2.
| Parameters | Observation |
|---|---|
| Total cumulative volume (cc/g) | 0.3777 |
| Total specific surface area (m2/g) | 38.614 |
| Average pore diameter (μ) | 1.6240 |
| Total porosity (%) | 6.8589 |
| Bulk density (g/cm3) | 0.18159 |
| Apparent density (g/cm3) | 0.19496 |
Table 2: Porosity Analysis of Microsponges
Physical parameters of gel
All the microsponges-loaded gel batches were evaluated for % drug content and pH. The optimized batch (F4) showed 88.95% drug content and 6.8 pH. The plane drug loaded gel batch (F0) showed drug content 98.22% and pH 6.7 as shown in Table 3.
| Formulation code | Percentage of drug content | pH |
|---|---|---|
| F0 | 98.22 | 6.7 |
| F1 | 88.54 | 7 |
| F2 | 86.53 | 6.8 |
| F3 | 85.33 | 7.1 |
| F4 | 88.95 | 6.8 |
Table 3: Parameters of Gel
TPA results of gel showed that the area under the positive curve is a measure of the energy required to deform the sample to the defined distance. Research has shown that the firmness and energy required for deforming a sample to a defined depth grades samples in order of spreadability as shown in fig. 4. A higher peak load (firmness) and hardness work done value indicated a less spreadable sample. Conversely, a lower peak load (firmness) value coupled with a lower hardness work done value indicated a more spreadable sample.
In vitro drug release
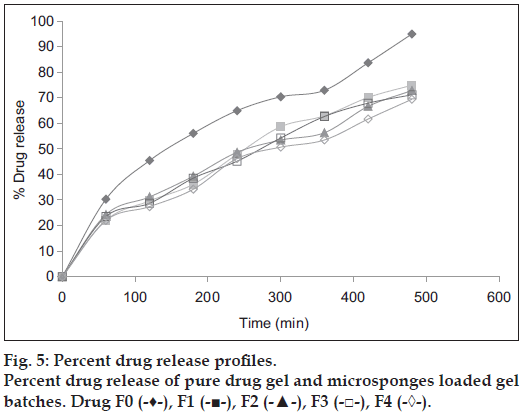
In vitro drug release of microsponges enriched gel has shown that the drug release profile was altered and was controlled. Formulation F4 was found to be optimal since it exhibited greater controlled release (69.4 %) in 8 h as opposed to other formulations as shown in fig. 5. In first 2 h more than 20-25% drug release was observed, which was attributed to the surface-adsorbed drug on microsponge as shown in Table 4.
| Time | Percentage of cumulative drug release | ||||
|---|---|---|---|---|---|
| F0 | F1 | F2 | F3 | F4 | |
| 0 | 0 | 0 | 0 | 0 | 0 |
| 60 | 30.3 | 22.05 | 24.3 | 23.55 | 21.99 |
| 120 | 45.436 | 29.666 | 31.216 | 28.726 | 27.43 |
| 180 | 56.066 | 36.166 | 39.296 | 38.546 | 34.22 |
| 240 | 64.926 | 47.846 | 48.636 | 45.166 | 46.19 |
| 300 | 70.356 | 58.666 | 53.426 | 54.236 | 50.67 |
| 360 | 72.896 | 62.916 | 56.316 | 62.656 | 53.48 |
| 420 | 83.636 | 70.086 | 66.616 | 67.866 | 61.66 |
| 480 | 94.896 | 74.896 | 72.816 | 71.126 | 69.386 |
Table 4: Percent drug release of drug and Different batches of microsponges loaded Gel
Pharmacokinetic model
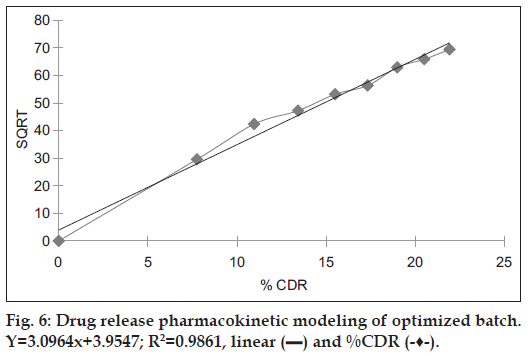
Release data obtained from the optimal batch was subjected to release pattern analysis, which indicated that the formulation F4 followed Higuchi model as the regression coefficient value of 0.9861 was very near to 1 as shown in Table 5 and fig. 6.
| Models | Slope | Regression coefficient |
|---|---|---|
| Zero order | 0.1213 | 0.8435 |
| First order | 0.0025 | 0.4789 |
| Higuchi model | 3.0964 | 0.9861 |
| Korsemeyer-Peppas model | 0.6892 | 0.9765 |
Table 5: Pharmacokinetic modeling of Optimized batch
Discussion
In quasi emulsion solvent diffusion method affinity between good solvent and drug is stronger than the affinity between good solvent and poor solvent. Drug solution in the good solvent formed emulsion droplets (quasi) upon pouring into the poor solvent and the organic phase then diffused out in to the external phase resulting in the formation of pores in the micron-sized particles, known as microsponges that have taken a spherical shape due to constant stirring.
Free flowing spherical microsponges were obtained by quasi emulsion solvent diffusion method with eudragit RS 100. The method seems to be promising for the preparation of SN microsponges.
It was observed that drug to polymer ratio had effect on production yield, drug loading, encapsulation efficiency and particle size. Increasing the drug to polymer ratio showed enhancement in all these parameters only up to certain limit, beyond which no further enhancement observed. Similar effect was observed on particle size which decreased up to the formulation F4 as shown in Table 1. This may be attributed to the fact that at higher relative drug content, the amount of polymer available per microsponge to encapsulate the drug becomes less. F IV was selected as the optimal batch. FT-IR study revealed that drug loading occurred in the in microsponges as both polymer and drug peaks have been observed. No significant deviation in the peaks was observed which indicated that there is no incompatibility between drug and formulation components. The DSC thermogram of drug and formulation were obtained, no major change in the thermogram was observed indicating that drug and polymer are compatible with each other.
Morphology and pore structure analysis by SEM and mercury porosimetry revealed that microsponges are spherical in shape and and contained pores, which is a characteristic.
Microsponges-loaded gel showed drug release in a control manner, which is the key to reduce side effects associated with topical drug delivery system. Formulation F4 showed 69.38% drug release in 8 h and followed Higuchi model of release kinetic.
Financial support and sponsorship
Nil.
Conflicts of interest
There are no conflicts of interest.
References
- Goldust M, Rezaee E, Masoudnia S, Raghifar R. Clinical study of sertaconazole 2% cream vs. hydrocortisone 1% cream in the treatment of seborrheic dermatitis. Ann Parasitol 2013;59:119-23.
- Pande V, Patel S, Patil V, Sonawane R. Design expert assisted formulation of topical bioadhesive gel of sertaconazole nitrate. Adv Pharm Bull 2014;4:121-30.
- Torres J, Márquez M, Camps F. Sertaconazole in the treatment of mycoses: From dermatology to gynecology. Int J GynaecolObstet 2000;71Suppl 1:S3-20.
- Yerram C, Shaik F, Rajalakshmi R, Amaravathi V, Rubia B, Yasmeen R, et al. Preparation and evaluation of microsponge loaded controlled release topical gel of acyclovir sodium. Int J Biopharm 2012;3:96-102.
- Jelvehgari M, Siahi-Shadbad MR, Azarmi S, Martin GP, Nokhodchi A. The microsponge delivery system of benzoyl peroxide: Preparation, characterization and release studies. Int J Pharm 2006;308:124-32.
- Li SS, Li GF, Liu L, Jiang X, Zhang B, Liu ZG, et al. Evaluation of paeonol skin-target delivery from its microsponge formulation: In vitro skin permeation and in vivomicrodialysis. PLoS One 2013;8:e79881.
- Mohan Kumar V, Veena NM, Manjula BP. Formulation and evaluation of microsponges for topical drug delivery of mupirocin. Int J Pharm Technol Res 2013;5:1435-40.
- Aloorkar NH, Kulkarni AS, Ingale DJ, Patil RA. Microsponges innovative drug delivery system. Int J Pharm SciNanotechnol 2012;5:1597-606.
- Saboji JK, Manvi FV, Gadad AP, Patel BD. Formulation and evaluation of ketoconazole microsponge gel by quassi emulsion solvent diffusion. J Cell Tissue Res 2011;11:2691-6.
- Aldawsari H, Badr-Eldin SM. Microsponges as promising vehicle for drug delivery and targeting: Preparation, characterization and applications. Afr J Pharm Pharmacol 2013;7:873-81.
- Abdelmalak NS, Menshawe SF. A new topical fluconazole microsponge loaded hydrogel: Preparation and characterization. Int J Pharm PharmSci 2012;4:460-8.
- Gadakh PP, Geevarghese R. Evaluation of kinetics and mechanism of drug release from clotrimazolemicrosponge loaded carbopol gel. J Pharm Res 2012;5:4648-51.
- Maiti S, Kaity S, Ray S, Sa B. Development and evaluation of xanthan gum-facilitated ethyl cellulose microsponges for controlled percutaneous delivery of diclofenac sodium. Acta Pharm 2011;61:257-70.
- Jangde R. Microsponges for colon targeted drug delivery system: An overview. Asian J Pharm Technol 2011;1:87-93.
- Mehta M, Panchal A, Shah VH, Upadhyay U. Formulation and in vitro evaluation of controlled release microsponge gel for topical delivery of clotrimazole. Int J Adv Pharm 2012;2:93-101.
- Available from: http://www.brookfieldengineering.com. [Last accessed on 2015 Jan 03].
