- *Corresponding Author:
- Wei Cheng
Department of Head and Neck Oncology, Shaanxi Provincial Tumor Hospital, Xi’an, Shaanxi Province 710061, China
E-mail: chengwei9264@163.com
| Date of Received | 25 July 2023 |
| Date of Revision | 12 December 2023 |
| Date of Acceptance | 08 May 2024 |
| Indian J Pharm Sci 2024;86(3):932-939 |
This is an open access article distributed under the terms of the Creative Commons Attribution-NonCommercial-ShareAlike 3.0 License, which allows others to remix, tweak, and build upon the work non-commercially, as long as the author is credited and the new creations are licensed under the identical terms
Abstract
Role of the Mucin 1 gene in thyroid cancer and its relationship with the adenosine-monophosphate activated-protein kinase-mammalian target of rapamycin signaling pathway were investigated in this work. The ACT-1 thyroid cancer cell lines were employed as the research models and enrolled into three groups based on treatment viz., a control group (no intervention), a small interfering ribonucleic acid-negative control group (transfection of negative control small interfering ribonucleic acid at 100 nM/l into ACT-1 thyroid cancer cells), and a Mucin 1-small interfering ribonucleic acid group (transfection of Mucin 1-small interfering ribonucleic acid at 100 nM/l into ACT-1 cells). The impacts of interfering with Mucin 1 gene on thyroid cancer cell proliferation, apoptosis, adenosine-monophosphate activated-protein kinase, mammalian target of rapamycin, and autophagy-related proteins (light chain 3I and light chain 3 II) were observed. The results indicated that the cell survival rate in Mucin 1-small interfering ribonucleic acid group (53.15±8.23) % was lower to that in control group (95.13±6.42) % (p<0.05), resulting a higher cell apoptosis rate of (15.79±1.36) %, which was (3.11±0.68) % in control group (p<0.05). p-Mammalian target of rapamycin in control group (0.13±0.02) was elevated based on that in Mucin 1-small interfering ribonucleic acid group (0.05±0.01) (p<0.05), while p-adenosine-monophosphate activated-protein kinase in control group (0.16±0.02) was downshifted in contrast to that in Mucin 1-small interfering ribonucleic acid group (0.46±0.03) (p<0.05). Light chain 3I/light chain 3II in control group was (0.28±0.02), being lower in comparison to that in Mucin 1-small interfering ribonucleic acid group (0.46±0.03) (p<0.05). Interference with Mucin 1 gene regulated the biological behaviors of thyroid cancer cells by modulating the adenosine-monophosphate activated-protein kinase-mammalian target of rapamycin signaling pathway.
Keywords
Mucin 1, thyroid cancer, autophagy, adenosine-monophosphate activated-protein kinasemammalian target of rapamycin signaling pathway
Thyroid Cancer (TC) is one of the most common endocrine tumors and its incidence continues to rise[1]. TC is a malignant tumor originating from thyroid tissue, and its pathogenesis is not fully understood. However, some risk factors may be associated with its occurrence, including family history, radiation exposure and inadequate iodine intake[2,3]. This disease can occur at different ages, but the majority of cases are found in middle-aged and elderly populations[4]. Treatment approaches for TC typically include surgical resection, radiation therapy and thyroid hormonal replacement therapy[5]. Surgical resection is the primary treatment method and may involve partial or total thyroidectomy, as well as lymph node dissection. Radiation therapy is often used as adjuvant therapy after surgery to eliminate residual cancer cells[6,7]. Thyroid hormone replacement therapy is utilized to maintain thyroid function and suppress the secretion of Thyroid-Stimulating Hormone (TSH)[8]. Despite some progress in TC treatment, challenges still remain. Late-stage and metastatic cases possess difficulties in treatment and exhibit poorer prognosis. Therefore, further research and clinical trials are still required to enhance early detection, treatment effectiveness and patient survival rates for TC.
Mucin 1 (MUC1), serving as a surface adhesive molecule, plays a significant role in tumor development[9]. MUC1 is highly expressed in various cancers and is associated with adverse prognostic factors such as tumor invasiveness, metastatic capability and drug resistance[10]. However, the understanding of the impact of MUC1 on apoptosis and autophagy in TC cells, as well as the underlying mechanisms, remains incomplete. Apoptosis and autophagy are essential processes for maintaining normal cell life cycles and tissue homeostasis[11]. Apoptosis, a programmed cell death process, is considered a crucial mechanism for inhibiting tumor development[12]. Autophagy is a cellular process involving the degradation and recycling of internal components to maintain energy balance and biological substance metabolism[13]. Recent studies suggest that apoptosis and autophagy play complex regulatory roles in tumor development; however, the influence of MUC1 on apoptosis and autophagy in TC cells remains insufficiently explored[14,15]. Adenosine- Monophosphate Activated-Protein Kinase (AMPK) and mammalian Target of Rapamycin (mTOR) are two key signaling pathways involved in regulating cell metabolism, growth and survival[16]. AMPK, an energy-sensing kinase, can be activated under conditions of cellular energy deficiency, thereby inhibiting the mTOR pathway, which promotes apoptosis and autophagy[17,18]. However, the regulatory mechanisms of MUC1 on the AMPK/ mTOR signaling pathway in TC are not yet welldefined. Therefore, the objective of this work was to investigate the AMPK/mTOR pathway and uncover the regulatory mechanisms of MUC1 gene expression in apoptosis and autophagy of TC cells. This work utilized TC cell lines as a model to interfere with MUC1 gene, observing changes in Cell Apoptosis Rates (CAR) as well as the formation and aggregation of auto phagosomes. Additionally, it assessed the levels of AMPK, mTOR and proteins associated with autophagy to gain a deeper understanding of the impact of the MUC1 gene on the AMPK/mTOR signaling pathway. Through investigating the effects of MUC1 gene on apoptosis and autophagy in TC cells, as well as the regulatory role of the AMPK/mTOR signaling pathway, this work aimed to offer novel targets and strategies for TC treatment, offering new insights into the molecular mechanisms of tumor development. This has significant clinical implications for improving the prognosis and survival rate of TC.
Materials and Methods
Cell lines and culture conditions:
The human TC cell line ACT-1 was selected as the research model. Culture dishes were disinfected using 70 % ethanol and allowed to air dry under sterile conditions. TC cells were retrieved from liquid nitrogen storage tubes and rapidly placed in a 37° preheated water bath. The tubes were gently agitated until the cells were completely thawed. The thawed cells were transferred to sterile culture bottles or dishes containing preheated culture medium (Dulbecco's Modified Eagle Medium (DMEM)) supplemented with 10 % Fetal Bovine Serum (FBS). Ensure that the culture medium fully covers the cells. The cells were placed in a cell culture incubator at 37° with 5 % Carbon dioxide (CO2), and the culture medium was changed regularly, typically every 2-3 d. When the cell density reached 80 %-90 %, subsequent experiments or sub culturing were conducted.
Treatment and interventions of cells:
ACT-1 cells were seeded into a 6-well plate at a density of 1.2×10⁶ cells per well. According to the study design, the cells were enrolled into the following treatment groups. Control group; no intervention or treatment, small interfering Ribonucleic Acid-Negative Control (siRNA-NC) group; transfection of 100 nM/l siRNA-NC into ACT-1 cells and MUC1-siRNA group; transfection of 100 nM/L MUC1-siRNA into ACT-1 cells.
Apoptosis assay:
After treating the ACT-1 cell line, TC cells with MUC1 gene interference were seeded in a 6-well plate according to the grouping method, achieving a cell density of 1.2×10⁶ cells. The cells were placed in serum-free culture medium and incubated at 37° with 5 % CO2 for 24 h to adapt to the culture conditions. Subsequently, cell apoptosis analysis was implemented using the Annexin V/Propidium Iodide (PI) staining kit. The cells were rinsed with serum-free medium, pelleted at the bottom of a centrifuge tube using centrifugation and added with an appropriate volume of serum-free medium to gently suspend the cells. The cells were counted using a cell counting plate or a cell counter to determine the required cell numbers for each group. Following the instructions of the kit, Annexin V-Fluorescein Isothiocyanate (FITC) and PI staining reagents were added to the cell suspension to achieve the appropriate concentration, which was then incubated at room temperature for 15- 30 min, protecting it from light. Eventually, the cells were fixed with a fixation solution to stop the reaction. At this time, the stained cells were analyzed using a flow cytometer, recording and tallying the apoptotic cells in each group.
Autophagy analysis:
The formation and aggregation of auto phagosomes were observed using Green Fluorescent Protein Light Chain 3 (GFP-LC3) transfection or auto phagosome-specific antibody labeling. TC cells were transfected with GFP-LC3 and cultured in a medium for 24 h. The morphology and quantity of intracellular auto phagosomes (green punctate aggregates representing auto phagosomes) were observed using fluorescence microscopy.
Analysis of protein expression:
Levels of key proteins were assessed using Western blotting technique. Total proteins were extracted from TC cells treated with MUC-1 gene interference, followed by Sodium Dodecyl Sulphate-Polyacrylamide Gel Electrophoresis (SDS-PAGE) to separate the proteins, which were then transferred into a Polyvinylidene Fluoride (PVDF) membrane. Subsequently, immunoblotting was conducted using specific antibodies against MUC1, AMPK, mTOR and autophagy-related proteins (Light Chain 3 (LC3) I, LC3 II). Finally, the relative protein expression levels were detected using chemiluminescence and quantitative analysis was performed using image analysis software.
Statistical analysis:
Data entry and statistical analysis were conducted using Statistical Package for the Social Sciences (SPSS) 22.0. For categorical data, frequencies and percentages were used for description, while means and standard deviations were utilized for continuous data. Group comparisons were performed as follows. For normally distributed data, analysis of variance was employed and for non-normally distributed data, the Mann-Whitney U test was applied. p<0.05 was considered statistically significant.
Results and Discussion
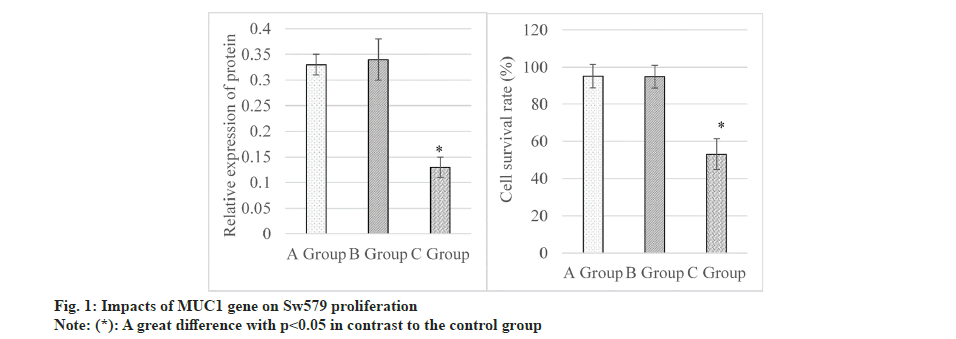
Results of the cell proliferation assay demonstrated that levels of MUC1 protein were (0.33±0.02), (0.34±0.04), and (0.13±0.02) in control, siRNANC and MUC1-siRNA groups, respectively, as illustrated in the left graph in fig. 1. It suggested that MUC1 protein in the MUC1-siRNA group was lower to that in control group, showing an obvious difference (p<0.05). Additionally, the Class Switch Recombination (CSR) were (95.13±6.42) %, (94.86±6.19) %, and (53.15±8.23) % in the control, siRNA-NC, and MUC1-siRNA groups, respectively, as demonstrated in the right graph in fig. 1. These results disclosed that the CSR in MUC1-siRNA group was lower and exhibited a great difference with that in control group (p<0.05).
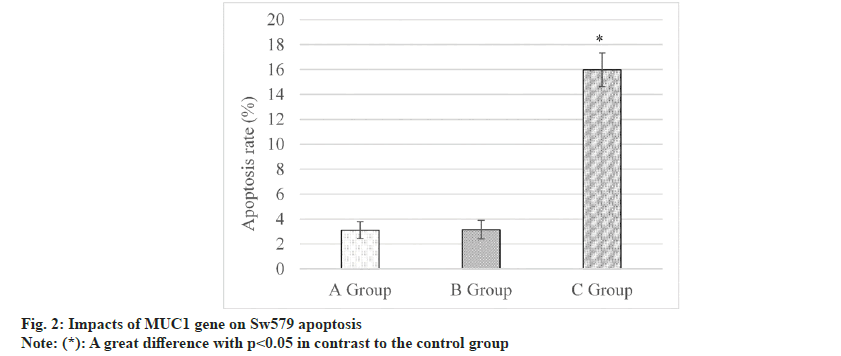
fig. 2 below displayed the results of the cell apoptosis assay. It revealed that the CAR was (3.11±0.68) % in the control group, and (3.15±0.74) % in the siRNA-NC group, and (15.79±1.36) % in the MUC1-siRNA group. CAR in the MUC1- siRNA group was much higher and presented a remarkable difference with that in control group (p<0.05).
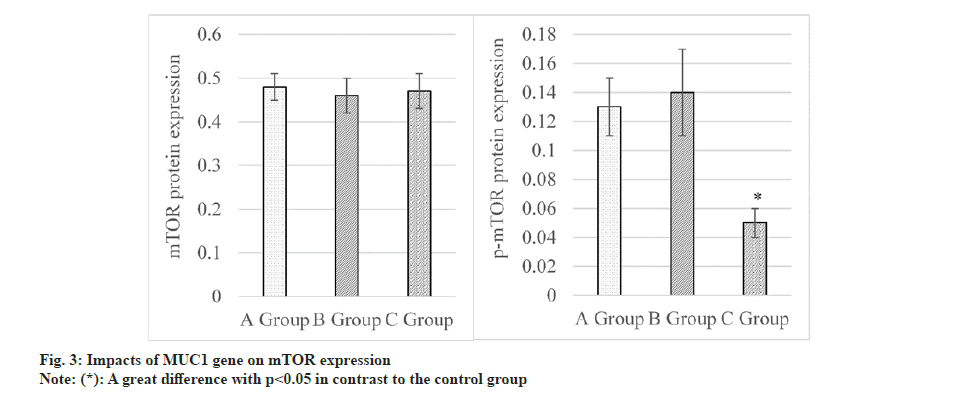
Impacts of MUC1 inhibition on expressions of AMPK and mTOR proteins were assessed, as explicated in fig. 3. The results revealed that mTOR was expressed as (0.48±0.03) in the control group, as (0.46±0.04) in the siRNA-NC group and as (0.47±0.04) in the MUC1-siRNA group. Differences in mTOR among these groups were not statistically remarkable, so p>0.05 was marked. Besides, p-mTOR was observed to be (0.13±0.02), (0.14±0.03), and (0.05±0.01) in the control, siRNA-NC, and MUC1-siRNA groups, respectively. These data indicated that p-mTOR in MUC1-siRNA group was lower and greatly different from that in control group, with an obvious significance (p<0.05).
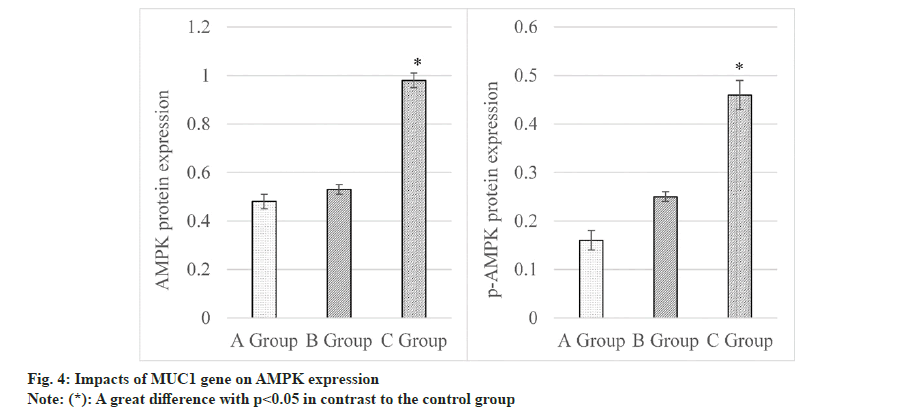
Levels of AMPK were summarized and compared in fig. 4. Rats in control group had the AMPK level of (0.48±0.03), siRNA-NC group was (0.53±0.02), and MUC1-siRNA group was (0.98±0.03). Consequently, AMPK in MUC1-siRNA group was elevated to that in control group, demonstrating a considerable difference (p<0.05). Furthermore, p-AMPK expressions were observed as follows. Control group (0.16±0.02), siRNA-NC group (0.25±0.01) and MUC1-siRNA group (0.46±0.03). It disclosed that p-AMPK in MUC1-siRNA group was higher based on that in control group, presenting an obvious difference (p<0.05).
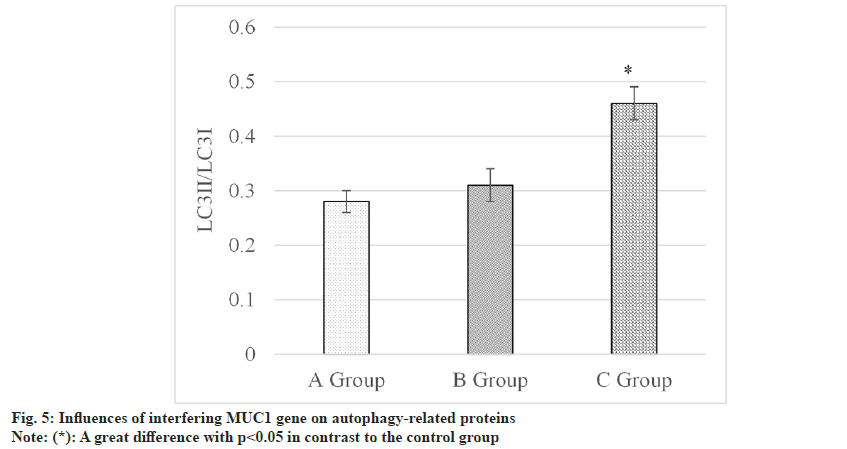
The influences of MUC1 inhibition on autophagyrelated proteins were assessed and summarized in fig. 5. Results revealed the following findings LC3II/LC3I was (0.28±0.02) in the control group, was (0.31±0.03) in siRNA-NC group, and was (0.46±0.03) in MUC1-siRNA group. Thus, this protein in the MUC1-siRNA group was relatively elevated in contrast to the level in control group, showing a remarkable difference with p<0.05.
Upon adding inhibitors of the AMPK-mTOR signaling pathway, results of cell proliferation and apoptosis assays were as shown in Table 1. The CSR for the untreated group (control group) was (95.16±2.92) %, while that for the group subjected to inhibition treatment was (63.73±4.81) %. Thus, the CSR in the untreated group was higher based on that in the inhibition-treated group, presenting a great difference (p<0.05). Additionally, the CAR in the untreated group was (2.82±0.73) %, whereas that in the group subjected to inhibition treatment was (14.04±0.12) %, which was greatly different and exhibited a considerable difference (p<0.05).
| Group | CSR (%) | CAR (%) |
|---|---|---|
| Untreated | 95.16±2.92 | 2.82±0.73 |
| Inhibition-treated | 63.73±4.81 | 14.04±0.12 |
| t | 7.268 | 11.524 |
| p-value | 0.004 | 0.001 |
Table 1: Influences of blocking AMPK-mTOR signaling pathway On TC Cell proliferation and apoptosis
Results of cell autophagy assay upon adding inhibitors of the AMPK-mTOR signaling pathway were displayed in Table 2. The level of LC3II in the untreated group was (0.82±0.11), which was higher in contrast to that in the inhibitiontreated group (0.41±0.05), showing a visible difference (p<0.05). Additionally, levels of LC3I in the untreated and inhibition-treated groups were (1.02±0.15) and (1.22±0.13) respectively. It indicated that LC3I was upshifted in the inhibitiontreated group, showing an obvious difference with that in the untreated group (p<0.05).
| Group | LC3II | LC3I |
|---|---|---|
| Untreated | 0.82±0.11 | 1.02±0.15 |
| Inhibition-treated | 0.41±0.05 | 1.22±0.13 |
| t | 5.934 | 9.986 |
| p-value | 0.002 | 0.003 |
Table 2: Influences of blocking AMPK-mTOR signaling pathway On TC cell autophagy
TC is a frequent malignant tumor of the endocrine system originating from thyroid tissue. In recent years, the incidence of TC has been steadily increasing, becoming a global health concern[19]. It exhibits various subtypes and clinical characteristics and many mysteries still surround its development and treatment mechanisms. TC poses a significant threat to health and quality of life of patients. Firstly, TC can locally invade and metastasize to distant sites, causing destruction of surrounding thyroid tissues and organs, thereby severely impacting patient survival rates and prognosis. Secondly, the thyroid gland is a crucial endocrine organ and the presence and treatment of TC can disrupt thyroid function, affecting metabolic regulation and overall body function. In addition, the diagnosis and treatment process of TC have substantial psychological and social impacts on patients, leading to anxiety, depression and decreased self-esteem[20,21]. Currently, TC treatment mainly includes surgical resection, radiotherapy, radioactive iodine therapy and medication. Although these treatment methods have improved the therapeutic efficacy of TC to a certain extent, challenges and limitations still remain. Some patients may face treatment resistance or relapse and certain high-risk or refractory cases lack effective personalized treatment strategies. To better comprehend the mechanisms of TC occurrence and development and enhance treatment outcomes, many studies focus on delving into the molecular mechanisms and related signaling pathway of TC. AMPKmTOR signaling pathway, as a crucial regulatory mechanism, plays a pivotal role in cellular metabolism and growth[22]. Currently, some studies have indicated the significant regulatory role of the AMPK-mTOR signaling pathway in TC, yet its detailed mechanisms and interconnections require further exploration. Therefore, this work aimed to investigate the role of the AMPK-mTOR signaling pathway in TC, with a specific focus on the influence of MUC1 gene expression on this signaling pathway. By interfering with the expression of the MUC1 gene, it evaluated the changes in the activity of the AMPK-mTOR signaling pathway and its effects on TC cell proliferation, apoptosis and autophagy. This would contribute to a deeper understanding of the pathogenesis of TC, provide theoretical foundations for seeking new targeted treatment strategies and offer new directions for improving clinical management and prognosis for patients.
AMPK is a critical energy regulator that can modulate cellular metabolic pathways, balance nutrient supply and energy demands and is crucial in controlling human diseases[23]. mTOR is a cellular growth regulator that can form mTORC1 and mTORC2 complexes[24]. Due to its high activation in cancer, mTOR becomes a target for enhancing cancer treatment efficiency. Studies have indicated that activation of the AMPK signaling pathway in pancreatic cancer cells can reduce mTOR phosphorylation levels, induce cell autophagy and inhibit proliferation[25]. Research by Morale et al.[26], suggested that estrogen receptor Beta (β) can induce autophagy through the activation of the AMPK/mTORC1 axis. This work aimed to explore the impacts of interfering with MUC1 gene on TC cells and its association with the AMPK-mTOR signaling pathway. It was observed that interference with MUC1 gene leads to inhibited proliferation of TC cells, decreased CSR and increased CAR. Simultaneously, interference with MUC1 gene promoted the formation and aggregation of auto phagosomes in TC cells. The research results demonstrated that interference with MUC1 gene increased the activation of AMPK and suppressed the mTOR signaling pathway. This suggests a crucial regulatory role of the MUC1 gene in modulating the AMPK-mTOR signaling pathway. Furthermore, a significant increase was observed in the expression ratio of autophagyrelated proteins LC3II/LC3I upon interference with MUC1 gene expression, indicating that MUC1 might be involved in the autophagy process of TC cells through regulation of the autophagy signaling pathway.
These research findings hold significant implications. Firstly, it had unveiled the regulatory role of the MUC1 gene in the biological behaviors of TC cells. Secondly, it had established the importance of the AMPK-mTOR signaling pathway under the regulation of the MUC1 gene, further enhancing our understanding of this pathway in TC. However, this work was subjected to some limitations. Firstly, the experiments primarily relied on in vitro cell models, and further in vivo studies would be needed to validate these findings. Secondly, although the impacts of interfering with MUC1 gene on the AMPK-mTOR signaling pathway were observed, the specific regulatory mechanisms still required further investigation. Future research could delve into the mechanisms underlying the interaction between the MUC1 gene and the AMPK-mTOR signaling pathway. Furthermore, exploring other potential signaling pathway and regulatory factors could provide a comprehensive understanding of the mechanisms underlying TC occurrence and development. Indepth exploration of these regulatory mechanisms and interactions would contribute to the development of new targeted treatment strategies, offering more effective treatment options for TC patients.
Interfering MUC1 gene, through the regulation of the AMPK-mTOR signaling pathway, exerted a role in modulating the biological behaviors of TC cells. These findings held significant implications for a deeper understanding of the mechanisms underlying TC progression and the development of new targeted treatment strategies. Future research should further explore the interaction between MUC1 and the AMPK-mTOR signaling pathway, elucidate the regulatory mechanisms involved and investigate other potential signaling pathways. These efforts would contribute to advancing personalized and precise treatments for TC, ultimately improving treatment outcomes and patient prognosis.
Conflict of interests:
The authors declared no conflict of interests.
References
- Zhan XX, Zhao B, Diao C, Cao Y, Cheng RC. Expression of MUC1 and CD176 (Thomsen-Friedenreich antigen) in papillary thyroid carcinomas. Endocrine Pathol 2015;26:21-6.
[Crossref] [Google Scholar] [PubMed]
- Wreesmann VB, Sieczka EM, Socci ND, Hezel M, Belbin TJ, Childs G, et al. Genome-wide profiling of papillary thyroid cancer identifies MUC1 as an independent prognostic marker. Cancer Res 2004;64(11):3780-9.
[Crossref] [Google Scholar] [PubMed]
- Weiss M, Baruch A, Keydar I, Wreschner DH. Preoperative diagnosis of thyroid papillary carcinoma by reverse transcriptase polymerase chain reaction of the MUC1 gene. Int J Cancer 1996;66(1):55-9.
[Crossref] [Google Scholar] [PubMed]
- Pouwer F, Kupper N, Adriaanse MC. Does emotional stress cause type 2 diabetes mellitus? A review from the European Depression in Diabetes (EDID) research consortium. Discov Med 2010;9(45):112-8.
[Google Scholar] [PubMed]
- Siragusa M, Zerilli M, Iovino F, Francipane MG, Lombardo Y, Ricci-Vitiani L, et al. MUC1 oncoprotein promotes refractoriness to chemotherapy in thyroid cancer cells. Cancer Res 2007;67(11):5522-30.
[Crossref] [Google Scholar] [PubMed]
- Shan C, Chen X, Cai H, Hao X, Li J, Zhang Y, et al. The emerging roles of autophagy-related microRNAs in cancer. Int J Biol Sci 2021;17(1):134.
[Crossref] [Google Scholar] [PubMed]
- Bocci V, Valacchi G, Corradeschi F, Aldinucci C, Silvestri S, Paccagnini E, et al. Studies on the biological effects of ozone: 7. Generation of reactive oxygen species (ROS) after exposure of human blood to ozone. J Biol Regulators Homeost Agents 1998;12(3):67-75.
[Google Scholar] [PubMed]
- Pstrag N, Ziemnicka K, Bluyssen H, Wesoły J. Thyroid cancers of follicular origin in a genomic light: In-depth overview of common and unique molecular marker candidates. Mol Cancer 2018;17(1):116.
[Crossref] [Google Scholar] [PubMed]
- Patel KN, Maghami E, Wreesmann VB, Shaha AR, Shah JP, Ghossein R, et al. MUC1 plays a role in tumor maintenance in aggressive thyroid carcinomas. Surgery 2005;138(6):994-1002.
[Crossref] [Google Scholar] [PubMed]
- Padinharayil H, Rai V, George A. Mitochondrial metabolism in pancreatic ductal adenocarcinoma: From mechanism-based perspectives to therapy. Cancers 2023;15(4):1070.
[Crossref] [Google Scholar] [PubMed]
- Gelzo M, Caputo M, Comegna M, Cernera G, Minno AD, Scialo F, et al. Exploiting sterol profile analysis: Over ten years of experience: A narrative review. Acta Med Mediterranea 2021;37(1):35-42.
- Liu Z, Zeng W, Chen T, Guo Y, Zhang C, Liu C, et al. A comparison of the clinicopathological features and prognoses of the classical and the tall cell variant of papillary thyroid cancer: A meta-analysis. Oncotarget 2017;8(4):6222.
[Crossref] [Google Scholar] [PubMed]
- Li Q, Jin WX, Jin YX, Zheng ZC, Zhou XF, Wang QX, et al. Clinical effect of MUC1 and its relevance to BRAF V600E mutation in papillary thyroid carcinoma: A case–control study. Cancer Manag Res 2018;10:1351-8.
[Crossref] [Google Scholar] [PubMed]
- Mishra AP, Saklani S, Salehi B, Parcha V, Sharifi-Rad M, Milella L, et al. Satyrium nepalense, a high altitude medicinal orchid of Indian Himalayan region: Chemical profile and biological activities of tuber extracts. Cell Mol Biol 2018;64(8):35-43.
[Google Scholar] [PubMed]
- Kawakita E, Yang F, Kumagai A, Takagaki Y, Kitada M, Yoshitomi Y, et al. Metformin mitigates DPP-4 inhibitor-induced breast cancer metastasis via suppression of mTOR signaling. Mol Cancer Res 2021;19(1):61-73.
[Crossref] [Google Scholar] [PubMed]
- Turukmane AV, Alhebaishi N, Alshareef AM, Mirza OM, Bhardwaj A, Singh B. Multispectral image analysis for monitoring by IoT based wireless communication using secure locations protocol and classification by deep learning techniques. Optik 2022;271:170122.
- Hu YJ, Luo XY, Yang Y, Chen CY, Zhang ZY, Guo X. Characterization and significance of MUC1 and c-myc expression in elderly patients with papillary thyroid carcinoma. Genet Mol Res 2015;14(4):15325-30.
[Google Scholar] [PubMed]
- Hou S, Xie X, Zhao J, Wu C, Li N, Meng Z, et al. Downregulation of miR-146b-3p inhibits proliferation and migration and modulates the expression and location of sodium/iodide symporter in dedifferentiated thyroid cancer by potentially targeting MUC20. Front Oncol 2021;10:566365.
[Crossref] [Google Scholar] [PubMed]
- Gundamaraju R, Lu W, Paul MK, Jha NK, Gupta PK, Ojha S, et al. Autophagy and EMT in cancer and metastasis: Who controls whom? Biochim Biophys Acta Mol Basis Dis 2022;1868(9):166431.
[Crossref] [Google Scholar] [PubMed]
- Gao N, Flynn DC, Zhang Z, Zhong XS, Walker V, Liu KJ, et al. G1 cell cycle progression and the expression of G1 cyclins are regulated by PI3K/AKT/mTOR/p70S6K1 signaling in human ovarian cancer cells. Am J Physiol Cell Physiol 2004;287(2):C281-91.
[Crossref] [Google Scholar] [PubMed]
- Deldar Abad Paskeh M, Asadi S, Zabolian A, Saleki H, Khoshbakht MA, Sabet S, et al. Targeting cancer stem cells by dietary agents: An important therapeutic strategy against human malignancies. Int J Mol Sci 2021;22(21):11669.
- Biancur DE, Kimmelman AC. The plasticity of pancreatic cancer metabolism in tumor progression and therapeutic resistance. Biochim Biophys Acta Rev Cancer 2018;1870(1):67-75.
[Crossref] [Google Scholar] [PubMed]
- Baek SK, Woo JS, Kwon SY, Lee SH, Chae YS, Jung KY. Prognostic significance of the MUC1 and MUC4 expressions in thyroid papillary carcinoma. Laryngoscope 2007;117(5):911-6.
[Crossref] [Google Scholar] [PubMed]
- Abrosimov A, Saenko V, Meirmanov S, Nakashima M, Rogounovitch T, Shkurko O, et al. The cytoplasmic expression of MUC1 in papillary thyroid carcinoma of different histological variants and its correlation with cyclin D1 overexpression. Endocrine Pathol 2007;18:68-75.
[Crossref] [Google Scholar] [PubMed]
- Tu H, Tang LJ, Luo XJ, Ai KL, Peng J. Insights into the novel function of system Xc-in regulated cell death. Eur Rev Med Pharmacol Sci 2021;25(3):1650-62.
[Crossref] [Google Scholar] [PubMed]
- Morale MG, Tamura RE, Rubio IG. Metformin and cancer hallmarks: Molecular mechanisms in thyroid, prostate and head and neck cancer models. Biomolecules 2022;12(3):357.
[Crossref] [Google Scholar] [PubMed]
