- *Corresponding Author:
- S. Wang
Department of Urology, The Affiliated Huai’an Hospital of Xuzhou Medical University and The Second People’s Hospital of Huai’an, No.62, Huaihai Road(S.), Huai’an, Jiangsu 223002, China
E-mail: wangsuguiwsg2342@163.com
This article was originally published in Special issue, “Trends in Therapeutic Management of Various Clinical Conditions-II” |
Indian J Pharm Sci 2021:83(2) Spl issue;12-17 |
This is an open access article distributed under the terms of the Creative Commons Attribution-NonCommercial-ShareAlike 3.0 License, which allows others to remix, tweak, and build upon the work non-commercially, as long as the author is credited and the new creations are licensed under the identical terms
Abstract
To explore the value of circulating micro ribonucleic acid expression in serum in the diagnosis of prostate cancer, this paper used The Cancer Genome Atlas database to download prostate cancer related datasets, analyze the expression of circulating micro ribonucleic acids in serum of prostate cancer tissues, screen differentially expressed micro ribonucleic acids, and find that micro ribonucleic acid-141 is significantly different. Then select 30 patients with prostate cancer in urology, and 20 patients with benign prostatic hyperplasia in the same period as research subject. The control group was 20 healthy subjects in the same period. The expression of serum micro ribonucleic acid-141 in control group, benign prostatic hyperplasia group and prostate cancer group was detected by fluorescent quantitative Polymerase Chain Reaction, and the content of total prostate specific antigen before treatment in prostate cancer group. The results showed that the expression level of serum micro ribonucleic acid-141 in the prostate cancer group was (11.2±8.1) times higher than that in the control group, which was significantly higher than that in the benign prostatic hyperplasia group (1.65+1.73) and the control group. The difference was statistically significant (p<0.05). The expression level of serum micro ribonucleic acid-141 in prostate cancer group was positively correlated with total prostate specific antigen level, correlation coefficient r=0.753, statistically significant (p<0.05). Serum micro ribonucleic acid-141 expression level is associated with Gleason score, clinical stages and occurrence of metastasis. With the increase of clinical stage, the expression level of micro ribonucleic acid increased. It is concluded that serum circulating micro ribonucleic acid-141 can be used as a molecular indicator for the diagnosis of prostate cancer.
Keywords
Micro ribonucleic acid-141, prostate cancer, fluorescent quantitative polymerase chain reaction, prostatic hyperplasia
Prostate cancer refers to a malignant tumor that occurs in the male prostate epithelium and is one of the common malignant tumors in the male genitourinary system[1-3]. According to the latest statistics in China, the incidence of prostate cancer is as high as 99 100/1 00 000, ranking sixth in malignant tumors[4]. And it grows at an annual rate of 11 %, especially for men over 55 y old. Early prostate cancer usually has no symptoms. When the tumor blocks the urethra or invades the bladder neck, lower urinary tract symptoms may occur. It is difficult to distinguish from benign prostatic hyperplasia (BPH) symptoms. In severe cases, acute urinary retention, hematuria, and urinary incontinence may occur, or bone pain, pathological fractures and other symptoms caused by bone metastases, and it may even result in lower limb paralysis. When patients have clinical symptoms, they often have advanced prostate cancer, with short survival and poor prognosis. Early diagnosis is of great significance for the treatment of prostate cancer[5,6]. Therefore, finding new indicators will better assist in the treatment of prostate cancer. Related studies have shown that circulating micro ribonucleic acid’s (miRNA’s) are peripheral tumor indicators that can be used for cancer diagnosis. Its miRNA is a kind of nucleic acid molecule widely involved in gene regulation, which plays a key role in tumor proliferation, invasion, metastasis, angiogenesis and immune escape by affecting target Messenger RNA (mRNA)[7]. At the beginning of the 21st century, Mitchell and others at first reported the study of circulating miRNAs as novel tumor indicators. Since then, several studies have found that miRNA expression levels are correlated with tumorigenesis and development, indicating that it is feasible to use miRNA as tumor diagnostic indicators[8].
In the early days, miRNA research focused on tissue specimens, but due to difficult and invasive procedures, miRNAs have limitations in clinical applications. With the further development of miRNA research, it has been found that miRNAs can also be detected in the circulation, and a large number of studies on circulating miRNAs have been carried out[9,10]. The stable presence of miRNAs in the circulation depends on three pathways: firstly, binding to RNA-binding proteins, such as Argonaute; secondly, binding to lipid complexes, such as high-density lipoproteins; and thirdly, wrapped by a membranous structure, such as extracellular vesicles (EVs)[11]. In this study, we used the Cancer and Tumor Gene Mapping Program (The Cancer Genome Atlas-TCGA) database to download prostate cancerrelated datasets, analyze the expression of circulating miRNAs in serum of prostate cancer tissues, screen significantly differentiated micro ribonucleic acid-141 (miRNA-141), and explore serum circulating miRNAs by Fluorescent Quantitative Polymerase chain reaction (PCR). To investigate if miRNA-141 can be used as a molecular indicator for the diagnosis of prostate cancer.
Materials and Methods
Screening methods:
The comparison of miRNA expression in prostate cancer tissues and paracancerous tissues was performed by downloading high-throughput sequencing expression data and miRNA expression profiling data of prostate cancer in TCGA (http: cancergenome.nih. gov) and using R (programming language) software (htttps://www.r-project.org) for pre-treatment of the above prostate cancer related miRNA expression data, screening for differentially expressed genes (DEGs), threshold value is set to False Discovery Rate (FDR) <0.05, differential expression multiple (fold change- FC), |FC|>1.The horizontal axis of the volcano map is -Log10 (FDR). The larger the value is, the more significant the difference[12]; the vertical axis is Log FC, and the more deviation from the center, the greater the expression multiple. The point above the horizontal axis represents a highly expressed miRNA (Log FC>1), and the green point below the horizontal axis represents a low expression miRNA (Log FC<-1). Finally, 50 specimens of adjacent tissues and 455 specimens of prostate cancer were included. High-expression and poor prognosis miRNA screening in prostate cancer tissues is performed with the R language package (edge package) to map the heat map and volcano map of miRNA expression in prostate cancer tissues, and Kaplan-Meier survival curve is used to analyze the survival of prostate cancer patients, and to screen out potential bioindicator miRNAs (high expression, poor prognosis).
A total of 159 differentially expressed miRNAs were found in prostate cancer tissues, with down-regulated expression of 59 and up-regulated expression of 100. According to Kaplan-Meier survival analysis, prostate cancer patients with high expression of miRNA-141 had poor prognosis.
Subject selection criteria:
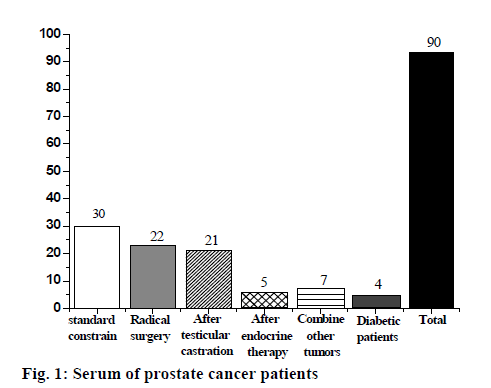
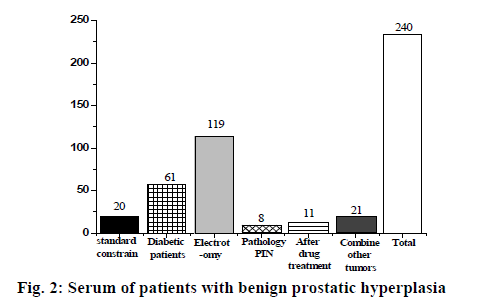
Based on the above results, we found 90 male patients who had been diagnosed with prostate cancer, and finally selected 30 patients, as shown in fig. 1. There were 240 cases in the prostatic hyperplasia serum group, 220 cases were excluded according to the exclusion criteria, and 20 cases were selected, as shown in fig. 2; 20 people were selected in the control group according to the exclusion criteria, aged between 25 and 30 y old.
This experiment is based on the premise of voluntary participation, and the corresponding informed consent information is signed, and the program is approved and requires the medical personnel, experts and scholars to follow up in whole course.
The standard of the experiment is that patients with prostate cancer and patients with benign prostatic hyperplasia need to be diagnosed by rectal ultrasound tissue biopsy; patients with prostate cancer are not treated with radiotherapy or chemotherapy; other malignant tumors are excluded; cardiovascular and cerebrovascular diseases are excluded; diabetes is excluded; severe diseases of liver, the gallbladder and kidneys are excluded; abnormality of mentality and patients who cannot complete the experiment for various reasons are excluded.
Specific experimental method:
For the experimental group, 5 ml of blood was collected from the vein in the morning on an empty stomach, and the blood was allowed to coagulate at 37º for 1 to 2 h. After the serum was precipitated under natural conditions, centrifuge it at 4º for 10 min, 3000 rpm, and place the separated serum in a tube of RNase-free Eppendorf (EP) tube, and dispense it into small portions, and store the ultra-low temperature refrigerator at -80º.
An equal volume of lysate merozoite (MZ) was added to each 200 μl of serum, and the shaker was shaken for 30 s then settled at room temperature for 5 min, to make the nucleic acid protein complex completely separated; centrifuged at 12 000 rpm (~13 400×g) for 10 min at room temperature, and the supernatant was taken into a new RNase-free EP tube; add 200 μl of chloroform to it, shake vigorously for 15 s, and settle it for 5 min at room temperature; then centrifuge it at room temperature 12 000 rpm (~13 400×g) for 15 min, carefully handle the tube, it will be found to be divided into three layers: the bottom is the yellow organic phase, the middle layer and the topmost colorless aqueous phase. The RNA is mainly in the uppermost aqueous phase, and the aqueous phase is transferred to the new EP tube; then reckon the volume, and slowly add 1/3 volume of absolute ethanol to it and mix fully. The obtained solution and the precipitate were transferred to the adsorption column miRspin, settled at room temperature for 2 min, centrifuged at 12 000 rpm (~13 400×g) for 30 s, and after centrifugation, the adsorption column miRspin was discarded, and the effluent was retained.
Next, the volume of the effluent was estimated, and 2/3 volume of absolute ethanol was slowly added, and further mixed fully. Transfer the obtained solution and precipitate together to the adsorption column miRelute, settle at room temperature for 2 min, centrifuge at 12 000 rpm (-13 400×g) for 30 s, discard the effluent after centrifugation, retain the adsorption column miRelute; add 500 μl protein solution Maximum Recovery Diluent (MRD) to the adsorption column miRelute, settle at room temperature for 2 min, centrifuge at room temperature at 12 000 rpm (~13 400×g) for 30 s, discard the waste liquid; add 600 μl of rinse solution (Rinsing water RW) to the adsorption column miRelute, settle at room temperature for 2 min, centrifuge at room temperature at 12 000 rpm (~13 400×g) for 30 s, discard the waste liquid; put the adsorption column miRelute into 2 ml of RNase-free EP tube, centrifuge at 12 000 rpm (~13 400×g) for 1 min at room temperature and remove residual liquid; transfer the adsorption column miRelute to a new centrifuge tube. Add about 20 μl of RNase-free double distilled water (ddH20) to a 1.5 ml centrifuge tube, settle for 2 min at room temperature, and centrifuge at room temperature at 12 000 rpm (~13 400×g) for 2 min.
Before the experiment, the ultra-clean workbench was irradiated with ultraviolet light for 30 min, the surrounding air is warmed up by the PCR instrument, the reagent in the kit is thawed at room temperature, and the reagent is centrifuged before use; the RNA is diluted through Diethylpyrocarbonate (DEPC) water. The total RNA concentration was diluted to 0.5 μg/μl, and the following reagents were added to the RNase free reaction tube to be pre-cooled on ice for a total volume of 20 μl. The reaction solution prepared above was gently mixed in the pipette and was briefly centrifuged and settled at 37º for 60 min. The resulting reaction solution was directly subjected to a downstream experiment.
Reverse transcription reaction:
After the first step of reagent preparation, continue to use ultraviolet light to illuminate the ultra-clean workbench for 30 min, thaw the reagent at room temperature, and centrifuge the reagent before use. The reaction solution prepared above was gently mixed according to Table 1 in the pipette. After a brief centrifugation, the reaction was carried out at 37º for 60 min. The synthesized complementary DNA (cDNA) reaction solution can be stored at -20º, or be directly subjected to downstream fluorescence quantitative detection.
| Reagent component | Volume |
|---|---|
| Poly(A) reaction solution | 1.5 µl |
| 10x reverse-transcription (RT) primer | 2.5 µl |
| 10x RT Buffer | 2 µl |
| Ultra-pure deoxyribonucleotide triphosphate (dNTP) Mixture (2.5 mm each) | 1 µl |
| RNasin(40 U/µl) | 1 µl |
| Quantitative reverse transcriptase (Quant RTase) | 0.5 µl |
| RNase-free ddH20 | 20 µl |
| Total volume |
Table 1: Reagent Ratio Scheme
Fluorescence quantitative detection
First, dilute the primer and dilute the reagent concentration to 100 μM according to the information in the kit to take the liquid needed. The 2x miRcute miRNA prem reagent and Reverse primer (10 μM) were thawed at room temperature; the reagents were placed on ice and assayed according to the reaction scheme of Table 2.
| Reagent component | Volume | ||
|---|---|---|---|
| 2x miRcute miRNA prem | 1.5 µl | ||
| Hsa-miR-141-forward primer | 2.5 µl | ||
| Reverse primer (10 µm) | 2 µl | ||
| miRNA First strand cDNA | 1 µl | ||
| ddH20 | 1 µl | ||
| Total volume | 20 µl | ||
| Reaction conditions | |||
| cycle | temperature | time | content |
| 1 x | 95º | 120 s | Initial template denaturation |
| 50 x | 95º | 20 s | Template deformation in PCR cycle |
| 60º | 30 s | annealing | |
| 70º | 30 s | extend | |
Table 2: Reagent Preparation Reaction System
Data analysis:
2-ΔΔCt method for data analysis was adopted in the experiment. The expression level of the miRNA-141 in control group was set to 1, according to the expression level of miRNA-141:
Fold change=2-ΔΔCt, =ΔCt experimental group - ΔCt Control group = (CtmiRNA-CtU6) experimental group - CtmiRNACtU6) Control group
The expression levels of serum miRNA-141 in each group were calculated. At the same time, the statistical software Statistical Package for the Social Sciences (SPSS) 10.0 was used for statistical analysis. The measurement data conforming to the normal distribution were expressed as x±s (mean±standard deviation), the t-test was used, the counting was performed by chisquare test, and the correlation analysis was performed using spearman bivariate correlation analysis. The data is statistically significant at p<0.05.
Results and Discussion
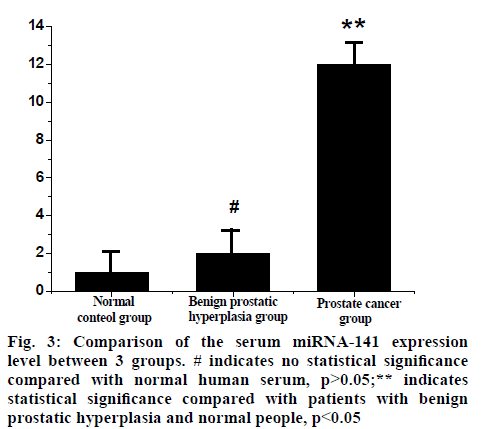
The expression level of serum miRNA-141 in the prostate cancer group was (11.22±8.19) times higher than that in the control group, which was significantly higher than that in the benign prostatic hyperplasia group (1.65~1.73) and the control group, the difference was statistically significant (p<0.05). There was no significant difference between the benign prostatic hyperplasia group and the control group (p>0.05), as shown in fig. 3.
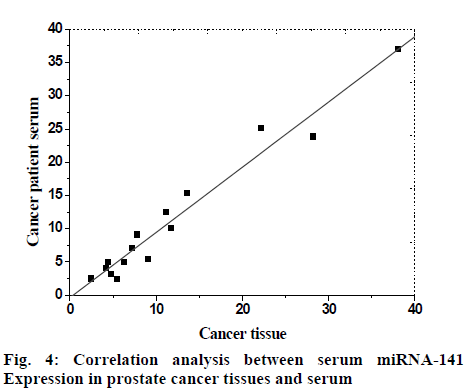
There was a positive correlation between miRNA-141 expression in prostate cancer tissues and in serum, p<0.05, which was statistically significant. The correlation coefficient was 0.92, which was shown by scatter diagram, as shown in fig. 4.
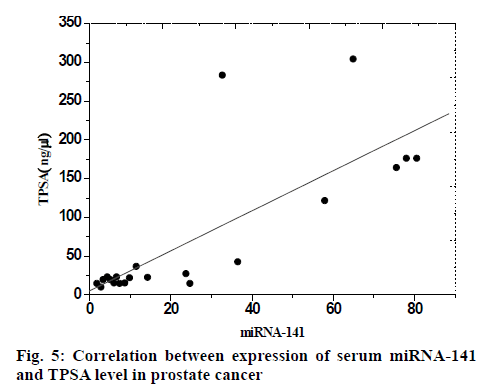
The expression level of serum miRNA-141 in prostate cancer group was positively correlated with total prostate specific antigen (TPSA) level, the correlation coefficient was r=0.75, which was statistically significant (p<0.05), and the correlation coefficient was 0.71, which was represented by scatter plot, as shown in fig. 5.
The results showed that serum miRNA-141 expression levels were associated with Gleason score, clinical stage and occurrence of metastasis (p<0.05), and the expression levels of miRNA increased with clinical stage. However, miRNA levels were not associated with serum prostate specific antigen (PSA) levels (p>0.05), as shown in Table 3.
| Factor | Number of cases | miRNA-141 (2-ΔCt×10-4) | t | p |
|---|---|---|---|---|
| Age | ||||
| 54-65 | 9 | 17.21±2.32 | 0.53 | 0.72 |
| > 65 | 21 | 19.32±3.85 | ||
| Gleason score | ||||
| ≤ 7 | 7 | 16.31±2.35 | 2.53 | 0.012 |
| > 7 | 23 | 23.42±3.25 | ||
| Whether to transfer | ||||
| Yes | 5 | 23.64±4.65 | 4.54 | 0 |
| No | 25 | 15.27±2.40 | ||
| Serum PSA (µg/l) | ||||
| ≤ 10 | 4 | 18.53±3.01 | 0.259 | 0.874 |
| > 10 | 26 | 18.01±3.12 |
Table 3: Correlation Of Clinical Pathological Parameters In Patients With Prostate Cancer
The miRNA-141 is a kind of microRNA. Studies have shown that microRNA plays an important regulatory role in the growth, differentiation and proliferation of various cancer cells and the expression level in serum is consistent with the expression level in tumor tissues, and the stability is high. It is not easily interfered by other factors and can be used as a specific indicator for tumor diagnosis and efficacy evaluation. The results of this experiment showed that the expression level of circulating miRNA-141 in serum of patients with prostate cancer was significantly increased, and it was positively correlated with the level of TPSA.
In this study, the expression of miRNA-141 in serum of each group was detected by fluorescent quantitative PCR. The results showed that the expression level of serum miRNA-141 in prostate cancer group was (11.2±8.2) times higher than that in control group, which was significantly higher than that in benign prostatic hyperplasia group (1.65±1.73) and the control group, there was no significant difference between the benign prostatic hyperplasia group and the control group, suggesting that miRNA-141 expression was also present in the serum of patients with benign prostatic hyperplasia, but the expression of miRNA-141 was significantly increased when malignant tumors occurred, and the expression level of serum miRNA-141 in prostate cancer group was positively correlated with TPSA level (r=0.753), suggesting that serum miRNA-141 level determination can be used as a specific indicator for early diagnosis of prostate cancer. miRNAs are endogenous, single-stranded, smallmolecule non-coding RNAs that are generally 19 to 25 nucleotides in length and are important in many developmental and physiological processes. In this study, the serum miRNA-141 levels of the two groups were compared. The miRNA-141 level in the observation group was significantly higher than that in the control group, indicating that the expression of miRNA-141 in the serum of prostate cancer patients was different from that in normal human serum. Significant up-regulation was observed; the expression level of serum miRNA-141 in prostate cancer group was positively correlated with TPSA level. There is also a correlation between the expression level and the Gleason score and whether metastasis occurs. It is suggested that serum miRNA-141 can be used as a molecular indicator for the diagnosis of prostate cancer. The current mechanism of how circulating miRNAs enter the bloodstream is unclear. Recent studies have shown that tumor cells encapsulate miRNAs through vesicles and release them into the blood circulation. Therefore, miRNA can be used not only as an indicator for diagnosing tumors, but also as a potential treatment for individualized treatment by expression and signal transduction of mediating target cell. However, the main problem is that circulating miRNAs have low sensitivity. Selecting high-sensitivity and highspecificity detection methods is an urgent problem to be solved currently.
Author’s contributions:
Haimei Wang and Liping Wang contributed equally to this work.
Acknowledgements:
This work was supported by Natural Science Foundation of Huai’an (HAB201730); Yancheng Science and Technology Development Fund (YK2018128).
Conflict of Interests:
The authors declared no conflict of interest.
References
- Li Z, Ma YY, Wang J, Zeng XF, Li R, Kang W, et al. Exosomal microRNA-141 is unregulated in the serum of prostate cancer patients. Onco Targets Ther 2016;9:139.
- Braczkowski RS, Kwiatkowski R, Danikiewicz A, Gorczynska-Kosiorz S, Trautsolt W, Braczkowska B, et al. Vitamin D receptor gene polymorphisms and prostate cancer. J Biol Regul Homeost Agents 2018;32(5):1245-8.
- Bobrowska-Korczak B, Skrajnowska D, Kiss AK, Wrzesien R, Bielecki W, Orzol A, et al. Lipid peroxidation as a predictive biomarker of the early stage of cancer. J Biol Regul Homeost Agents 2019;33(3).
- Endzelins E, Berger A, Melne V, Bajo-Santos C, Sobolevska K, Abols A, et al. Detection of circulating miRNAs: comparative analysis of extracellular vesicle-incorporated miRNAs and cell-free miRNAs in whole plasma of prostate cancer patients. BMC cancer 2017;17(1):730.
- Fabris L, Ceder Y, Chinnaiyan AM, Jenster GW, Sorensen KD, Tomlins S, et al. The potential of microRNAs as prostate cancer biomarkers. Eur Urol 2016;70(2):312-22.
- Alhasan AH, Scott AW, Wu JJ, Feng G, Meeks JJ, Thaxton CS, et al. Circulating microRNA signature for the diagnosis of very high-risk prostate cancer. Proceedings of the National Academy of Sciences 2016;113(38):10655-60.
- Kelly BD, Miller N, Sweeney KJ, Durkan GC, Rogers E, Walsh K, et al. A circulating microRNA signature as a biomarker for prostate cancer in a high risk group. J Clin Med 2015;4(7):1369-79.
- Sharova E, Grassi A, Marcer A, Ruggero K, Pinto F, Bassi P, et al. A circulating miRNA assay as a first-line test for prostate cancer screening. Br J Cancer 2016;114(12):1362-6.
- He Y, Lin J, Kong D, Huang M, Xu C, Kim TK, et al. Current state of circulating microRNAs as cancer biomarkers. Clin Chem 2015;61(9):1138-55.
- Mihelich BL, Maranville JC, Nolley R, Peehl DM, Nonn L. Elevated serum microRNA levels associate with absence of high-grade prostate cancer in a retrospective cohort. PLoS One 2015;10(4):e0124245.
- Syring I, Bartels J, Holdenrieder S, Kristiansen G, Muller SC, Ellinger J. Circulating serum miRNA (miR-367-3p, miR-371a-3p, miR-372-3p and miR-373-3p) as biomarkers in patients with testicular germ cell cancer. J Urol 2015;193(1):331-7.
